GitHub - brendangregg/FlameGraph: Stack trace visualizer
github.comStack trace visualizer. Contribute to brendangregg/FlameGraph development by creating an account on GitHub.

Fast implementation of the 1BRC in Rust with 0 crates.
Optimizing a math expression parser for speed and memory.

Different python profiling tools use different methodologies for gathering performance data and hence have different runtime overhead. Before choosing a profiler tool it is helpful to understand two commonly employed techniques for collecting performance data : Deterministic profiling Deterministic profilers execute trace functions at various points of interest (e.g. function call, function return) and record […]
If you are working in the area of scientific computing, in academia or industry, most likely you are using Python in some form. Traditionally Python is described as slow when it comes to performance and there are number of discussions about speed compared to native C/C++ applications 1 2. The goal of this post is […]
ramblings by Adam Perry
Investigating Java warmup performance using flame graphs and the Linux perf profiler.
Analyzing performance can be challenging, especially when diagnosing regressions. Finding the right methods to investigate performance issues is often time-consuming and complex. You may have heard of perf, a powerful Linux tool for performance measurement, available from the kernel. This post will guide you through using perf to analyze performance on Linux, serving as a practical “quick start” guide for those new to profiling Java applications with perf. It’s not meant to be a comprehensive tutorial, as many of those already exist in the extensive documentation of perf and other excellent sources. However, the examples provided may be all you need or, at the very least, give you an idea of where to look for deeper insights.

Blog on Java, Performance, Concurrency, NIO, Unsafe, Low latency, Programming, Software, Philosophy
Blog on Java, Performance, Concurrency, NIO, Unsafe, Low latency, Programming, Software, Philosophy
Updated on 2023-06-09: bumped version numbers and usage examples.A more comprehensive clj-async-profiler documentation is available on Knowledge Base.Runnable code for this post can be found here.I...

A C++ implementation of the Leiden algorithm

In the previous blog about the program execution environment, we introduced the concept of stack unwinding with frame pointers as one of the techniques leveraged for profiling a program. In this blog, we’ll see practically how we can build a basic sampling-based continuous profiler. Since we don’t want the application to necessarily be instrumented, we can use the Linux kernel instrumentation. Thanks to eBPF we’re able to dynamically load and attach the profiler program to specific kernel entry points, limiting the introduced overhead by exchanging data with userspace through eBPF maps.
It is not surprising that the question of Clojure's long startup time is raised time and time again on forums and social media. This topic concerns users who want to use Clojure as a scripting lang...
Differential Flame Graphs

I mapped out over 100 Profilers, what Profile Data Formats they output, and what Profiler UIs can visualise those formats: Profilerpedia
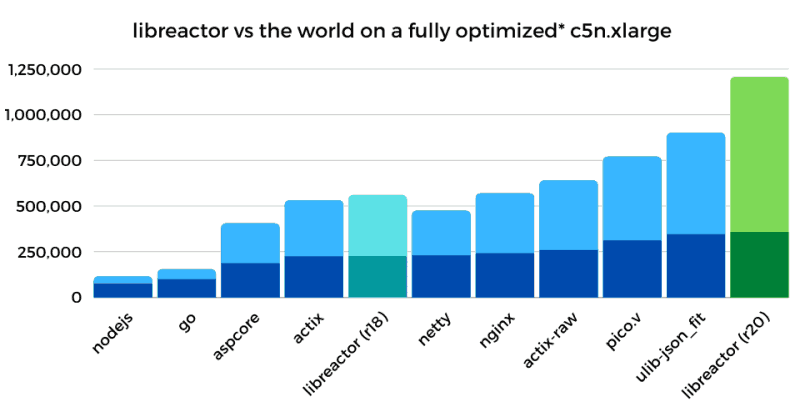
This post will walk you through the performance tuning steps that I took to serve 1.2 million JSON 'API' requests per second from a 4 vCPU AWS EC2 instance.
Blog on Java, Performance, Concurrency, NIO, Unsafe, Low latency, Programming, Software, Philosophy
Fast implementation of the 1BRC in Rust with 0 crates.
Optimizing a math expression parser for speed and memory.
A personal website of Shuhei Kagawa. I write mostly on web technologies and life.
In this post we will show you how to profile your Elixir application with perf and visualise its stack trace with Flamegraphs. We’ll create a basic Phoenix web server with two endpoints which we will call in order to profile and analyse its performance.
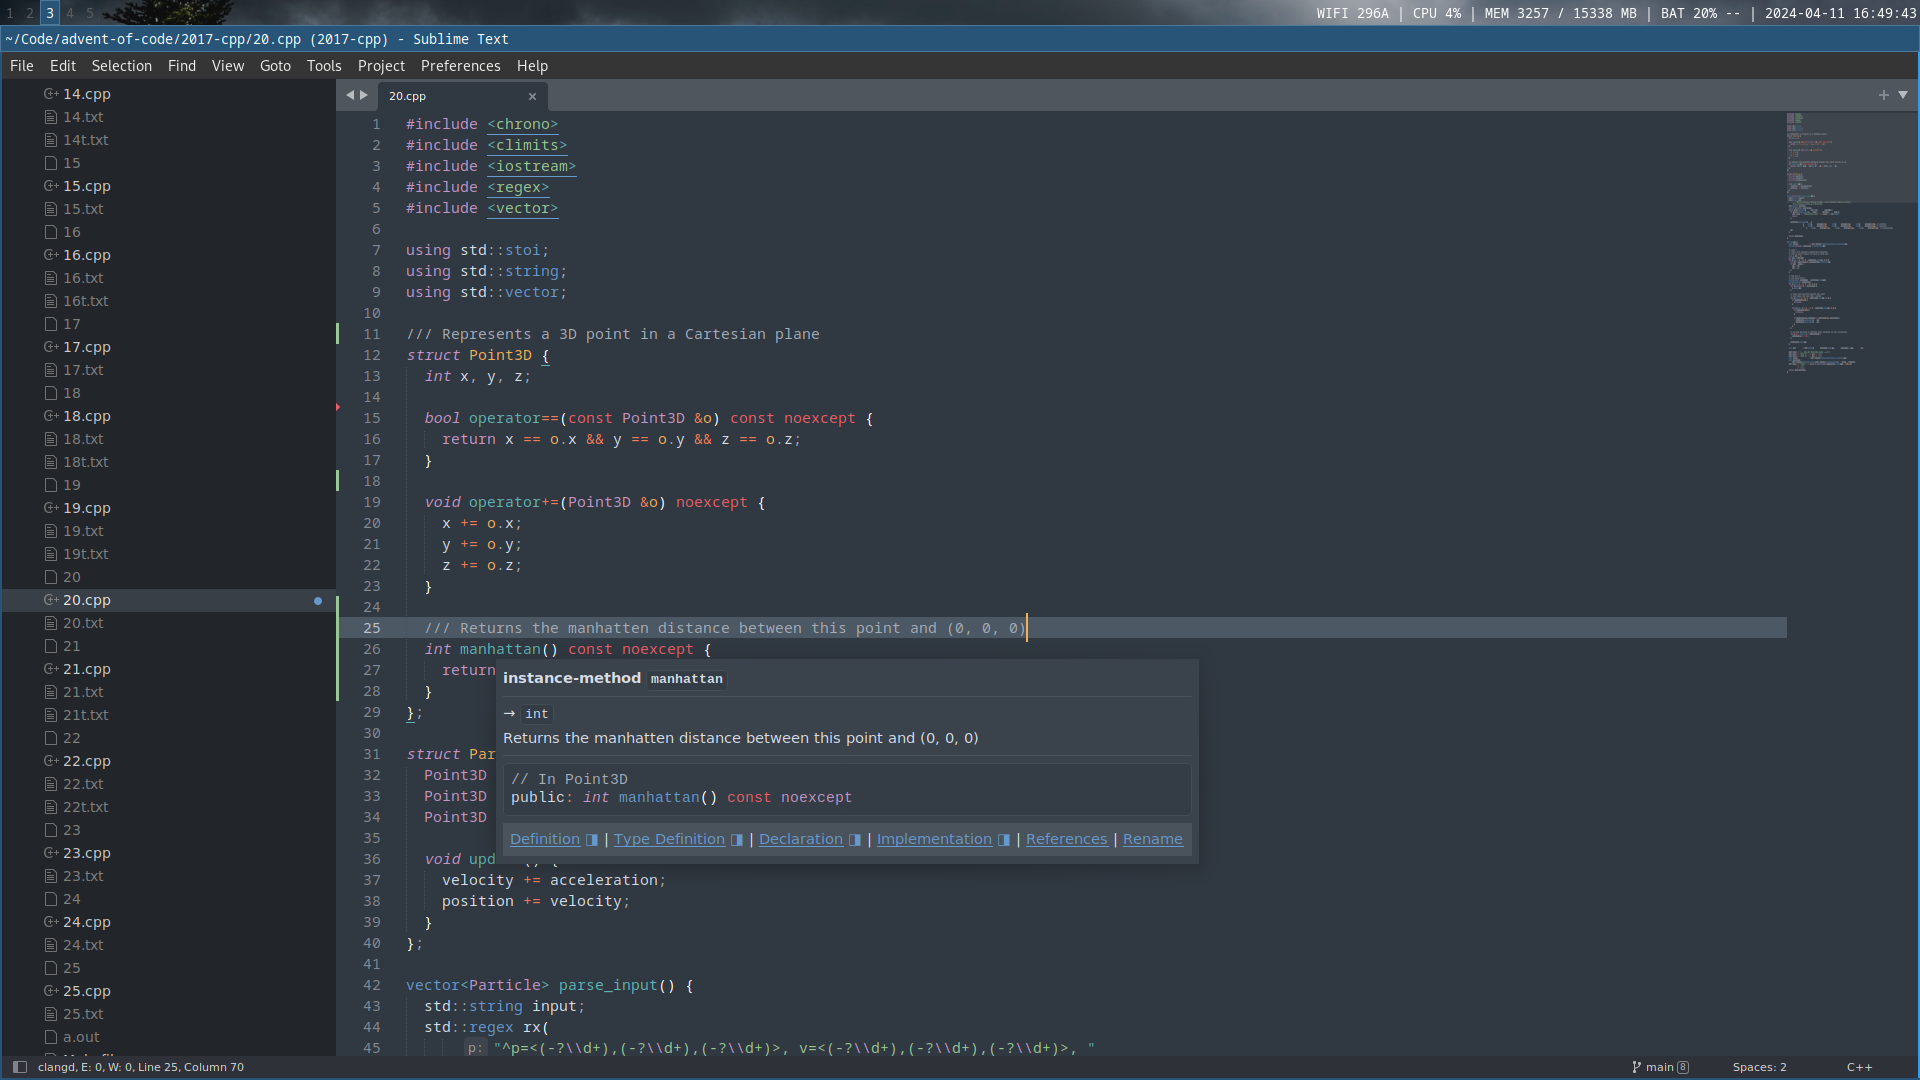
My C++ development setup using Sublime Text 4 with Clangd as the language server.

Adding 1000 requests per second to a query by using perf and flame graphs.

In this post I would like to describe my recent experience of troubleshooting a slow-starting systemd unit implemented in .NET. While Linux troubleshooting is still new territory for me, I am gradu…
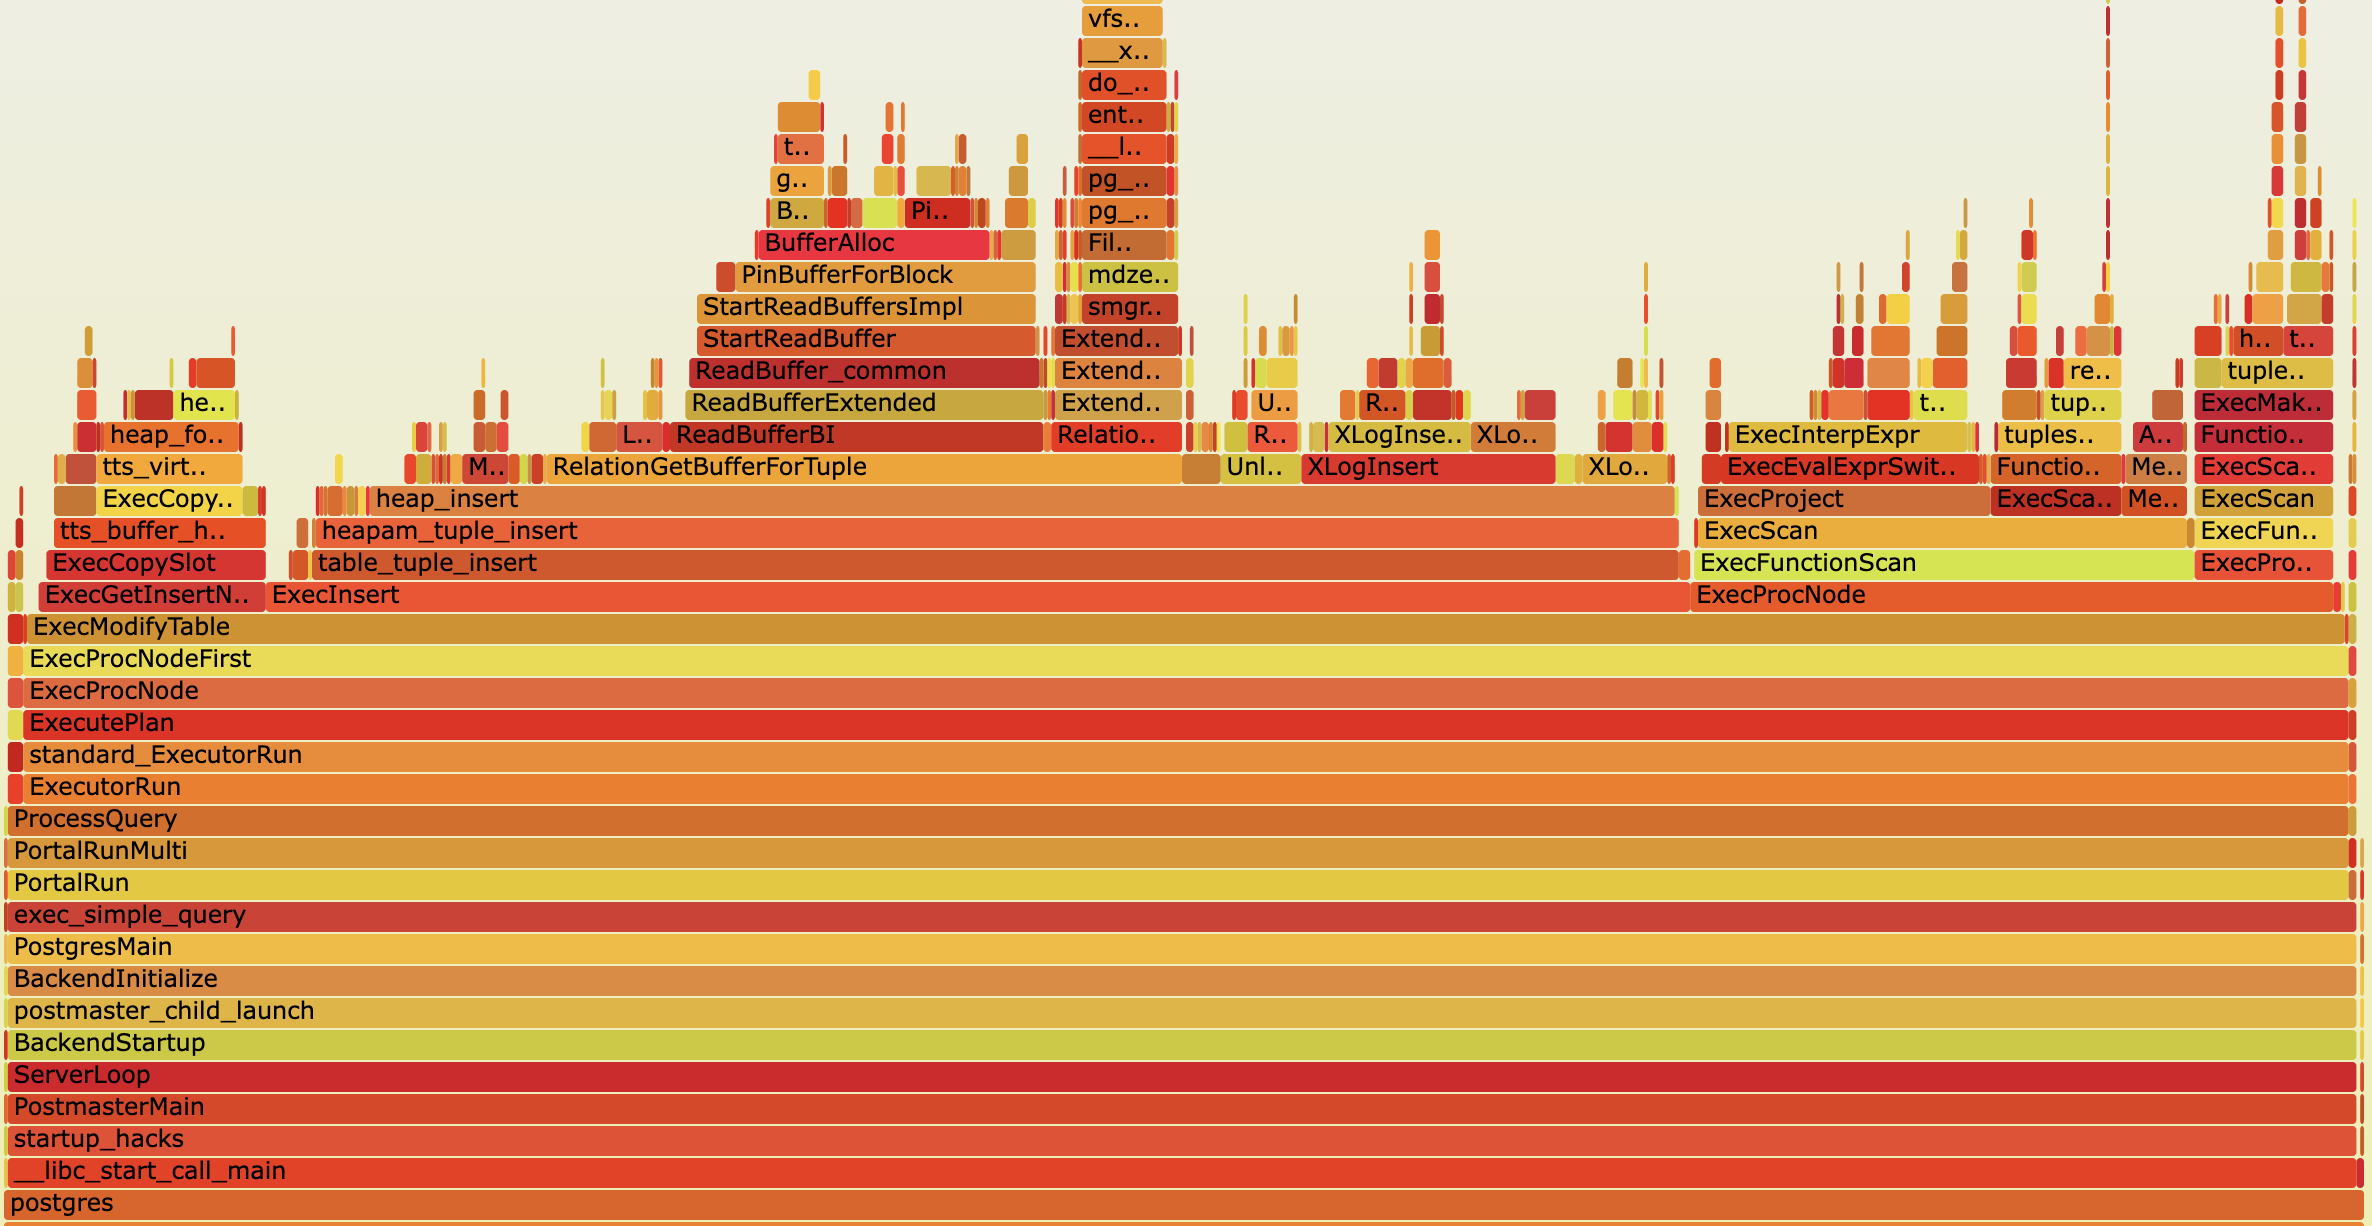
A flame graph is a graphical representation that helps to quickly understand where a program spends most of its processing time. These graphs are based on sampled information collected by a profiler while the observed software is running. At regular intervals, the profiler captures and stores the current call stack. A flame graph is then generated from this data to provide a visual representation of the functions in which the software spends most of its processing time. This is useful for understanding the characteristics of a program and for improving its performance. This blog post explores the fundamentals of flame graphs and offers a few practical tips on utilizing them to identify and debug performance bottlenecks in PostgreSQL.
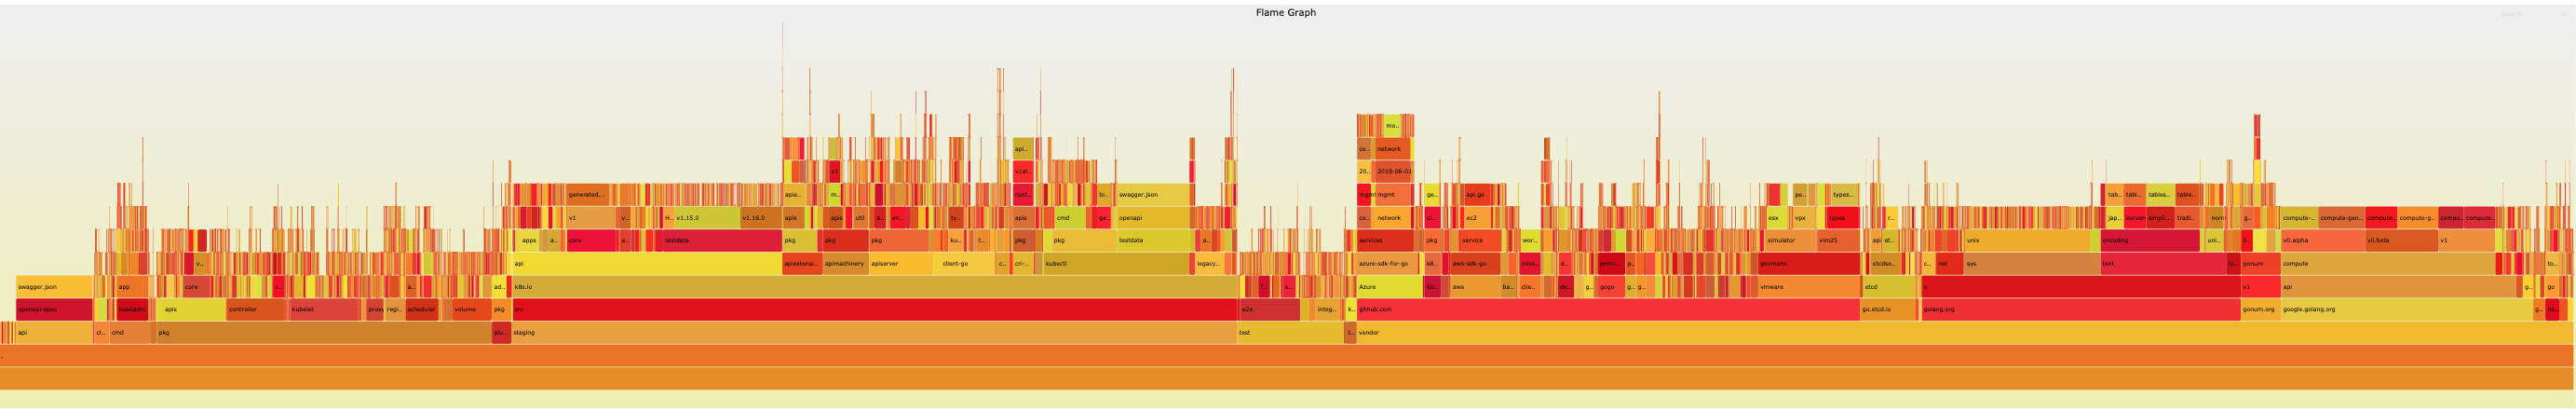
Analyze Kubernetes codebase using cloc and FlameGraph

While hacking at Subterranean (some not-a-game blocky cave game thing), I was experiencing weird groups of stutters happening about once per second that I was having trouble figuring out the cause of.

ramblings by Adam Perry

Linux performance profiling with perf and Docker
Профилирование - это первое, что должно приходить в голову, когда у нас встаёт вопрос производительности приложения. Если грамотно провести профилирование приложения, то суть проблем произвдительности становится намного понятнее, и фиксы можно создавать уже более осмысленно.
Source code: Lib/profiling/sampling/ Tachyon logo The profiling.sampling module, named Tachyon, provides statistical profiling of Python programs through periodic stack sampling. Tachyon can run sc...
How Linux kernel, systems and embedded developers can use Perfetto for debugging performance issues.
Examples of using the Linux perf command, aka perf_events, for performance analysis and debugging. perf is a profiler and tracer.
Homepage for Flame Graphs: a visualization for stack traces.

In this deep-dive, we identified and worked through sporadic latency issues with services running on Kubernetes in our environment.
Linux load averages explained, including why they include the uninterruptible I/O sleep state.

We introduce a new C++ function tracing profiler, and discuss how to use such a profiler, how to make one for native code, and how a simple CPU hardware feature can make tracing very cheap for compiled, interpreted and JITted languages