pprof/doc/README.md at main · google/pprof
pprof is a tool for visualization and analysis of profiling data - google/pprof
pprof is a tool for visualization and analysis of profiling data - google/pprof

At Wikipedia, we built an efficient sampling profiler for PHP, and use it to instrument live requests. The trace logs and flame graphs are powered by a simple setup that involves only free open-source software, and runs at low infrastructure cost. I'd like to demonstrate that profiling doesn't have
clj-async-profiler is an embedded high-precision performance profiler for Clojure. clj-async-profiler presents the profiling results as an interactive flamegraph. You can navigate the flamegraph, q...
Flame Graphs # Flame Graphs are a visualization that effectively surfaces answers to questions like: Which methods are currently consuming CPU resources? How does consumption by one method compare to the others? Which series of calls on the stack led to executing a particular method? Flame Graph Flame Graphs are constructed by sampling stack traces a number of times. Each method call is presented by a bar, where the length of the bar is proportional to the number of times it is present in the samples.

Measure Rust web application performance with this introductory tutorial and guide to several handy profiling tools.
Profiling Cheatsheet
A Rust port of FlameGraph. Contribute to jonhoo/inferno development by creating an account on GitHub.
How I used Advent of Code to learn about the programming language Rust.

The new sparse index feature makes it feel like you are working in a small repository when working in a focused portion of a monorepo.
Sadly, the time since the last post on this blog hasn't been fruitful with regards to the profiling project.

The last finishing touches before our plugin system reaches production.
🔥 Pyflame: A Ptracing Profiler For Python. This project is deprecated and not maintained. - uber-archive/pyflame

I have discussed the importance of tracing before — how it is an indispensable tool for in-depth analysis of userspace and

Graphs, Graphs, and nothing but the Graphs

Stack trace visualizer. Contribute to brendangregg/FlameGraph development by creating an account on GitHub.
How Indeed investigated and addressed high system load after Java 8 migration of its job search web app

Blog on Java, Performance, Concurrency, NIO, Unsafe, Low latency, Programming, Software, Philosophy
In a previous post, I’ve shown how to use the rayon framework in Rust to automatically parallelize a loop computation across multiple CPU cores.Disappointing...
This post is the second of a series on testing Rust’s support of SIMD instructions on ARM with Android.In the first post, we’ve seen how to compile Rust libr...
Here we dig into pyroscope to understand how eBPF can fetch perf events and build indicators of how the application is behaving, providing a nice backend for flamegraphs.
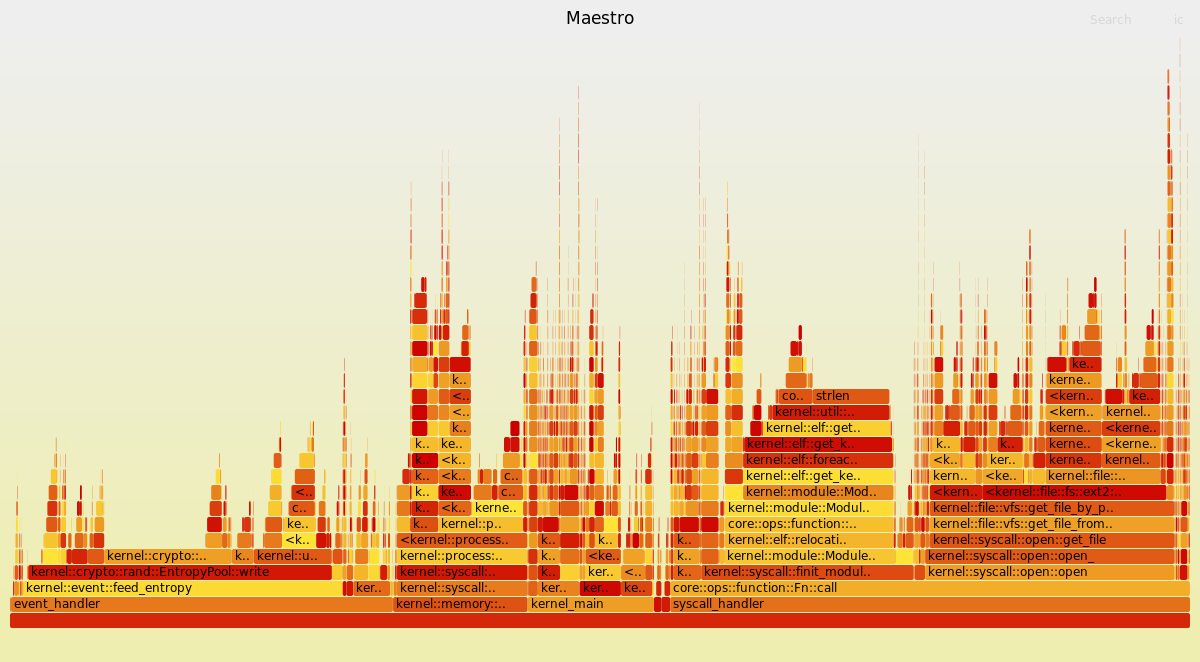
Now that we have discussed building the core language and desired runtimes, it is time to highlight one of the biggest reasons why I decided to rewrite the interpreter in a lower-level systems language - performance! In this post, I will document how I went about benchmarking the two implementations (TypeScript/Node and Rust), greatly improving performance and highlighting interesting findings along the way.
With the core language library now written, I could go about building the desired (delivery) runtimes. In this post within the series, I will delve into my experience integrating the core language library with these chosen runtimes, documenting some of the challenges that I faced along the way.
Blog on Java, Performance, Concurrency, NIO, Unsafe, Low latency, Programming, Software, Philosophy
Astro description

A C++ implementation of the Leiden algorithm

Learn how to bring your Ruby test suite back to full health, and full speed, with TestProf—a powerful bag of tools to diagnose all test-related problems. Chapter II: Factories.
Visualisation of the kernel's booting sequence using a Flamegraph
Difftastic is a structural diff that understands syntax. The diff results it generates are very fancy, but its performance is poor, and it consumes a lot of memory. Recently, I boosted it by 4x while using only 23% of memory (#393, #395, #401). This post explains how I accomplished this. Hope it can bring you some inspiration. When I started to write this post, not all optimizations were reviewed and merged.

Update: I wrote a follow-up article about adding Loop Counters and Row Counts to SQL Plan FlameGraphs. I also show some old examples of “Bookshelf Graph” visualizations there. Check it out after reading this post first. Introduction Brendan Gregg invented and popularized a way to profile & visualize program response time by sampling stack traces and using his FlameGraph concept & tools. This technique is a great way for visualizing metrics in nested hierarchies, what stack-based program execution uses under the hood for invoking and tracking function calls. If you don’t know what FlameGraphs are, I suggest you read Brendan’s explanation first. - Linux, Oracle, SQL performance tuning and troubleshooting training & writing.
A Rust video by Andy Balaam inspires me to look into benchmarking with Divan

The operating system on a single machine.
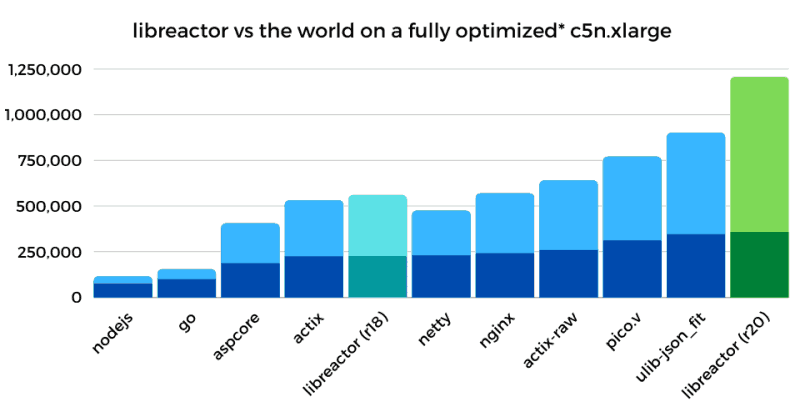
This post will walk you through the performance tuning steps that I took to serve 1.2 million JSON 'API' requests per second from a 4 vCPU AWS EC2 instance.
Blog on Java, Performance, Concurrency, NIO, Unsafe, Low latency, Programming, Software, Philosophy
I remember early in my career someone joking that:

A couple of weeks ago I wrote a blog posting here about Fedora having frame pointers (LWN backgrounder, HN thread). I made some mistakes in that blog posting and retracted it, but I wasn’t wr…
A personal website of Shuhei Kagawa. I write mostly on web technologies and life.
The Go programming language comes with tools for writing and running tests: the standard librar [...]
In this post, I’ll show how to profile a Rust web application.
In this post we will show you how to profile your Elixir application with perf and visualise its stack trace with Flamegraphs. We’ll create a basic Phoenix web server with two endpoints which we will call in order to profile and analyse its performance.
Overhead demons can be hiding in plain sight in pretty flame graphs.
Bad Diode's exobrain

Infrequently published reports from the world of front-end development with a focus on accessibility, web performance, CSS and 11ty.

Lots of libraries advertise how performant they are, and if performance is the main selling point then I expect several criteria to be met to ensure the integrity of the project is intact. While Rust examples are the focus, many of tips can be applied across any language.

Adding 1000 requests per second to a query by using perf and flame graphs.
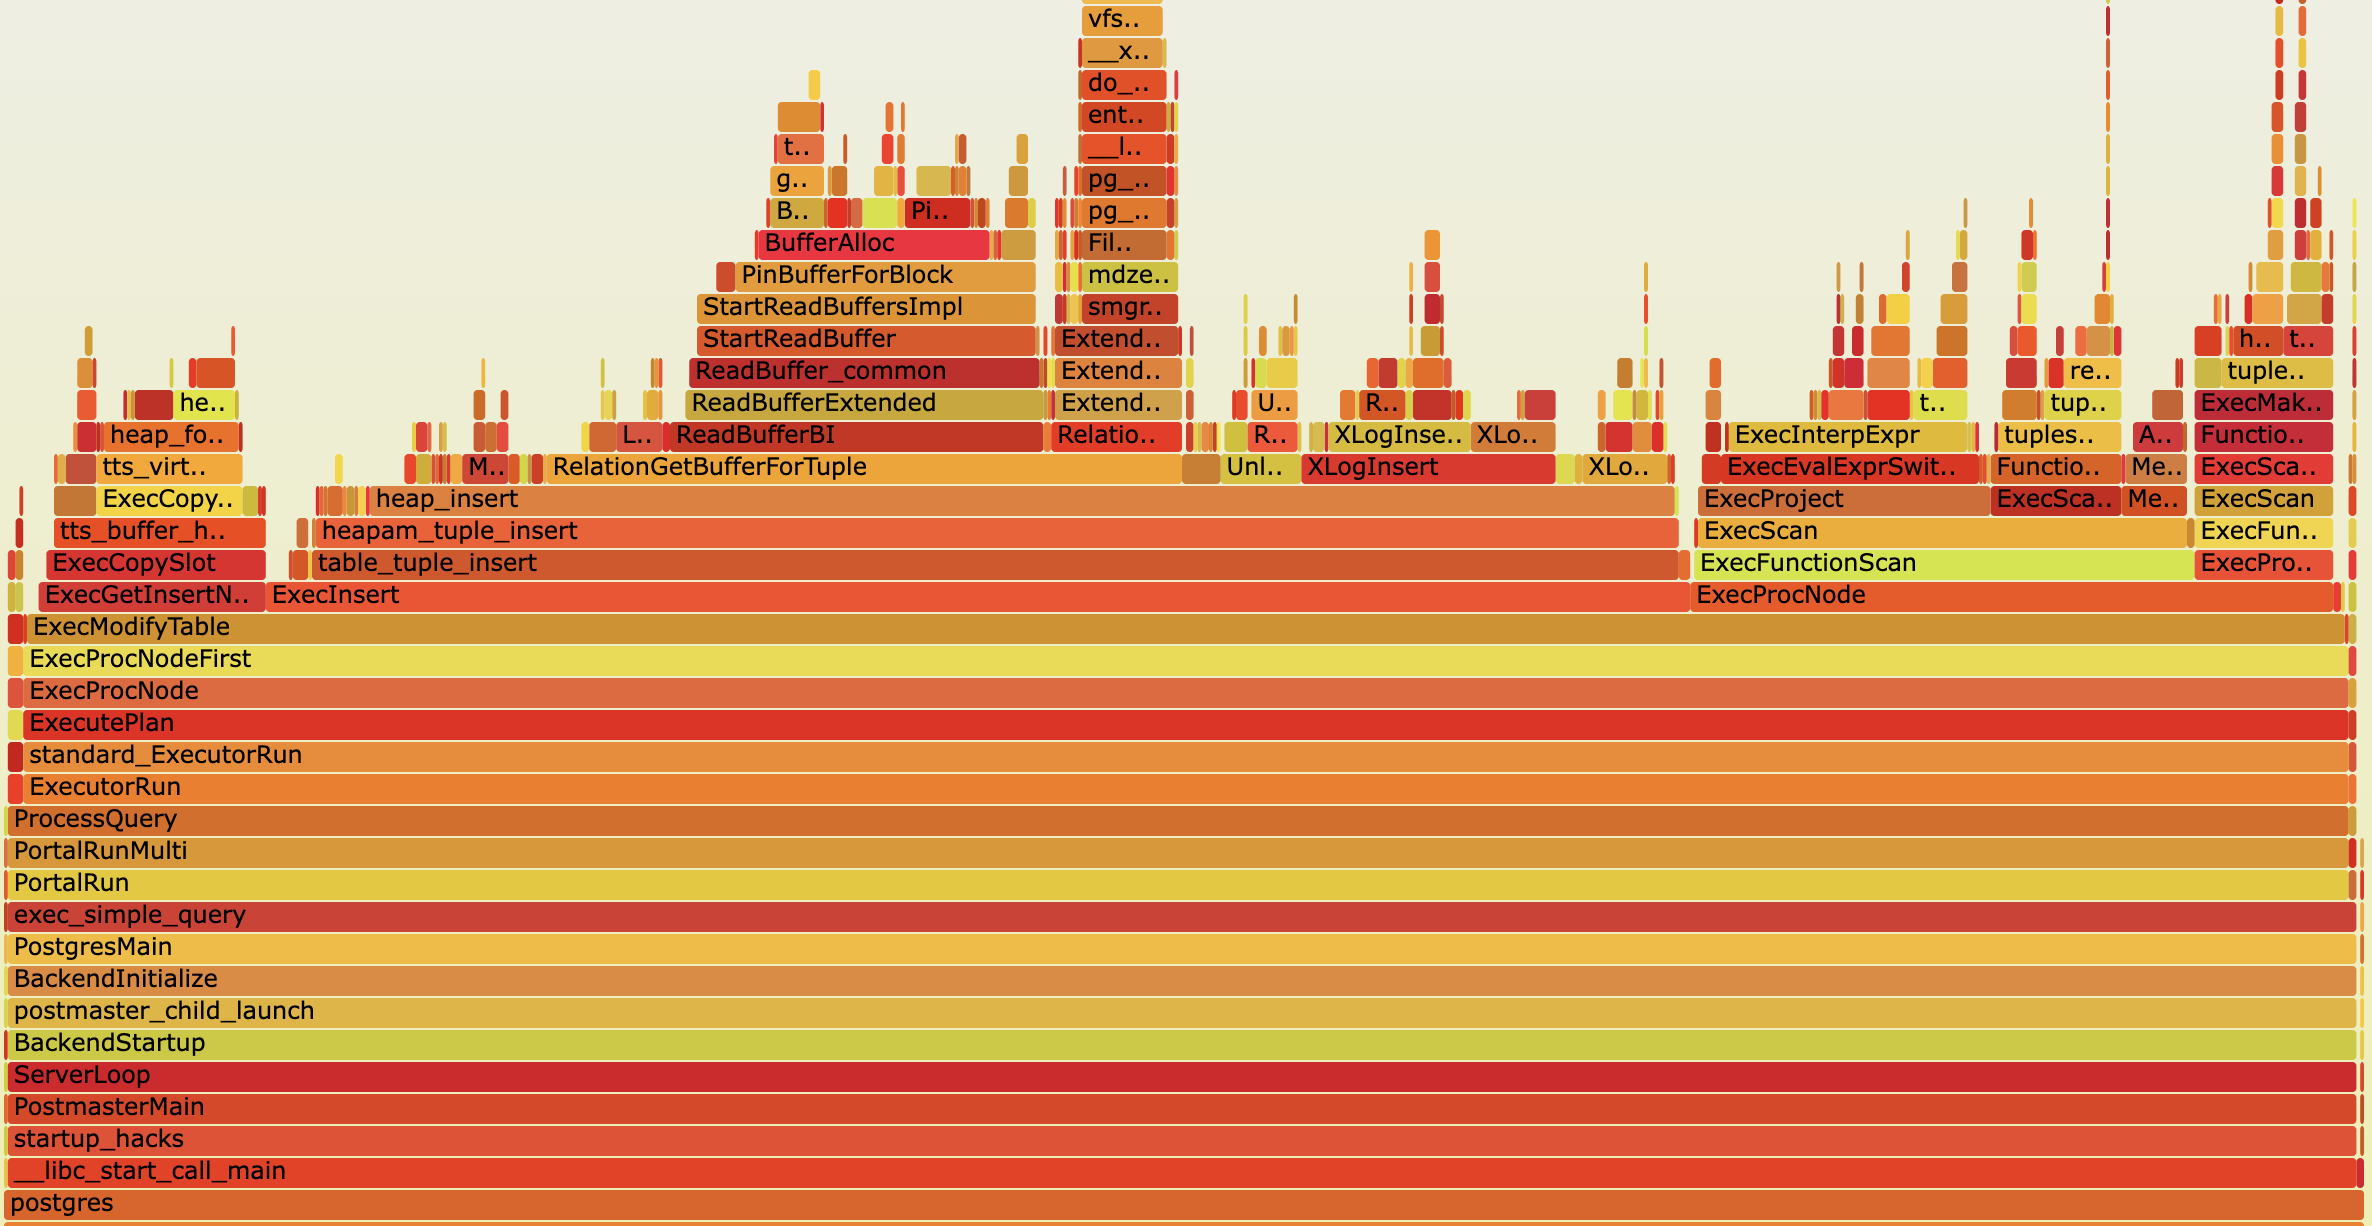
A flame graph is a graphical representation that helps to quickly understand where a program spends most of its processing time. These graphs are based on sampled information collected by a profiler while the observed software is running. At regular intervals, the profiler captures and stores the current call stack. A flame graph is then generated from this data to provide a visual representation of the functions in which the software spends most of its processing time. This is useful for understanding the characteristics of a program and for improving its performance. This blog post explores the fundamentals of flame graphs and offers a few practical tips on utilizing them to identify and debug performance bottlenecks in PostgreSQL.
When I was in grad school and struggling with my Master’s thesis, I started a small side project in order to distract myself and work on something that felt more rewarding. This project was basically a clone of vim – a terminal-based text editor I called badavi. That was around seven years ago. I haven’t worked on it continuously since then, but I would occasionally go back and hack on it in short little bursts. In particular I’ve been doing this the last couple of months, and I thought it might be interesting to write about some of the things I’ve been up to. For this post, we’ll look at some small performance fixes I made recently, guided by perf and flame graphs.
What do you do when you want to extract data that you know is in a file somewhere, but there are no APIs to extract it?
<p>At work, I lead a team responsible for a Node.js service that serves a lot of GraphQL queries. We recently noticed some servers in the cluster were running much slower than others. We had used <a href="https://github.com/davidmarkclements/0x">0x</a> in the past to profile Node.js services locally. In this case, we could not identify the problem locally and needed a solution to profile Node.js in production to identify the cause of the slowdown.</p>
Debugging programs is hard

While hacking at Subterranean (some not-a-game blocky cave game thing), I was experiencing weird groups of stutters happening about once per second that I was having trouble figuring out the cause of.
Using flame graphs to remove a hot path, stop copying data and switching to a fast CRC32
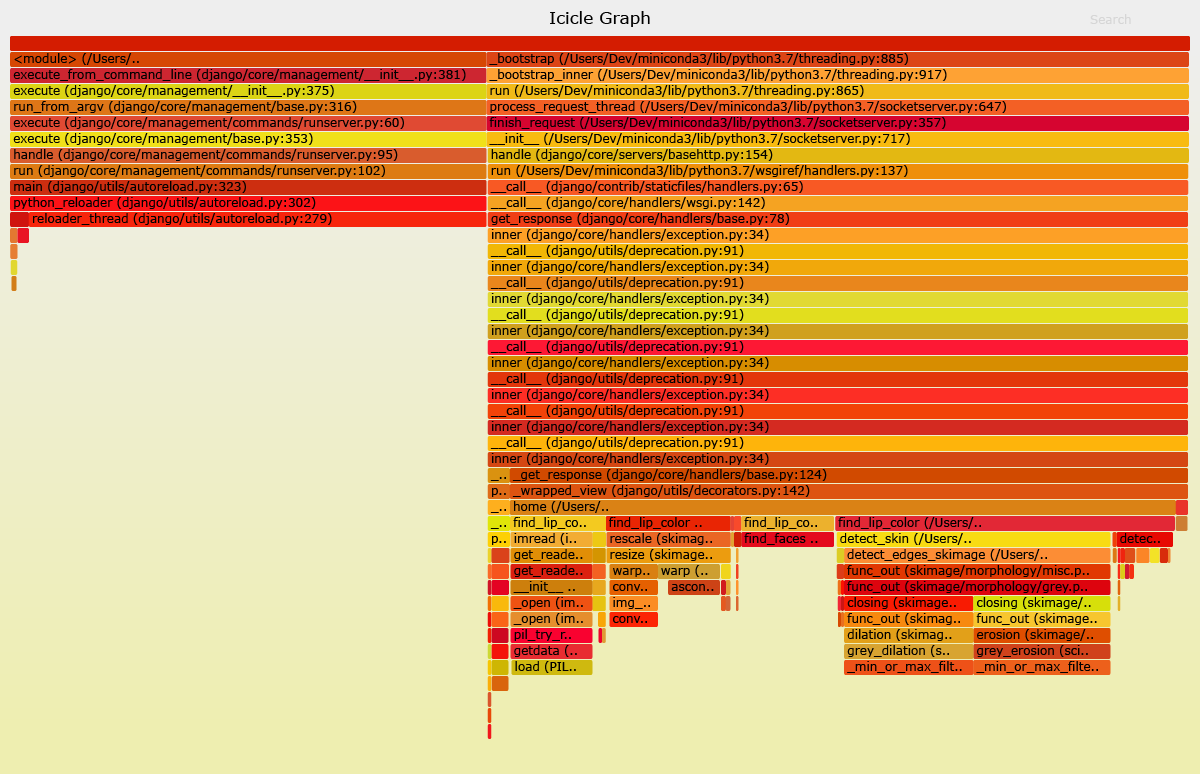
I’ve been working to improve the turnaround time for Lip Colour Finder results. In order to find the areas of my code most amenable to tweaking I turned to profiling.

Linux performance profiling with perf and Docker

I’ve recently come back to an older project of mine (that powers this website), and as I did some maintenance work: upgrade to newer crates, upgrade to a newer rustc, I noticed that my build was ta...
Curated collection of books, papers, and articles for learning distributed systems and performance engineering
Java Flight Recorder plugin for Gradle. Contribute to lhotari/jfr-gradle-plugin development by creating an account on GitHub.
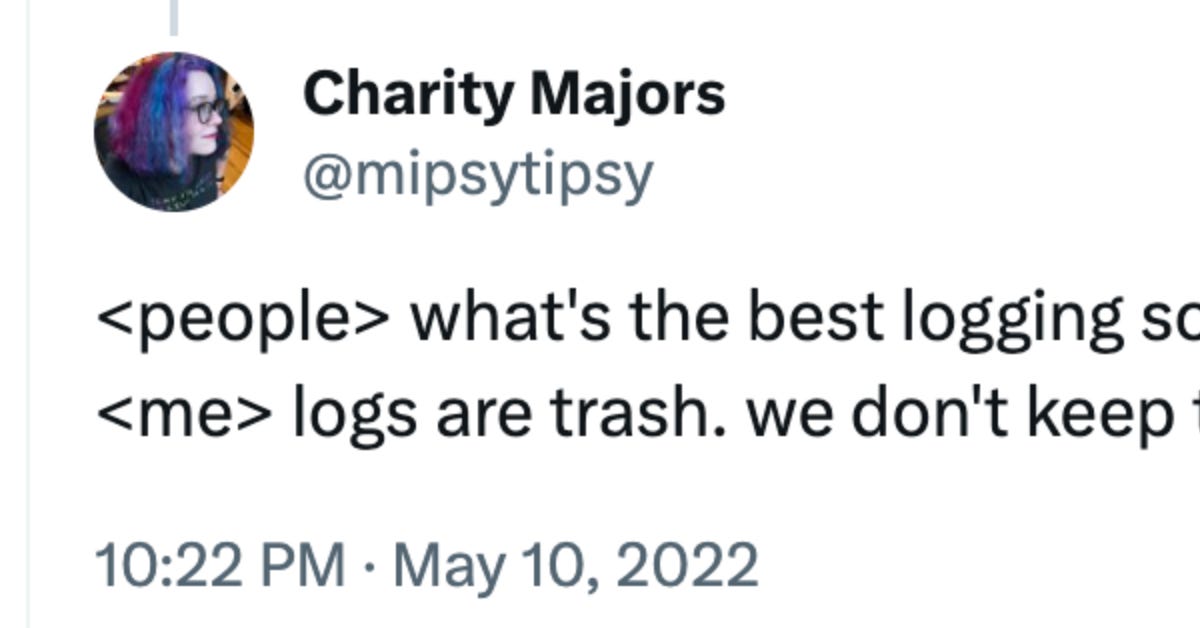
This quote from Charity Majors is probably the best summary of the current state of observability in the tech industry - a total, mass confusion.
Stack trace visualizer. Contribute to brendangregg/FlameGraph development by creating an account on GitHub.
Sampling profiler for Python programs. Contribute to benfred/py-spy development by creating an account on GitHub.
A D3.js plugin that produces flame graphs from hierarchical data. - spiermar/d3-flame-graph