GitHub - benfred/py-spy: Sampling profiler for Python programs
github.comSampling profiler for Python programs. Contribute to benfred/py-spy development by creating an account on GitHub.
How does the Go CPU profiler works under the hood?

Tools I use to find why my Python code is slow.
Different python profiling tools use different methodologies for gathering performance data and hence have different runtime overhead. Before choosing a profiler tool it is helpful to understand two commonly employed techniques for collecting performance data : Deterministic profiling Deterministic profilers execute trace functions at various points of interest (e.g. function call, function return) and record […]
If you are working in the area of scientific computing, in academia or industry, most likely you are using Python in some form. Traditionally Python is described as slow when it comes to performance and there are number of discussions about speed compared to native C/C++ applications 1 2. The goal of this post is […]

In a 2019 talk/rant titled “Everyone Watching This Is Fired”, games industry veteran Mike Acton rattled off a sample of 50 things he expects of developers he works with. The title refers to his tongue-in-cheek suggestion that anyone who doesn’t meet all these requirements would be immediately fired.
A curated list of awesome things related to Django. Maintained by William Vincent and Jeff Triplett
In my previous post, I shared how to profile a single function using line_profiler. In this post, I want to share how to profile Python script/module and visualize the profile stat to pinpoint the slow part of the code.
I’m taking a year off work in what I’m calling the Dog Park Sabbatical, and here are summaries of what happened each month. Prior to work ending: Serving a long notice, and Leonid Space…

I mapped out over 100 Profilers, what Profile Data Formats they output, and what Profiler UIs can visualise those formats: Profilerpedia
Today, I was debugging a hanging task in Azure Batch. This short post records how I used py-spy to investigate the problem. Background Azure Batch is a compute service that we use to run container workloads. In this case, we start up a container that processes a bunch of GOES-GLM data to create STAC items for the Planetary Computer . The workflow is essentially a big for url in urls: local_file = download_url(url) stac.create_item(local_file) We noticed that some Azure Batch tasks were hanging. Based on our logs, we knew it was somewhere in that for loop, but couldn’t determine exactly where things were hanging. The goes-glm stactools package we used does read a NetCDF file, and my experience with Dask biased me towards thinking the netcdf library (or the HDF5 reader it uses) was hanging. But I wanted to confirm that before trying to implement a fix.
Update: I gave a talk on this topic at P99 CONF 2023 and at PyCon IL 2024 (Hebrew). A while ago at $work, we had a performance issue with one of our core Python …
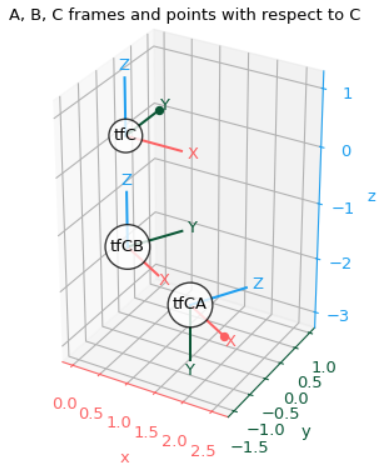
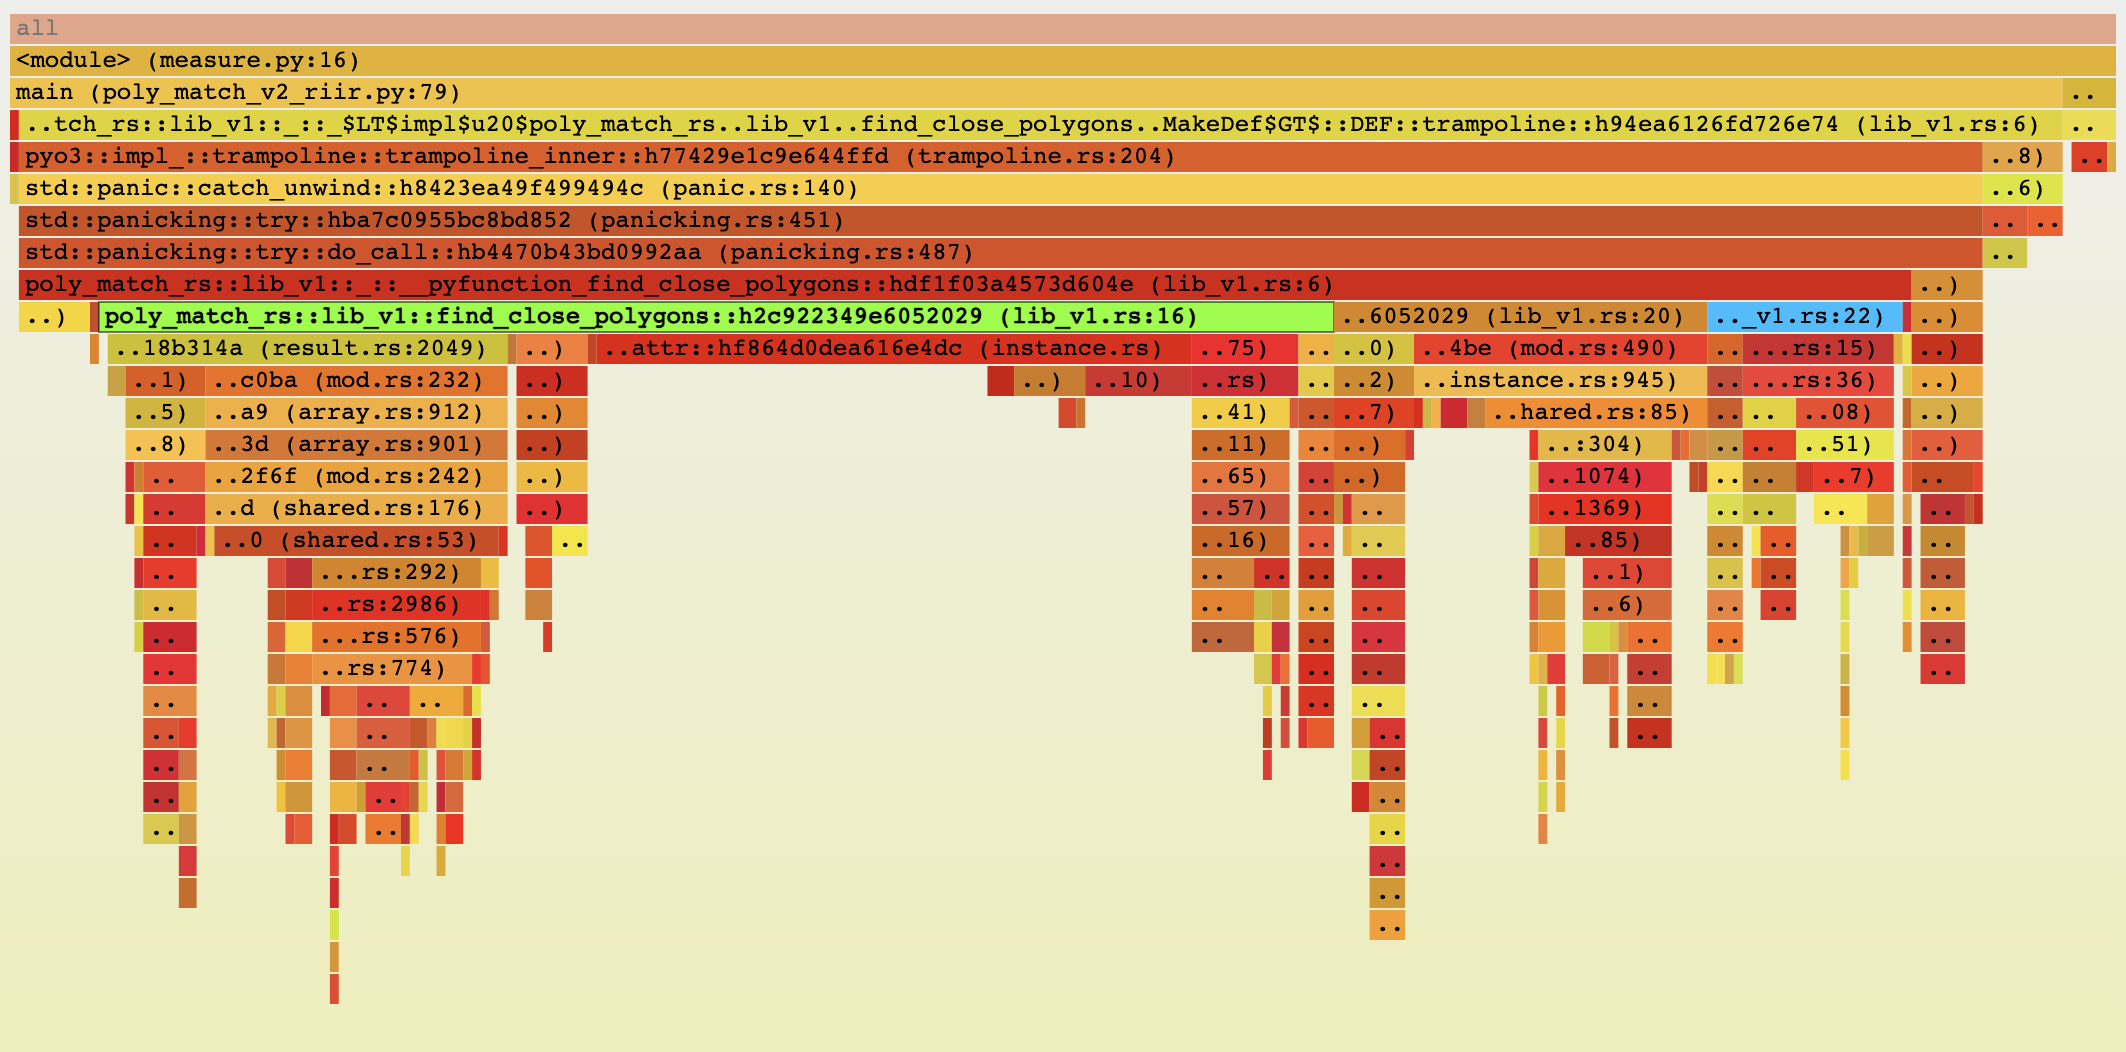
As part of my PhD I do computational modeling of quantum-biological systems. One of my simulations was misbehaving and in certain cases could take 8 hours to complete. That's really bad when you're trying to iterate quickly. This post describes how I made a series of optimizations to reduce the runtime by 250x via profiler driven algorithmic improvements, rewriting the core in Rust, and making use of parallelism.

And How We Eventually Made It 4 Times Faster

Plutôt qu’empiler les noyaux, faites confiance au noyau de l’hôte et simplifier vos VMs en fusionnant votre application dans un noyau minimaliste.
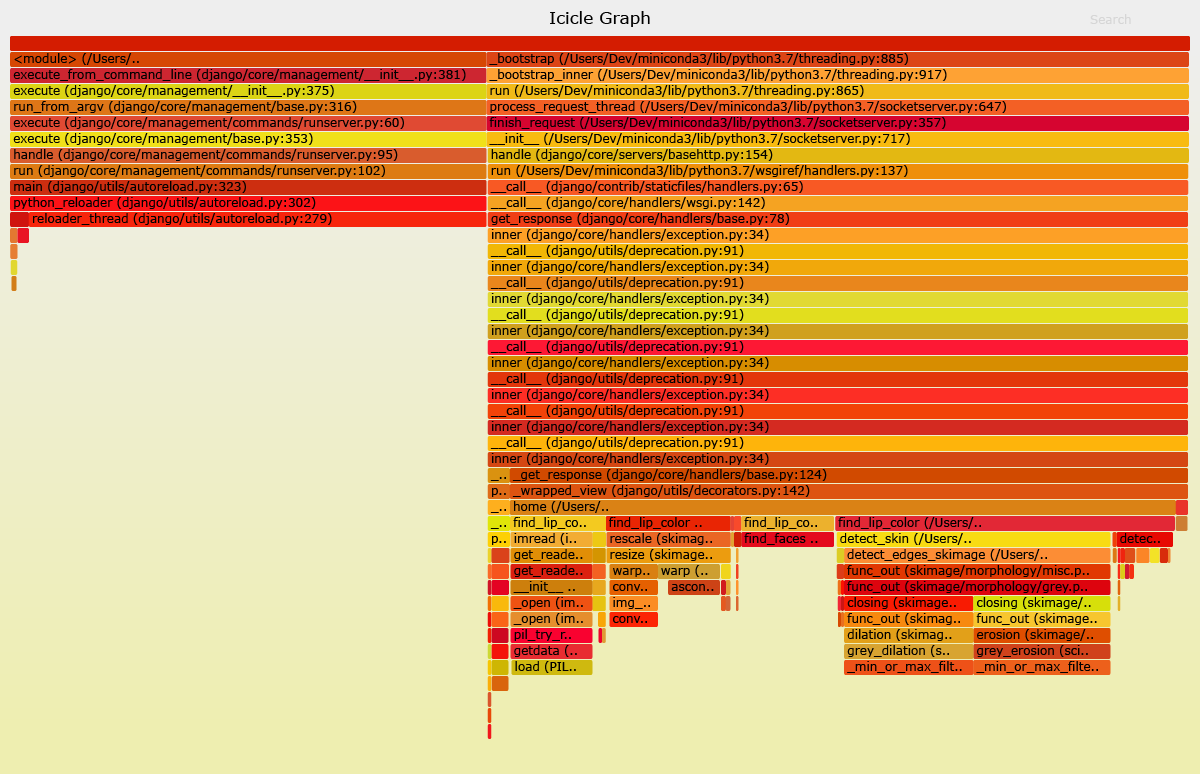
I’ve been working to improve the turnaround time for Lip Colour Finder results. In order to find the areas of my code most amenable to tweaking I turned to profiling.

I’ve made another package! Like icu4py, which I made in February, it was sponsored by my client Rippling. And like tprof, which I made in January, it’s a profiling tool!

NVIDIA GB200 NVL72, AMD MI355X, Throughput Token per GPU, Latency Tok/s/user, Perf per Dollar, Tokens per Provisioned Megawatt, DeepSeek R1 670B, GPTOSS 120B, Llama3 70B
There are certain bugs and issues that are very hard to troubleshoot. Just ask yourself, "How would I debug deadlock, segmentation fault, crashing a...

Exploring the concurrency, debugging, and performance upgrades that make Python 3.14 special.