Linux perf Examples
brendangregg.comExamples of using the Linux perf command, aka perf_events, for performance analysis and debugging. perf is a profiler and tracer.

At Wikipedia, we built an efficient sampling profiler for PHP, and use it to instrument live requests. The trace logs and flame graphs are powered by a simple setup that involves only free open-source software, and runs at low infrastructure cost. I'd like to demonstrate that profiling doesn't have
For Parallel Applications
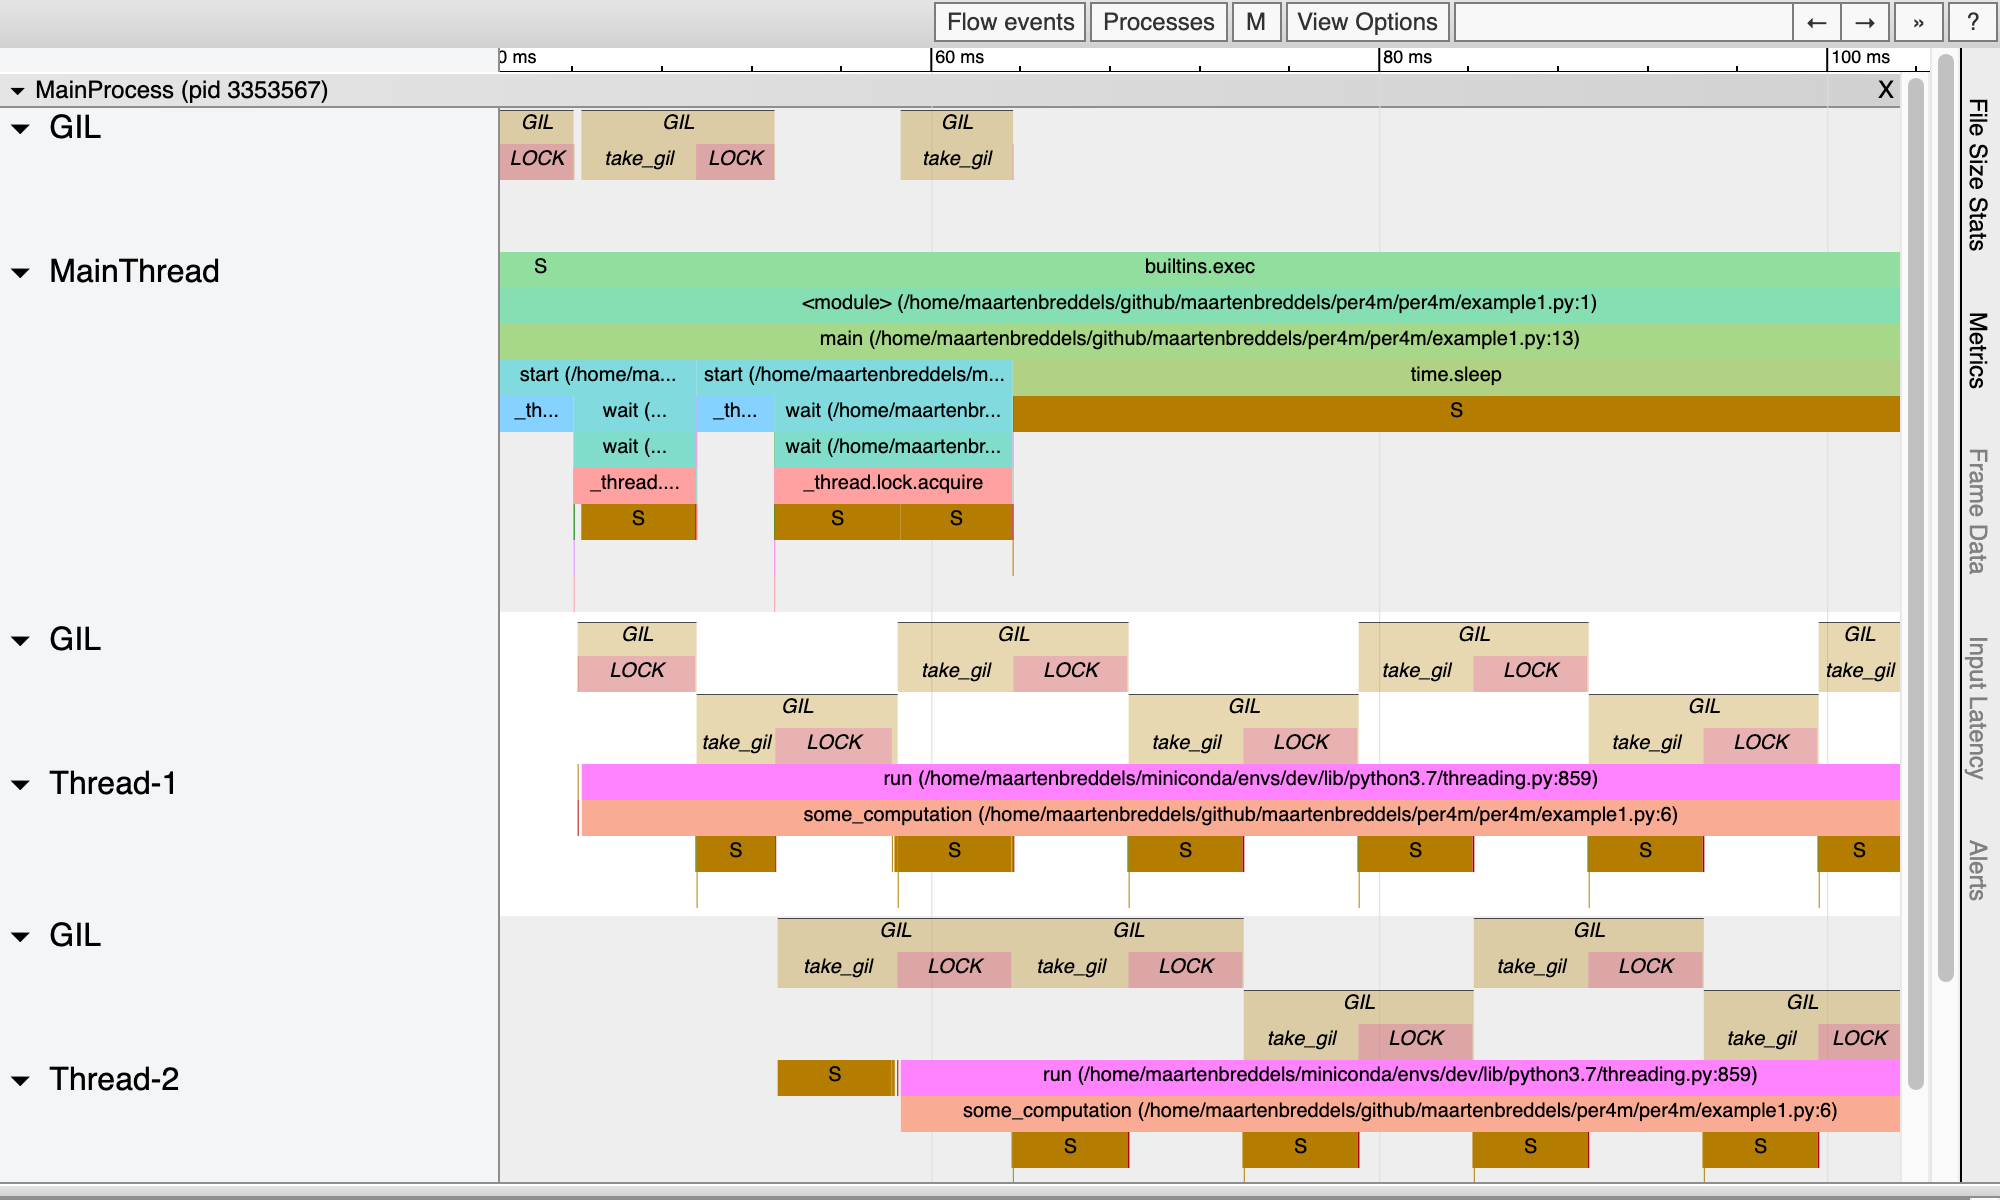
Tracing and visualizing the Python GIL with perf and VizTracer
Tools like strace , perf , gdb are part of the usual debugging toolbox on Linux. These are used to inspect behaviour of newly launched…
ramblings by Adam Perry

There's an incredible built-in mechanism in Windows called Performance Counters that allows you to follow a whole lot of useful metrics. It's easy to use, comes free, and perhaps not used as much as it deserves. In this article, we'll see how to monitor performance counters with PerfMon, ...

Performance issues never seem to disappear from the world, no matter how fast new computers become. To deal with those issues we need proper tools. We have some great tools on Windows. On .NET Core with Linux, things are not so great. But they're getting better.

Graphs, Graphs, and nothing but the Graphs
Understand how much power you are using
This summer, while working on my internship project, I realised that an internal CLI tool was taking too long to run. The tool purpose is not very relevant h...
In a previous post, I’ve shown how to use the rayon framework in Rust to automatically parallelize a loop computation across multiple CPU cores.Disappointing...
Optimizing a breadth first search
Performance analysis tools based on Linux perf_events (aka perf) and ftrace - brendangregg/perf-tools

After spending some weeks playing with Rust, I felt ready to test my skills and try some programming challenges in the [Advent Of Code](https://adventofcode.com/). My approach to tackle some of those challenges was to solve them using Javascript (I use it in my day to day) first and then port the code to Rust. While writing the port I just focus on getting the Rust code as elegant as possible to achieve that I research the Rust API's to get syntactically correct. It was after finishing porting this [puzzle](https://adventofcode.com/2018/day/5) in particular and feeling a sense of accomplishment that I decided to test how the Rust compiled code will perform against Javascript interpreter.

I mapped out over 100 Profilers, what Profile Data Formats they output, and what Profiler UIs can visualise those formats: Profilerpedia

How profilers and debuggers translate machine addresses to human-readable symbolic names
Blog post summarising how to measure specific code sections of applications with Linux perf
ramblings by Adam Perry
Bitcoin Core integration/staging tree. Contribute to bitcoin/bitcoin development by creating an account on GitHub.
profile a bash script by efficiently logging time deltas for each statement

Adding 1000 requests per second to a query by using perf and flame graphs.
Analyzing performance can be challenging, especially when diagnosing regressions. Finding the right methods to investigate performance issues is often time-consuming and complex. You may have heard of perf, a powerful Linux tool for performance measurement, available from the kernel. This post will guide you through using perf to analyze performance on Linux, serving as a practical “quick start” guide for those new to profiling Java applications with perf. It’s not meant to be a comprehensive tutorial, as many of those already exist in the extensive documentation of perf and other excellent sources. However, the examples provided may be all you need or, at the very least, give you an idea of where to look for deeper insights.
Introduction Recently I’ve been working on a lock-free message queue implemented using shared memory. Some of the criteria I’ve set for it are that the queue…
A guide to the adventurer. Contribute to joaocarvalhoopen/How_to_learn_modern_Rust development by creating an account on GitHub.

Vaibhav Shankar; Staff Software Engineer | Raymond Lee; Staff Software Engineer | Chia-Wei Chen; Staff Software Engineer | Shunyao Li; Sr…
Vaibhav Shankar; Staff Software Engineer | Raymond Lee; Staff Software Engineer | Chia-Wei Chen; Staff Software Engineer | Shunyao Li; Sr…