We’d like to get feedback on the status of the profiling tools landscape in Node.js today. In particular -- we want to get alignment on a roadmap which will provide a free, open source, and cross-p...
NixOS uses virtual machines based on QEMU extensively for running its test suite. In order to avoid generating a disk image for every test, the test driver usually boots using a Plan 9 File Protocol (9p) share (server implemented by QEMU) for the Nix store, which contains all the programs...
Analyzing performance can be challenging, especially when diagnosing regressions. Finding the right methods to investigate performance issues is often time-consuming and complex. You may have heard of perf, a powerful Linux tool for performance measurement, available from the kernel. This post will guide you through using perf to analyze performance on Linux, serving as a practical “quick start” guide for those new to profiling Java applications with perf. It’s not meant to be a comprehensive tutorial, as many of those already exist in the extensive documentation of perf and other excellent sources. However, the examples provided may be all you need or, at the very least, give you an idea of where to look for deeper insights.
Investigating memory leaks is not a typical use case for allocation profiling. Still, combined with other tools, the profiler can point us in the right direction
Shopify Liquid debug has never been easier than with the Shopify Theme Inspector for Chrome. Pinpoint specific lines of problematic code to make your clients’ stores faster and more performative.
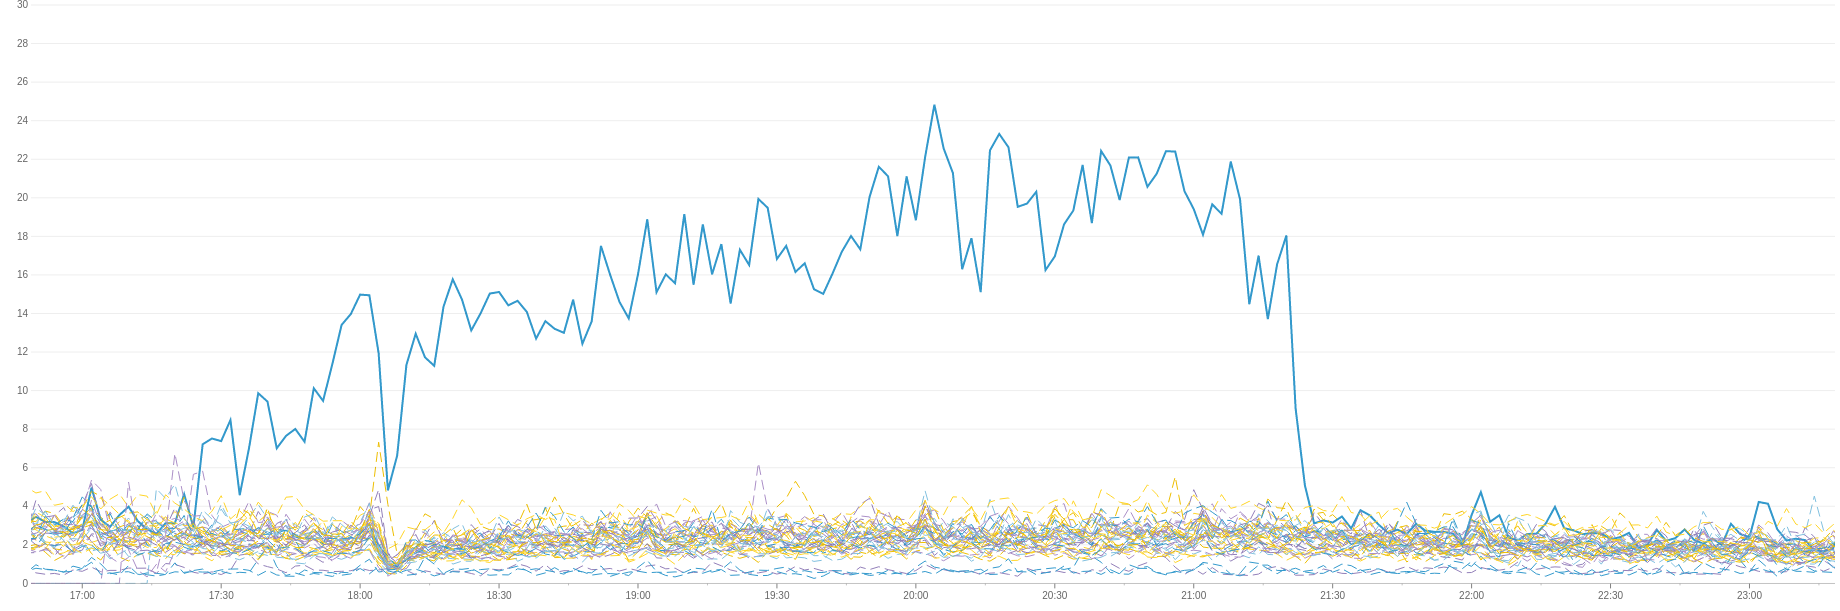
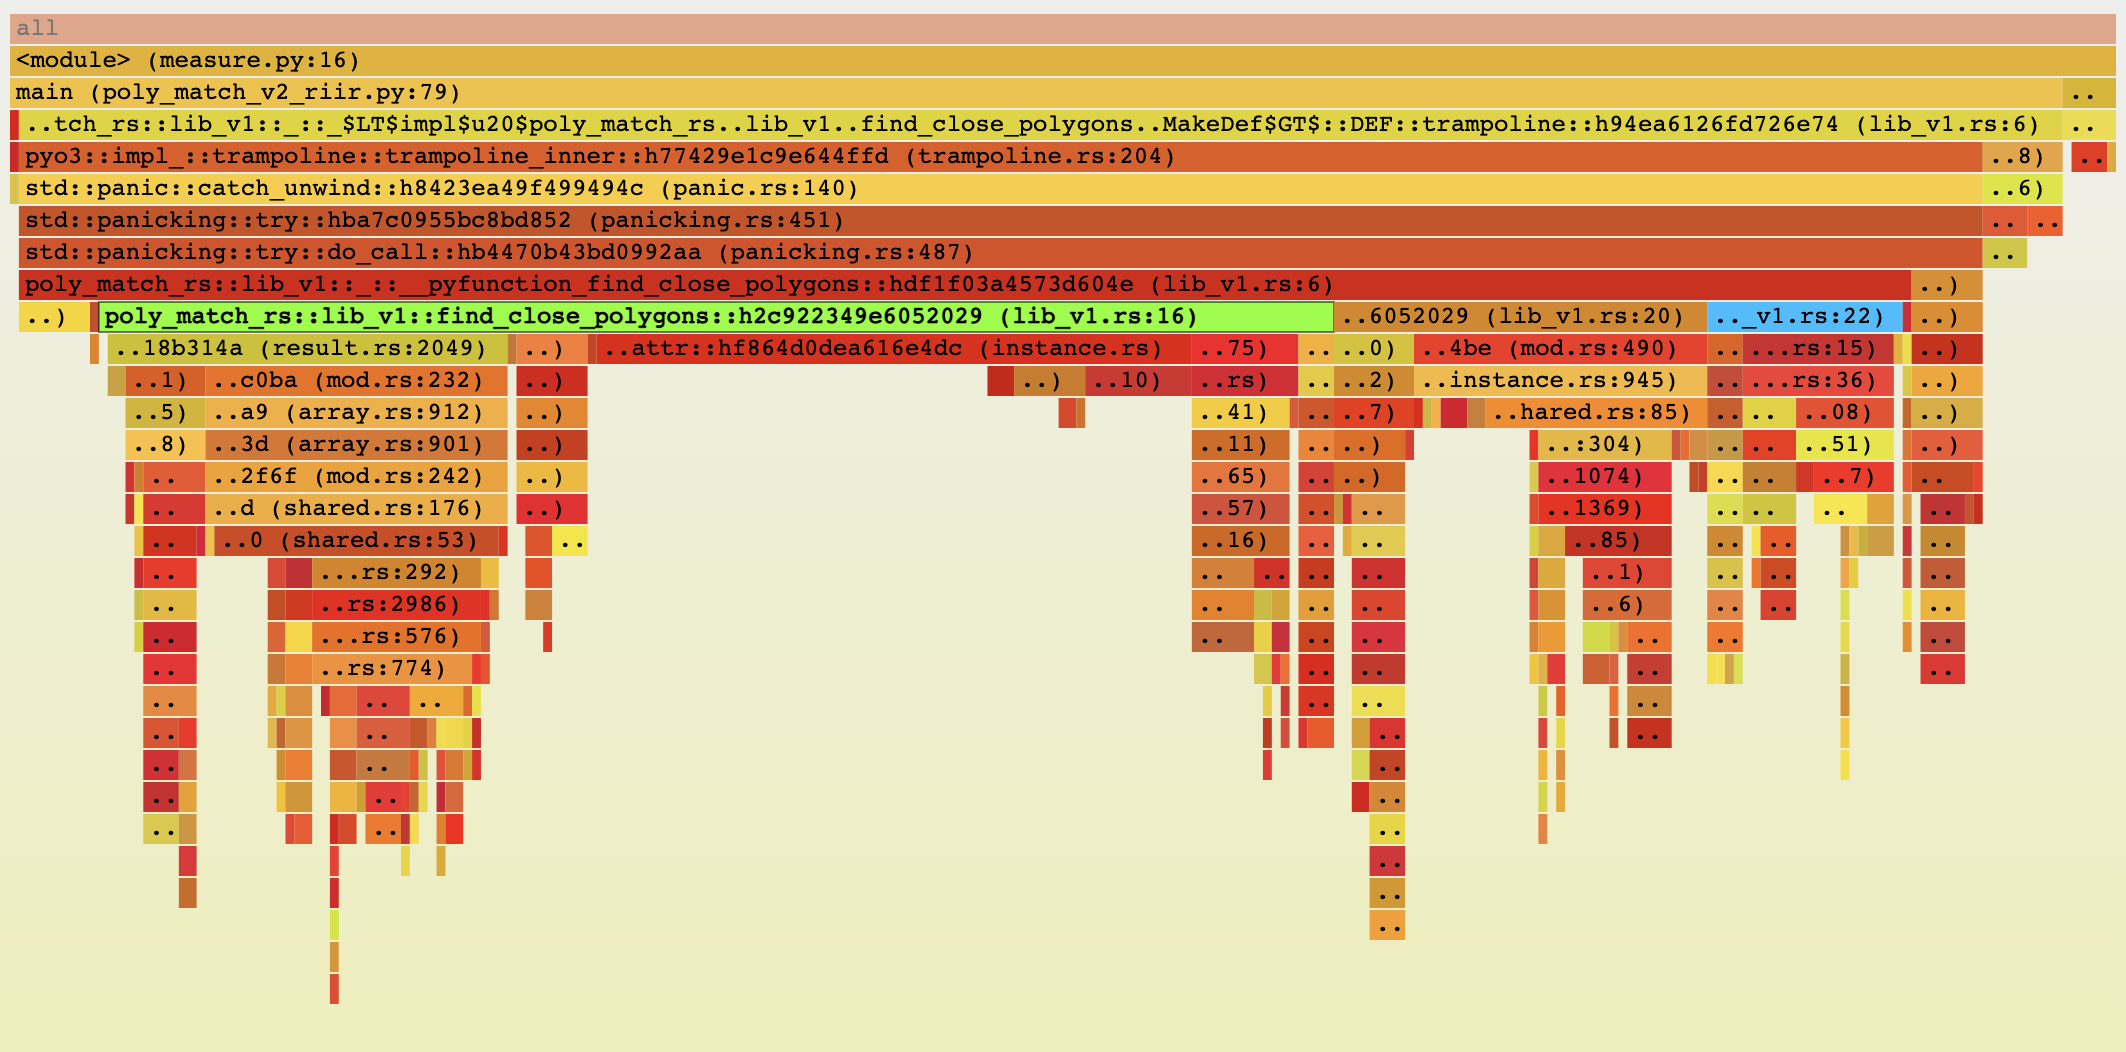
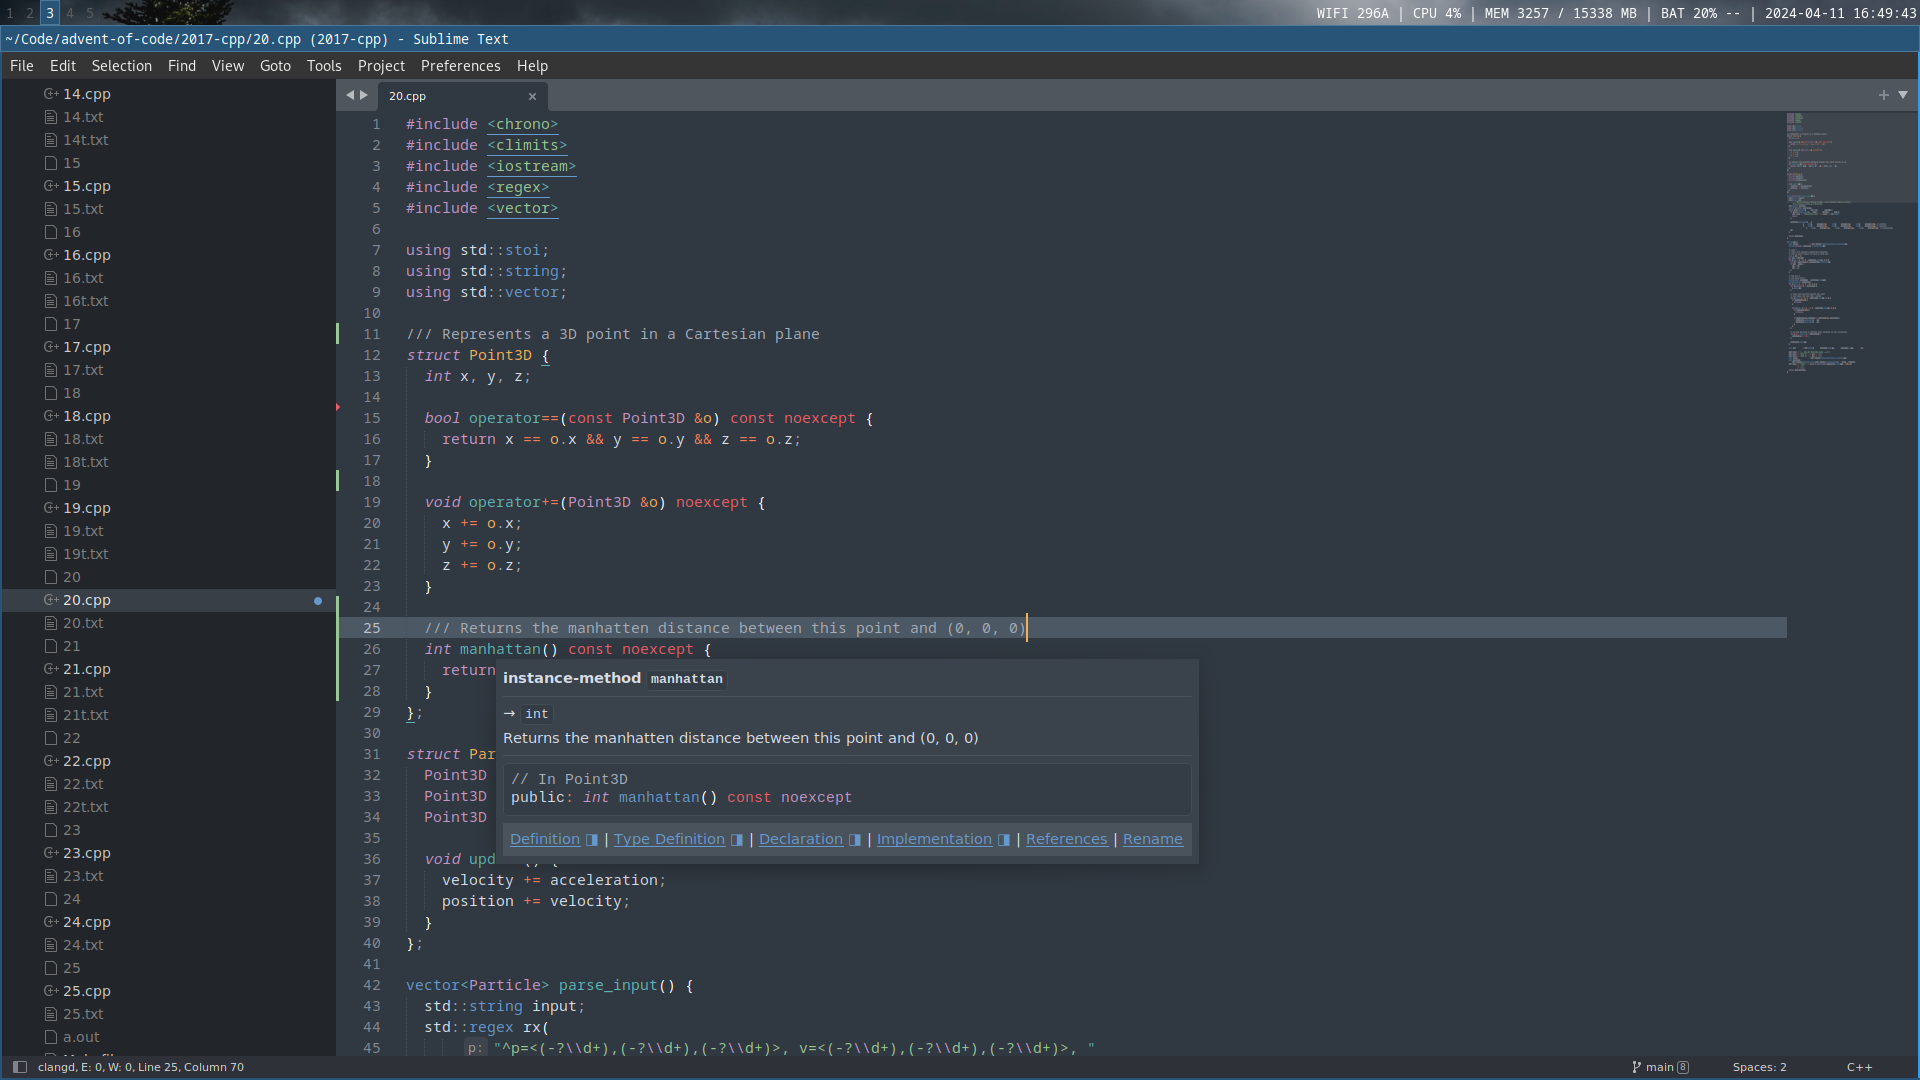
Update: I gave a talk on this topic at P99 CONF 2023 and at PyCon IL 2024 (Hebrew). A while ago at $work, we had a performance issue with one of our core Python …
This is an in-depth post on bugs and how to prevent them in AI software and AI compilers specifically. I was the software lead for TPUv3 at Google and I’ve worked on a variety of AI compilers and projects across Google, Nvidia, Amazon and Facebook.
I’ve been on a bender for the past few weeks. I haven’t been able to stop reading and watching content about TigerBeetle. I was especially enamored by videos...
A customer reported an unusual problem with our CloudFlare CDN: our servers were responding to some HTTP requests slowly. Extremely slowly. 30 seconds slowly.