Show full content
![]()
The most recent release of Deno last week included a feature that I think is very exciting: it built support for Open Telemetry directly into the runtime.
Deno’s an incredible platform, but the lack of observability support has made it a non-starter for anything serious in production. While logging is obviously built in, and you could use an existing metrics library like prometheus with npm specifiers for custom metrics, existing tracing libraries are highly coupled to Node due to differences in the way things like promises are handled by the runtime. Even Open Telemetry only supports Node and the browser. There’s been an issue tacking Deno support open for almost 4 years now, but it’s been slow to progress. This isn’t unreasonable - Node has orders of magnitude more users than Deno.
Open Telemetry makes a lot of sense for Deno - mostly because it’s the new-ish kid on the block, and there’s not much incentive for every vendor to put energy into supporting it. But if there’s an open protocol that all the vendors support, there’s a single API that the Deno maintainers need to implement and suddenly they support all the major vendors.
There were a few 3rd party attempts to get Open Telemetry working in Deno, but it feels like this sort of native support came out of nowhere. The first PR looks like it was opened only a couple months ago, mid November last year.
I played around with the new Open Telemetry functionality, I’ll share the steps to recreate. I’m using Fresh, which is a web framework built for Deno, and sending the telemetry to Honeycomb. Sending data to other vendors may be different, some may require you to use an Open Telemetry collector if they don’t suport direct OTLP ingest.
First, create a new project:
deno run -A -r https://fresh.deno.dev
Start the application with:
OTEL_DENO=true \
OTEL_EXPORTER_OTLP_ENDPOINT='https://api.honeycomb.io' \
OTEL_EXPORTER_OTLP_HEADERS='x-honeycomb-team=lkvJ6F0f7D8b9pqkR7uZ6C' \
OTEL_SERVICE_NAME='fresh-project' \
deno run --unstable-otel -A --watch=static/,routes/ dev.ts
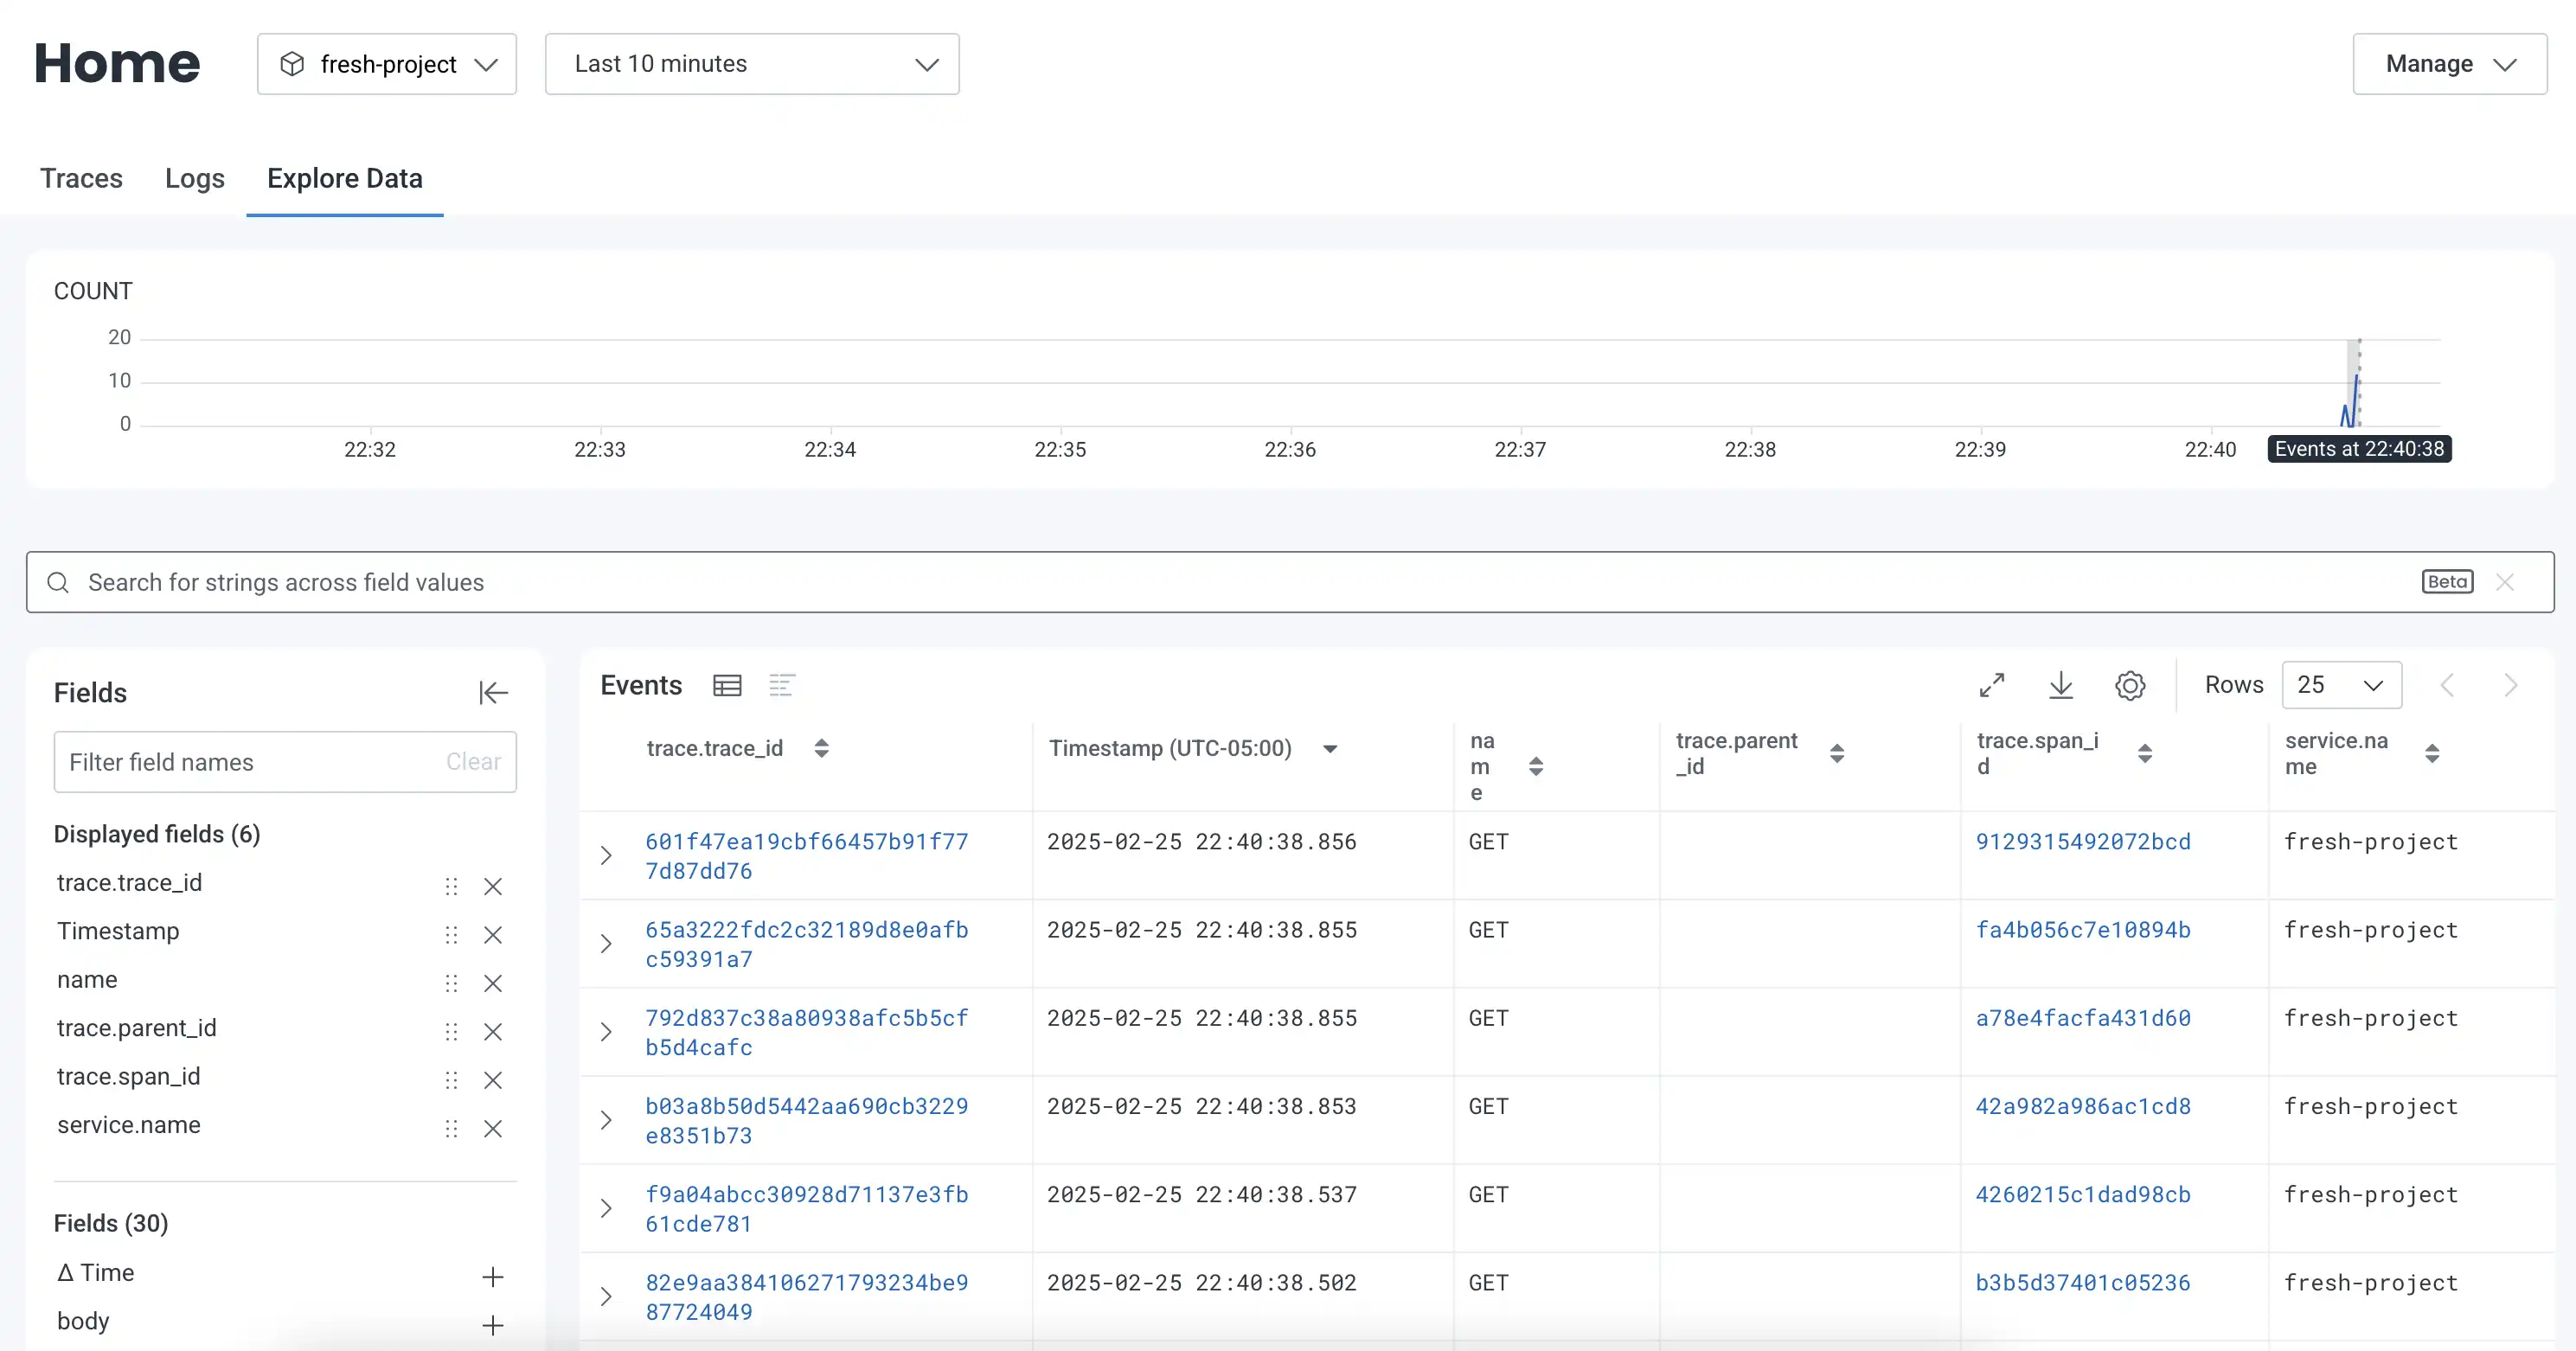
Then open the home page in a browser. Log in to Honeycomb and we should see the data showing up under a dataset named “fresh-project”, or whatever name was used for OTEL_SERVICE_NAME. We should see the traces generated by GET requests to the server have been sent to Honeycomb. This is because Deno.serve has been auto-instrumented by the runtime.
We can also see logs from the server’s startup.

If we want to recieve some telemetry from the browser, we can make a couple small updates. This isn’t technically showcasing any Deno-related features because it’s on the client side, but I think it’s nice to include.
First, add a provider component to the application wrapper. It’s basically just some example code provided in the Open Telemetry documentation. We’ll also need to install some extra dependencies the new component uses.
import {
  CompositePropagator,
  W3CBaggagePropagator,
  W3CTraceContextPropagator,
} from "@opentelemetry/core";
import { WebTracerProvider } from "@opentelemetry/sdk-trace-web";
import { SimpleSpanProcessor } from "@opentelemetry/sdk-trace-base";
import { registerInstrumentations } from "@opentelemetry/instrumentation";
import { getWebAutoInstrumentations } from "@opentelemetry/auto-instrumentations-web";
import { Resource } from "@opentelemetry/resources";
import { ATTR_SERVICE_NAME } from "@opentelemetry/semantic-conventions";
import { OTLPTraceExporter } from "@opentelemetry/exporter-trace-otlp-http";
import { ComponentChildren } from "preact";

const { ZoneContextManager } = await import("@opentelemetry/context-zone");

const exporter = new OTLPTraceExporter({
  url: "https://api.honeycomb.io/v1/traces",
  headers: {
    "x-honeycomb-team": "lkvJ6F0f7D8b9pqkR7uZ6C",
  },
});

const provider = new WebTracerProvider({
  resource: new Resource({
    [ATTR_SERVICE_NAME]: "fresh-project",
    "user_agent.original": globalThis.navigator.userAgent,
  }),
  spanProcessors: [
    new SimpleSpanProcessor(exporter),
  ],
});

const contextManager = new ZoneContextManager();

provider.register({
  contextManager,
  propagator: new CompositePropagator({
    propagators: [
      new W3CBaggagePropagator(),
      new W3CTraceContextPropagator(),
    ],
  }),
});

registerInstrumentations({
  tracerProvider: provider,
  instrumentations: [
    getWebAutoInstrumentations({
      "@opentelemetry/instrumentation-fetch": {
        propagateTraceHeaderCorsUrls: /.*/,
        clearTimingResources: true,
        applyCustomAttributesOnSpan(span) {
          span.setAttribute("app.synthetic_request", "false");
        },
      },
    }),
  ],
});

interface Props {
  children: ComponentChildren;
}

export default function TraceProvider({ children }: Props) {
  return (
    <>
      {children}
    </>
  );
}
If we visit Honeycomb again after reloading the page, we should see traces that look a little different (more spans). These represent the document loading.