In this post I would like to describe my recent experience of troubleshooting a slow-starting systemd unit implemented in .NET. While Linux troubleshooting is still new territory for me, I am gradually learning new tools and techniques. I wanted to share some of my discoveries in the hope that you will find them interesting 😊 […]
Show full content
In this post I would like to describe my recent experience of troubleshooting a slow-starting systemd unit implemented in .NET. While Linux troubleshooting is still new territory for me, I am gradually learning new tools and techniques. I wanted to share some of my discoveries in the hope that you will find them interesting
The faulty application was a usual worker service (dotnet new worker), running under a system account (created with useradd –system myservice) and integrated with systemd through the Microsoft.Extensions.Hosting.Systemd library. Its unit file is straightfoward:
[Unit]
Description=My service

[Service]
Type=notify
User=myservice
ExecStart=/usr/local/bin/myservice

[Install]
WantedBy=multi-user.target
The app was published using NativeAOT, so deployment only required copying the myservice binary to the /usr/local/bin folder. While the application launched instantly when executed from the build directory, running it as a service introduced a multi-second startup delay:
time sudo systemctl start test-service
________________________________________________________
Executed in    9.15 secs      fish           external
   usr time   27.59 millis    1.74 millis   25.86 millis
   sys time   26.31 millis    0.12 millis   26.19 millis
Interestingly, after the initial startup delay, the service operated normally. Since the delay was consistent across service restarts, I needed to investigate its cause.
Using bpftrace to profile the service start
Debugging system service startup is typically challenging. Initially, I attempted to add dotnet trace to the ExceStart= systemd setting, but it did not seem to work. Instead, I decided to use bpftrace, a powerful tool for interacting with Linux’s eBPF toolkit. While I’m still learning its syntax and features, I’m thoroughly impressed and expect it to become my go-to tracing tool on Linux. The profiling command I used for the service startup was:
It enables the user (@[ustack()]) stack collection at 99 Hertz (profile:hz:99), setting a filter on a process name (/ comm == “myservice” /). If you are unfamiliar with bpftrace syntax, have a look at the awesome one-liners tutorial. The command generated a myservice-trace.out file containing plaintext call stack dumps. Thanks to Brendan Gregg’s flame graph scripts, I could easily transform these stack traces into a flame graph:
The only problem was that .NET stacks were not resolved (however, the flame graph proved that the problem lies somewhere in managed stacks).
Resolving .NET stacks in bpftrace output
Before we focus on .NET, let me briefly explain how bpftrace resolves native call stacks. Most Linux distributions nowadays provide debuginfod URLs for downloading debug symbol files for the officially available packages. If you have a Windows background, it is very similar to Microsoft public symbols servers, except it’s better since all the symbols contain private information and links to the source files! Even if you haven’t configured them explicitly, there is a good chance the DEBUGINFOD_URLS variable is already set on your system. For example, on my EndevourOS system, it was set to https://debuginfod.archlinux.org by the core/libelf package. Note that the DEBUGINFOD_URLS variable might not be passed to the sudo command, breaking symbol resolution for tools requiring root privileges (bpftrace is one of them). To solve that problem, you may create a debuginfod text file in the /etc/sudoers.d folder with the following content:
## Preserve debuginfod settings for all apps
Defaults env_keep += "DEBUGINFOD_URLS"
When bpftrace (or any other debugging tool supporting debuginfod) resolves the call stacks, it downloads the debug symbol files and places them in a local cache, located at ~/.cache/debuginfod_client. The debug symbol files are grouped into folders with names equal to their respective build IDs. A build ID is a unique identifier added in the .note.gnu.build-id section of the ELF file. We can read this identifier with the file command. In my case, the file command showed the following information:
/usr/local/bin/myservice: ELF 64-bit LSB pie executable, x86-64, version 1 (SYSV), dynamically linked, interpreter /lib64/ld-linux-x86-64.so.2, BuildID[sha1]=cc8f0380b33a86c960bf9f5065f9575e6d4da016, for GNU/Linux 4.4.0, strippe
When we publish a .NET application using NativeAOT, the compiler produces an application binary file and a debug symbols file, in my case, myservice and myservice.dbg. We may publish the dbg file to our debuginfod symbol server (if we have one). In my case, I just copied the file directly into the cache folder (we need to use the root user cache since bpftrace requires root privileges):
Then I recorded the trace again, processed it with flame graph tools, and the result flame graph was much clearer:
Identifying the problem and solving it
While investigating the source code (HostApplicationBuilder.cs, HostingHostBuilderExtensions.cs), I discovered that the host builder for worker services (and ASP.NET applications) automatically creates inotify watchers for appsettings JSON files across all the directories in the working directory tree. Since systemd defaults to using the root folder (/) as the working directory for its units, my service was inadvertently creating watchers for every accessible folder in the file system!
There are two ways to resolve this issue:
Set a specific working folder for our service using the WorkingDirectory= setting in the systemd unit file, which will limit the scope of file watchers.
Disable file watchers completely by setting the DOTNET_hostBuilder:reloadConfigOnChange environment variable to false (systemd does not like ‘:’ so I needed to use ‘__’) or use the appsettings file to configure this setting.
I chose the second approach and my final service unit file looked as follows
[Unit]
Description=My service

[Service]
Type=notify
User=myservice
Environment="DOTNET_hostBuilder__reloadConfigOnChange=false"
ExecStart=/usr/local/bin/myservice

[Install]
WantedBy=multi-user.target
And the service started in milliseconds
systemctl daemon-reload
time sudo systemctl start test-service
________________________________________________________
Executed in  196.91 millis    fish           external
   usr time   15.42 millis  863.00 micros   14.55 millis
   sys time    8.35 millis    0.00 micros    8.35 millis
I host my research/test Windows VMs on Linux, using Samba to share files between systems. One day, while debugging a problem in WinDbg, the debugger froze on loading symbols for combase.dll. I knew that combase.pdb is a big file (contains private symbols), but usually downloading it was not that slow. To make things worse, when […]
Show full content
I host my research/test Windows VMs on Linux, using Samba to share files between systems. One day, while debugging a problem in WinDbg, the debugger froze on loading symbols for combase.dll. I knew that combase.pdb is a big file (contains private symbols), but usually downloading it was not that slow. To make things worse, when I tried to stop the loading, the whole VM hung. I initially suspected Microsoft symbol servers, but trying the combase.pdb URL directly in the browser worked flawlessly. So, the next suspect was my symbols folder which is a symbolic link to a Samba share with the same name (my _NT_SYMBOL_PATH is set to SRV*C:\symbols\dbg*https://msdl.microsoft.com/download/symbols). And, indeed, copying any bigger file from my Windows 11 machine to a Samba share was taking ages. As usual, in such cases, I collected a Wireshark trace of a copy operation and, to my horror, that’s what I saw in the scrollbar:
So many black bars in the timeline are never a good sign. On the other hand, they explained the slow write operation. The first failures were appearing immediately after the SMB2 WriteRequest call (you can see that I was trying to copy a comon (database :)):
Interestingly, there were no issues with reads from the share. I also need to add that I use QEMU/KVM and Virtual Machine Manager to run my VMs. The VMs use a network bridge to connect with my home network and Internet. And this bridge was my next suspect, so during the next copy operation, I collected a Wireshark trace on both Windows 11 (as before) and Linux, tracing the bridge interface. It was time to meticulously analyze the TCP requests. After disabling the NBSS (NetBIOS Session Service) in Wireshark dissectors, the first erroneous packets on Windows 11 (IP: 192.168.88.199) looked as follows:
In the first successful packet (length 162), the bridge (IP: 192.168.88.200) acknowledges receiving a TCP packet with a sequence number 2554, and in the second packet (length 124), Windows 11 acknowledges receiving a TCP packet with the sequence number 1596. Then, we can see that the VM sends two additional packets with sequence numbers 1596 and 19116. The latter has the length of 1460, so the expected Ack should be 20576 (19116 + 1460). Instead, the bridge resent a packet with Ack set to 1596. If we now look at the network trace collected on the bridge, we can immediately spot the problem:
Apparently, the bridge did not receive the packet with the 1596 sequence number. The “TCP Previous segment not captured” error message informs us about the dropped packets. The bridge tried to recover the TCP connection by resending Ack for the last successful packet. Windows then resent the missing bytes in packets of smaller lengths. However, after a second or two, the same problem reappeared. Seasoned network engineers probably already know what’s happening, but it took me a while to realize that the dropped packets have lengths much higher than MTU (usually 1500 bytes on Ethernet). With this information, I could narrow my searches for solution. Finally, I stumbled upon this post on serverfault.com. As suggested there, I disabled Large Send Offload in PowerShell (Disable-NetAdapterLso) and that was it! The writes to share were instantaneous again.
As I’m happy with the network transfer speed, I haven’t looked further, but I believe that the problem on the Linux side are large-receive-offloads being off on my bridge:
$ ethtool -k br0

Features for br0:
...
generic-segmentation-offload: off [requested on]
generic-receive-offload: on
large-receive-offload: off [fixed]
...
I couldn’t easily turn them on with ethtool (maybe it’s because I use Network Manager to configure this interface?) and I’m unable to verify this hypothesis. Please leave a comment if you have any insights or suggestions.
Another fact which I can’t explain is why those dropped packets were not accounted in the bridge network statistics (ip -s -s link show br0). Finally, it’s also strange that Windows was constantly retrying to send those big packets, even though the other side had issues handling them. Unfortunately, my network knowledge is quite limited, but thanks to issues like this one, I always learn something new
I hope you enjoyed reading this post and until the next time!
A few weeks ago I published Detours.Win32Metadata Nuget package containing a Win32 metadata for the detours library. When you combine it with CsWin32, you may easily generate PInvoke signatures for functions exported by the Detours library. Adding NativeAOT compilation, we are ready to implement a native function hook in C# and activate it in a […]
Show full content
A few weeks ago I published Detours.Win32Metadata Nuget package containing a Win32 metadata for the detours library. When you combine it with CsWin32, you may easily generate PInvoke signatures for functions exported by the Detours library. Adding NativeAOT compilation, we are ready to implement a native function hook in C# and activate it in a remote process. In this post, we will create an example WriteFile WinAPI function hook. The full source code of the project resides in the detours-native-aot folder in my blog samples repository.
Implementing the hook DLL
We start by installing the required packages: Detours.Win32Metadata and Microsoft.Windows.CsWin32. Next, in the NativeMethods.txt file, we specify which PInvoke signatures we will use. In our sample hook, the list is not that long:
Notice, that I don’t need any special files or additional steps to generate PInvoke signatures for the Detours library. I just put them in the same file as other Win32 API functions. I love the simplicity of this solution and I am a big fan of the CsWin32 project since its launch With the PInvokes generated, we are ready to define our WriteFile hook:
The HookedWriteFile is the hook function, so the function that will detour (or in our case wrap) the original WinAPI WriteFile function. I needed to mark it with the UnmanagedCallersOnly attribute as it will be called directly from the native code (no marshaling). Therefore, its signature must match the native one. When creating a detour, we also need to save somewhere the address of the original function, so we could call it from our hook. The OrigWriteFile variable serves this purpose. It is a function pointer, so we can point it to a native address and call it like any other method (no need for delegates or marshaling). As you see, our hook does not do much – prints a string to the Debug output, but you may put here any logic you want, only making sure that it could be NativeAOT compiled (I will get to it in just a moment). It is time to implement functions that would activate and deactivate our hook in a remote process:
There is a lot going on here, so let me explain the important parts. The test loader that we will implement in the next section will load the hook DLL into the target process. In C++, we could use DllMain to setup the detours, but this approach won’t work for C#. Thus, the loader must explicitly call the InitHooks or RemoveHooks functions to activate or deactivate WriteFile function hook. In InitHooks, we obtain the address of the original WriteFile function and assign it to a function pointer. DetourAttach will later install the detour at this address and will also update the pointer’s value with an address of the newly created trampoline to the original WriteFile function. We then save this pointer’s value to the Hooks.OrigWriteFile static field, so we could use it in the hook.
To make InitHooks and RemoveHooks methods callable we need to export them. The easiest way to do so is by using an EntryPoint parameter of the UnmanagedCallersOnly attribute. The string that we assign to this parameter will be the name of the native export after we publish the DLL. If you need higher control over the generated exports (for example, you would like to assign specific ordinal numbers to exported functions), you have to disable the automatic export generation by setting the IlcExportUnmanagedEntrypoints to false in the project file and use IlcArg property to define linker arguments. Here is an example project file where we explicitly configure the exports, additionally adding DetourFinishHelperProcess to make it work with the DetourCreateProcessWithDlls function:
The above command should produce a natively compiled DLL. Win-x86 is not available as a publish target for NativeAOT in .NET 8, but support for it is coming in .NET 9. The loader we will implement in the next section, will support both 32-bit and 64-bit hooking DLLs.
If we also want to statically link the detours library instead of using an external DLL, we need to simply add the following content to the csproj file:
Our first task is to inject a DLL into a remote process. We can easily do that by using the CreateRemoteThread function, but first we need to know the address of kernel32!LoadLibraryW. We will start by getting the kernel32 base address (handle) in the remote process:
static unsafe (HMODULE, string moduleFullPath) GetModuleInfo(HANDLE processHandle, bool isWow64, string moduleName)
{
    const uint MaxModulesNumber = 256;

    var moduleHandles = stackalloc HMODULE[(int)MaxModulesNumber];
    uint cb = MaxModulesNumber * (uint)Marshal.SizeOf<HMODULE>();
    uint cbNeeded = 0;

    PInvoke.EnumProcessModulesEx(processHandle, moduleHandles, cb, &cbNeeded,
        isWow64 ? ENUM_PROCESS_MODULES_EX_FLAGS.LIST_MODULES_32BIT : ENUM_PROCESS_MODULES_EX_FLAGS.LIST_MODULES_64BIT);

    if (cb >= cbNeeded)
    {
        moduleName = Path.DirectorySeparatorChar + moduleName.ToUpper();
        var nameBuffer = stackalloc char[(int)PInvoke.MAX_PATH];
        foreach (var iterModuleHandle in new Span<HMODULE>(moduleHandles, (int)(cbNeeded / Marshal.SizeOf<HMODULE>())))
        {
            if (PInvoke.GetModuleFileNameEx(processHandle, iterModuleHandle, nameBuffer,
                    PInvoke.MAX_PATH) is var iterModuleNameLength && iterModuleNameLength > moduleName.Length)
            {
                var iterModuleNameSpan = new Span<char>(nameBuffer, (int)iterModuleNameLength);
                if (IsTheRightModule(iterModuleNameSpan))
                {
                    return (iterModuleHandle, new string(iterModuleNameSpan));
                }
            }
        }
    }

    return ((HMODULE)nint.Zero, "");

    bool IsTheRightModule(ReadOnlySpan<char> m)
    {
        var moduleNameSpan = moduleName.AsSpan();
        for (int i = 0; i < moduleNameSpan.Length; i++)
        {
            if (char.ToUpper(m[i + m.Length - moduleNameSpan.Length]) != moduleNameSpan[i])
            {
                return false;
            }
        }
        return true;
    }
}
The 32-bit processes (WOW64) contain both 32-bit and 64-bit system DLLs. The above method will pick the system DLL version with the same bittness as the target process. Unfortunately, the module path returned by GetModuleFileNameEx might be incorrect in the 64-bit context (for example, C:\Windows\System32 instead of C:\Windows\SysWOW64), so we will set it manually (I did not find a WinAPI function that would return a valid 64-bit path, so please leave a comment if you know one):
And we will use the PEReader class to find the offset of the LoadLibraryW function:
static unsafe uint GetModuleExportOffset(string modulePath, string procedureName)
{
    using var pereader = new PEReader(File.OpenRead(modulePath));

    var exportsDirEntry = pereader.PEHeaders.PEHeader!.ExportTableDirectory;
    var exportsDir = (IMAGE_EXPORT_DIRECTORY*)pereader.GetSectionData(exportsDirEntry.RelativeVirtualAddress).Pointer;

    var functionNamesRvas = new Span<uint>(pereader.GetSectionData((int)exportsDir->AddressOfNames).Pointer,
                                            (int)exportsDir->NumberOfNames);
    var functionNamesOrdinals = new Span<ushort>(pereader.GetSectionData((int)exportsDir->AddressOfNameOrdinals).Pointer,
                                                    (int)exportsDir->NumberOfNames);
    var addressOfFunctions = pereader.GetSectionData((int)exportsDir->AddressOfFunctions).Pointer;

    for (int i = 0; i < functionNamesRvas.Length; i++)
    {
        var name = Marshal.PtrToStringAnsi((nint)pereader.GetSectionData((int)functionNamesRvas[i]).Pointer);
        var index = functionNamesOrdinals[i];

        if (name == procedureName)
        {
            return *(uint*)(addressOfFunctions + index * sizeof(uint));
        }
    }

    return 0;
}
We will also define helper functions to work with memory in the remote process and to create a remote thread:
static void CallFunctionInRemoteProcess(HANDLE processHandle, nint fnAddress, nint arg0 = 0)
{
    unsafe
    {
        if ((HANDLE)CreateRemoteThread(processHandle, null, 0, fnAddress, arg0, 0, null) is var remoteThreadHandle &&
            remoteThreadHandle == (HANDLE)0)
        {
            throw new Win32Exception(Marshal.GetLastWin32Error());
        }

        try
        {
            if (PInvoke.WaitForSingleObject(remoteThreadHandle, 5000) is var err && err == WAIT_EVENT.WAIT_TIMEOUT)
            {
                throw new Win32Exception((int)WIN32_ERROR.ERROR_TIMEOUT);
            }
            else if (err == WAIT_EVENT.WAIT_FAILED)
            {
                throw new Win32Exception(Marshal.GetLastWin32Error());
            }
        }
        finally
        {
            PInvoke.CloseHandle(remoteThreadHandle);
        }
    }
}

static nint AllocAndWriteData(HANDLE remoteProcessHandle, Span<byte> data)
{
    unsafe
    {
        var allocAddr = PInvoke.VirtualAllocEx(remoteProcessHandle, null, (nuint)data.Length,
            VIRTUAL_ALLOCATION_TYPE.MEM_RESERVE | VIRTUAL_ALLOCATION_TYPE.MEM_COMMIT, PAGE_PROTECTION_FLAGS.PAGE_READWRITE);
        if (allocAddr != null)
        {
            // VirtualAllocEx initializes memory to 0
            fixed (void* dataPtr = data)
            {
                if (!PInvoke.WriteProcessMemory(remoteProcessHandle, allocAddr, dataPtr, (nuint)data.Length, null))
                {
                    throw new Win32Exception(Marshal.GetLastWin32Error());
                }
            }
            return (nint)allocAddr;
        }
        else
        {
            throw new Win32Exception(Marshal.GetLastWin32Error());
        }
    }
}

static void FreeMemory(HANDLE remoteProcessHandle, nint allocAddr)
{
    unsafe
    {
        PInvoke.VirtualFreeEx(remoteProcessHandle, (void*)allocAddr, 0, VIRTUAL_FREE_TYPE.MEM_RELEASE);
    }
}
And we are ready to implement the tests:
const uint processId = 12345; // set it to a valid process  Id

const PROCESS_ACCESS_RIGHTS AccessRightsForCreatingRemoteThread = PROCESS_ACCESS_RIGHTS.PROCESS_CREATE_THREAD |
        PROCESS_ACCESS_RIGHTS.PROCESS_QUERY_INFORMATION | PROCESS_ACCESS_RIGHTS.PROCESS_VM_OPERATION |
        PROCESS_ACCESS_RIGHTS.PROCESS_VM_WRITE | PROCESS_ACCESS_RIGHTS.PROCESS_VM_READ;

[Test]
public static void SetHook()
{
    // find a process to hook
    var processHandle = PInvoke.OpenProcess(AccessRightsForCreatingRemoteThread, false, processId);

    bool isWow64 = IsWow64(processHandle);

    string systemDirectory = isWow64 ? Environment.GetFolderPath(Environment.SpecialFolder.SystemX86) : Environment.SystemDirectory;

    // load a hook dll
    var hookDllName = isWow64 ? "hook_x86.dll" : "hook_x64.dll";
    var hookDllPath = Path.Combine(AppContext.BaseDirectory, hookDllName);
    var allocAddr = AllocAndWriteData(processHandle, Encoding.Unicode.GetBytes(hookDllPath + "\0").AsSpan());
    try
    {
        Assert.That(GetModuleInfo(processHandle, isWow64, "kernel32.dll") is var (kernel32Handle, _) && kernel32Handle != 0);

        var kernel32Path = Path.Combine(systemDirectory, "kernel32.dll");
        var fnLoadLibraryW = kernel32Handle + (nint)GetModuleExportOffset(kernel32Path, "LoadLibraryW");
        CallFunctionInRemoteProcess(processHandle, fnLoadLibraryW, allocAddr);
    }
    finally
    {
        FreeMemory(processHandle, allocAddr);
    }

    // set hooks
    Assert.That(GetModuleInfo(processHandle, isWow64, hookDllName) is var (hookDllHandle, _) && hookDllHandle != 0);
    var fnInitHooks = hookDllHandle + (nint)GetModuleExportOffset(hookDllPath, "InitHooks");
    CallFunctionInRemoteProcess(processHandle, fnInitHooks);
}

[Test]
public static void UnsetHook()
{
    var processHandle = PInvoke.OpenProcess(AccessRightsForCreatingRemoteThread, false, processId);

    bool isWow64 = IsWow64(processHandle);

    var hookDllName = isWow64 ? "hook_x86.dll" : "hook_x64.dll";
    var hookDllPath = Path.Combine(AppContext.BaseDirectory, hookDllName);

    // unset hooks
    Assert.That(GetModuleInfo(processHandle, isWow64, hookDllName) is var (hookDllHandle, _) && hookDllHandle != 0);
    var fnInitHooks = hookDllHandle + (nint)GetModuleExportOffset(hookDllPath, "RemoveHooks");
    CallFunctionInRemoteProcess(processHandle, fnInitHooks);
}
Now, try to run any process that writes to a file. Set the process ID in the test and run SetHook. You should start seeing HookedWriteFile messages in the system global debug output (for example, you may use DebugView for this purpose). Of course, setting the process ID manually is not the best way to do so and surely not automatic, but it’s only a POC so please close your eyes to that
When we need to change the PE file imports, we might either modify the binary file in the file system or perform updates after it has been loaded to the memory. In this post, I will focus on the latter approach, showing you moments in the process lifetime when such changes are possible. We will […]
Show full content
When we need to change the PE file imports, we might either modify the binary file in the file system or perform updates after it has been loaded to the memory. In this post, I will focus on the latter approach, showing you moments in the process lifetime when such changes are possible. We will end up with a small app capable of updating imports in newly started remote processes.
What we will be modifying
Let’s begin with some basics on the PE file structure. Typically, the data about PE file imports resides in the .idata section. And we need to read the image import directory (IMAGE_DIRECTORY_ENTRY_IMPORT) in the NT Optional Header to understand how this data is laid out. In this directory, we will find an array of IMAGE_IMPORT_DESCRIPTOR structures:
typedef struct _IMAGE_IMPORT_DESCRIPTOR {
    union {
        DWORD   Characteristics;            // 0 for terminating null import descriptor
        DWORD   OriginalFirstThunk;         // RVA to original unbound IAT (PIMAGE_THUNK_DATA)
    } DUMMYUNIONNAME;
    DWORD   TimeDateStamp;                  // 0 if not bound,
                                            // -1 if bound, and real date\time stamp
                                            //     in IMAGE_DIRECTORY_ENTRY_BOUND_IMPORT (new BIND)
                                            // O.W. date/time stamp of DLL bound to (Old BIND)
    DWORD   ForwarderChain;                 // -1 if no forwarders
    DWORD   Name;
    DWORD   FirstThunk;                     // RVA to IAT (if bound this IAT has actual addresses)
} IMAGE_IMPORT_DESCRIPTOR;
The Name field points to the name of the imported DLL and the OriginalFirstThunk and FirstThunk fields point to arrays of IMAGE_THUNK_DATA, which hold information about the functions imported from a given library. All those fields’ values are relative virtual addresses (RVAs), so offsets to the image base address after it has been loaded into memory. Additionally, a thunk could represent either an import by ordinal (IMAGE_ORDINAL_FLAG is set) or an import by name (the thunk holds an RVA to the IMAGE_IMPORT_BY_NAME structure). It is important to note that each thunk array must end with a zeroed thunk. You may be wondering why there are two thunk arrays per each DLL. At the beginning, they hold the same values, but once the imports are resolved, the loader will overwrite values in the FirstThunk array with actual addresses of the resolved functions. The thunks for all the imports are usually the first bytes of the .idata section and they are also referenced by the import address table (IAT) directory (I highly recommend downloading PE 102 by @corkami – a beautiful and very readable diagram of the PE file format).
Depending on what we want to achieve, we may either modify only the resolved thunk arrays or the whole descriptors array. For example, redirecting one function to another when both functions belong to already loaded DLLs could be achieved by simply overwriting the corresponding resolved address in a thunk array. However, injecting a new DLL to the process or adding a new function import to an existing DLL requires changes to the descriptors array. And that’s the case on which I will focus mainly in this post.
The application we are going to develop, named importando, accepts a list of tasks (-i) to perform on the remote process image:
-i test.dll!TestMethod or test.dll#1 to inject a function by name or by ordinal
-i test.dll!TestMethod:test2.dll!TestMethod to replace a given imported function with a different one
Let’s now examine what are our options to implement those tasks.
Updating a suspended process
A common approach is to start the process as suspended (CREATE_SUSPENDED flag) and modify the imports table before the first thread resumes execution. Unfortunately, when the CreateProcess function returns, the loader has already resolved the imported function addresses (ntdll!LdrStateInit equals 2). Therefore, this approach will not work if we need to fix an incorrect import definition (for example, a wrong DLL or function name). However, as the loader has not yet reached completion (LdrStateInit is not 3), we still may perform some actions on the import directory. For example, we can inject a new DLL into a process (like DetoursCreateProcessWithDlls). We may also override addresses of the resolved functions. When the main thread resumes (ResumeThread), the loader will finish its work and the code will execute with our changes applied.
Updating a process from a debugger
If we need to have earlier access to the executable import directory data, we could resort to the debugger API. Running process under a debugger gives us a few more chances to apply import modifications. The first interesting debug event is CREATE_PROCESS_DEBUG_EVENT. When the debugger receives it, the loader has not yet started resolving the dependencies, but the executable image is already loaded into the memory. That is a perfect moment for fixing problems that are causing critical loader errors, for example, an infamous “entry not found” error:
The next interesting event is EXCEPTION_DEBUG_EVENT with ExceptionRecord.ExceptionCode equal to STATUS_BREAKPOINT (if we are debugging a 32-bit process with a 64-bit debugger, we should skip the first STATUS_BREAKPOINT and instead wait for STATUS_WX86_BREAKPOINT). It is the initial process breakpoint, triggered by the loader when it is in a state very similar to the one in an initially suspended process, described in the previous section (so LdrStateInit equals 2). Finally, the debugger also receives LOAD_DLL_DEBUG_EVENT for each loaded DLL before the loader started resolving its dependencies. Thus, in the handler of this event, we could fix issues in the import directories of the dependent libraries.
I also recorded a YouTube video where I present how you may make those fixes manually in WinDbg. It could be helpful to better visualize the steps we will perform in the importando code.
Implementing importando (in C#)
As you remember from the first section, our goal is to support both import redirects and new import injections. If you are wondering why importando, I thought it sounds nice and the name describes what we will be doing: import and override (it happens in the reverse order, but it is just a nitpick ). As we want to support all types of modifications to the import directory, the logical choice is to use the debugging API. Thanks to CsWin32, writing a native debugger in C# is not a very demanding task. Here is the debugger loop with the few events importando uses:
HANDLE processHandle = HANDLE.Null;
nuint imageBase = 0;
bool is64bit = false;
bool isWow64 = false;

ModuleImport[] originalImports = [];
ModuleImport[] newImports = [];

while (!cts.Token.IsCancellationRequested)
{
    if (WaitForDebugEvent(1000) is { } debugEvent)
    {
        switch (debugEvent.dwDebugEventCode)
        {
            case DEBUG_EVENT_CODE.CREATE_PROCESS_DEBUG_EVENT:
                {
                    logger.WriteLine($"CreateProcess: {debugEvent.dwProcessId}");

                    Debug.Assert(pid == debugEvent.dwProcessId);
                    var createProcessInfo = debugEvent.u.CreateProcessInfo;

                    // we are closing hFile handle after we finish reading the image data
                    using var pereader = new PEReader(new FileStream(
                        new SafeFileHandle(createProcessInfo.hFile, true), FileAccess.Read));

                    processHandle = createProcessInfo.hProcess;
                    is64bit = pereader.Is64Bit();
                    isWow64 = Environment.Is64BitProcess && !is64bit;
                    unsafe { imageBase = (nuint)createProcessInfo.lpBaseOfImage; }

                    (originalImports, newImports) = UpdateProcessImports(processHandle,
                        pereader, imageBase, importUpdates, forwards);
                }
                break;

            case DEBUG_EVENT_CODE.EXCEPTION_DEBUG_EVENT:
                if (debugEvent.u.Exception.ExceptionRecord.ExceptionCode == (
                    isWow64 ? NTSTATUS.STATUS_WX86_BREAKPOINT : NTSTATUS.STATUS_BREAKPOINT))
                {
                    // first breakpoint exception is the process breakpoint - it happens when loader finished its initial
                    // work and thunks are resolved
                    Debug.Assert(imageBase != 0 && !processHandle.IsNull);
                    UpdateForwardedImports(processHandle, is64bit, imageBase, originalImports, newImports, forwards);
                    cts.Cancel();
                }
                else
                {
                    logger.WriteLine($"Unexpected exception: {debugEvent.u.Exception.ExceptionRecord.ExceptionCode.Value:x}");
                }
                break;

            case DEBUG_EVENT_CODE.EXIT_PROCESS_DEBUG_EVENT:
                cts.Cancel();
                break;
            default:
                break;
        }

        if (!PInvoke.ContinueDebugEvent(debugEvent.dwProcessId,
            debugEvent.dwThreadId, NTSTATUS.DBG_EXCEPTION_NOT_HANDLED))
        {
            throw new Win32Exception(Marshal.GetLastPInvokeError(), $"{nameof(PInvoke.ContinueDebugEvent)} error");
        }
    }
}
I will mention that again later, but the full source code is available in the importando GitHub repository. In the post, I will rather focus on the crucial pieces of the solution, so please refer to the code in the repository in case you would like to check the skipped parts.
I also created a few wrapping record classes for the parsed import data. Using native structures could be an option, however, I wanted to make them more C# friendly and also architecture agnostic.
interface IFunctionImport { }

record FunctionImportByName(uint Rva, ushort Hint, string FunctionName) : IFunctionImport;

record FunctionImportByOrdinal(uint Ordinal) : IFunctionImport;

record NullImport : IFunctionImport;

record FunctionThunk(IFunctionImport Import);

record ModuleImport(string DllName, uint DllNameRva, uint OriginalFirstThunkRva,
    uint FirstThunkRva, FunctionThunk[] FirstThunks)
The handler of CREATE_PROCESS_DEBUG_EVENT, or rather the UpdateProcessImports function, reads the existing imports (PEImports.ReadModuleImports), prepares new import descriptors with thunk arrays for the updated ones (PEImports.PrepareNewModuleImports), and saves them in the remote process memory (PEImports.UpdateImportsDirectory). Btw., the PEReader class is a great helper in parsing PE structures. We also need to update the imports data directory in the NT optional header as it should point to our new import descriptors (UpdatePEDirectory):
Because most of the RVA addresses in PE file header are 4-byte long (DWORD), the PEImports.UpdateImportsDirectory needs to allocate space in the memory for the new imports as near to the image base address as possible. I ported to C# the FindAndAllocateNearBase function from the Detours library to achieve that.
To better show you what importando is doing, I draw a simple picture of the memory layout after an example forward of the shell32.dll!StrCpyNW to shlwapi.dll!StrCpyNW. Notice a new import descriptors table (separate from the original one) that is pointed by the import directory. Importando also needed to create new thunk arrays for imports requiring an update (in this case, shell32.dll) and for new ones (shlwapi.dll), but reused existing thunks for unmodified imports (user32.dll):
Once we updated the import directories, we are ready to resume the process execution and wait for the loader to perform its initial work.
This leads us to the next stop in the debugger loop, the EXCEPTION_DEBUG_EVENT handler. The name of the event may be a little misleading as it is triggered not only when code in the remote process throws an exception, but also when it hits a breakpoint. And Windows loader triggers a breakpoint (STATUS_BREAKPOINT) when it detects that there is a debugger attached to the starting process. In the WOW64 context (when a 64-bit debugger debugs a 32-bit application), there are actually two initial breakpoints, STATUS_BREAKPOINT and STATUS_WX86_BREAKPOINT, and it is the latter that interests us. At this point, the loader resolved all the addresses in the thunk arrays from the new imports directory. However, we are not done yet as the old thunks still hold RVA (unresolved) addresses. We need to update them as those thunks are referenced by the application code. And here comes the last step in our coding journey, the UpdateForwardedImports function:
static void UpdateForwardedImports(HANDLE processHandle, bool is64bit, nuint imageBase,
    ModuleImport[] originalImports, ModuleImport[] newImports, (string ForwardFrom, string ForwardTo)[] forwards)
{
    int thunkSize = is64bit ? Marshal.SizeOf<IMAGE_THUNK_DATA64>() : Marshal.SizeOf<IMAGE_THUNK_DATA32>();

    uint GetThunkRva(ModuleImport[] moduleImports, string importName)
    { /* ... */  }

    void CopyThunkValues(uint fromRva, uint toRva)
    { /* ... */  }

    foreach ((string forwardFrom, string forwardTo) in forwards)
    {
        var originalThunkRva = GetThunkRva(originalImports, forwardFrom);
        var newThunkRva = GetThunkRva(newImports, forwardTo);

        if (originalThunkRva != 0 && newThunkRva != 0)
        {
            // new thunk should be resolved by now, so we may copy its value to the original place
            // that could be referenced by application code
            CopyThunkValues(newThunkRva, originalThunkRva);
        }
        else
        {
            Console.WriteLine($"WARNING: could not find import {forwardFrom} or {forwardTo}");
        }
    }
}
We may now continue debugging or detach from the remote process (that’s what importando is doing) and let it freely run. Our job is done and we should see new imports in the modules list of our target application.
When writing system applications in C# we often need to interact with the system APIs directly. And it has always been a challenge to write proper PInvoke signatures. However, with the introduction of the Windows metadata project and later, cswin32, things changed significantly. In this post, I will walk you through the steps required to […]
Show full content
When writing system applications in C# we often need to interact with the system APIs directly. And it has always been a challenge to write proper PInvoke signatures. However, with the introduction of the Windows metadata project and later, cswin32, things changed significantly. In this post, I will walk you through the steps required to generate C# bindings for a sample native library. I picked Detours, because I needed it for withdll, my new tool inspired by the withdll example from the Detours repository. The post by Rafael Rivera describing how to create bindings for Rust language helped me tremendously in writing this post (and bindings ).
Creating Windows metadata
Preparing the metadata project
Before we could see the generated C# code, we need to build a Windows metadata (winmd) file. Rafael describes the steps in details, so I will take a shortcut here and show you the generate.proj for the detours library:
I also needed to add the ImportLibs item as my library is not in the folders searched normally by the MSVC compiler. Additionally, the output of the detours build is a static library (detours.lib) that we can link with our project. Theoretically, we can point Windows Metadata Generator to static libraries using the StaticLibs tag. However, I did not manage to make it work without creating an additional shared library. There is an old issue in the win32metadata project about importing static libraries directly, but it was never resolved. I noticed though that the generated methods have StaticLibraryAttribute attached to them. Still, I’m unsure what its purpose is.
Building a wrapping DLL for the static library
Fortunately, creating a shared library for a static library is a straightforward process. You need a cpp file, for example:
Now, we may point ImportLibs to the detours-dll folder and try to build the detours.winmd file.
Building the metadata project
This step should be as straightforward as running the dotnet build command. Sometimes, however, you may run into problems with the parsers. For detours, for example, I needed to remove a section from the detours header. Finally, the build was successful and I could verify in ILSpy that the detours.winmd file contains all the methods exported by my detours.dll:
Generating and using bindings from the metadata project
With the metadata file ready, it’s time to use it in our C# project. Firstly, we will install the cswin32 package that imports Win32 metadata and allows us to define which types and methods we want to import through the NativeMethods.txt file. Cswin32 by default understands only names defined in the Win32 metadata project. However, thanks to the ProjectionMetadataWinmd tag we can easily make it process our custom metadata files as well!
// An example C# code using the DetourCreateProcessWithDlls function

using PInvokeDetours = Microsoft.Detours.PInvoke;
using PInvokeWin32 = Windows.Win32.PInvoke;

var pcstrs = dllPaths.Select(path => new PCSTR((byte*)Marshal.StringToHGlobalAnsi(path))).ToArray();
try
{
    if (!PInvokeDetours.DetourCreateProcessWithDlls(null, ref cmdline, null, null, false,
        createFlags, null, null, startupInfo, out var processInfo,
        pcstrs, null))
    {
        throw new Win32Exception();
    }

    PInvokeWin32.CloseHandle(processInfo.hThread);
    PInvokeWin32.CloseHandle(processInfo.hProcess);

    if (debug)
    {
        PInvokeWin32.DebugActiveProcessStop(processInfo.dwProcessId);
    }
}
finally
{
    Array.ForEach(pcstrs, pcstr => Marshal.FreeHGlobal((nint)pcstr.Value));
}
The NativeAOT compilation gives us also an option to statically link the detours library:
It’s fantastic that we can have all the native imports in one place. If you would like to examine a working project that uses the presented detours bindings, please check the withdll repository. You may use it to, for example, inject detours DLLs that hook Win API functions and trace them. I describe this usage scenario in a guide at wtrace.net.
A few months ago, I switched my main desktop to Manjaro, and I’m glad about it. Manjaro Linux is a polished and well-designed Linux distribution. As I like simplicity and a minimalistic approach, I chose the XFCE Desktop edition. Switching to Linux did not make me abandon the Windows platform completely. I spend lots of […]
Show full content
A few months ago, I switched my main desktop to Manjaro, and I’m glad about it. Manjaro Linux is a polished and well-designed Linux distribution. As I like simplicity and a minimalistic approach, I chose the XFCE Desktop edition. Switching to Linux did not make me abandon the Windows platform completely. I spend lots of my work and hobby time on this OS. But I run it in QEMU-KVM VMs, configured through the Virtual Manager. As I experiment with various system settings, I have a base VM image and clone it when necessary for new projects/research. Thanks to this configuration, I finally stopped breaking my main system One thing I needed to figure out was a way to share files between my Linux host and Windows VMs. I picked Samba as I wanted something which would look native in Windows. And here my troubleshooting story begins I could summarize it in one sentence: “always check the system journald log,” but if you’re interested in a more extended and convoluted approach, please read on
When Samba returns NT_STATUS_ACCESS_DENIED
My smb.conf file looks as follows:
[global]
   browse list = yes
   config backend = file
   debug pid = yes
   debug timestamp = yes
   debug uid = yes
   dns proxy = no
   follow symlinks = no
   guest account = nobody
   load printers = no
   log file = /var/log/samba/%m.log
   log level = 2
   logging = systemd file
   map to guest = Bad User
   max log size = 1000
   name resolve order = lmhosts bcast host wins
   passdb backend = tdbsam
   security = user
   server role = standalone server
   usershare path = /var/lib/samba/usershare
   usershare allow guests = yes
   usershare max shares = 100
   usershare owner only = yes
   workgroup = WORKGROUP

[homes]
   browseable = no
   comment = Home Directories
   create mask = 0660
   directory mask = 0770
   guest ok = no
   read only = no
   valid users = %S

[winshare]
   browseable = yes
   comment = Share directory
   guest ok = no
   path = /mnt/data/winshare
   read only = no
   force group = +winshare
   valid users = me,ssolnica

[symbols]
   browseable = yes
   comment = Symbols
   guest ok = no
   path = /mnt/data/symbols
   read only = no
   valid users = me
I created the Windows user (smbpasswd -a me) and enabled smb and nmb services (systemctl enable nmb && systemctl enable smb). I configured Samba in Server Standalone mode as I did not need any of the AD features (by the way, it’s incredible that you may set up the whole AD in Linux!). When I tried my shares in Windows, the \\mypc.local\me share was working fine, but \\mypc.local\winshare was returning NT_STATUS_ACCESS_DENIED. I stopped the Samba service and ran it manually with debug level set to 3 (alternatively, you could specify debug level in the smb.conf file):
$ smbclient -U me //mypc/winshare
Password for [WORKGROUP\me]:
Try "help" to get a list of possible commands.
smb: \> ls
NT_STATUS_ACCESS_DENIED listing \*
The error reported by Samba pointed to the file system. So I restarted the service and attached strace to it. You need to make sure to trace the child processes (-f/-ff) as the primary Samba server launches a child server for each client session:
strace -p 4350 -ff -o smbd.strace
Here is some interesting content from the output file:
We can see that the Samba process switches the effective user and group to the authenticated user (me) and then performs actions on the file system. We can see in the trace that the openat syscall fails with the EACCESS error. I double-checked all file system permissions and made me the owner of the winshare folder. Still, the EACCESS error persisted. I was so confused that I even wrote a simple app to reproduce the syscalls above:
As you may guess, there was no error when I ran it. I scratched my head, looking online for similar issues, but could find nothing. As I had a lot of pending work, I started using the \\mypc.local\me share. Samba worked fine except for two issues: it was impossible to list the browseable shares from the Windows machines, and, secondly, the initial I/O requests over Samba were often very slow. Still, the initial problem was bugging me the most.
After a few weeks, I finally found some time to give it a second try.
Filesystem security checks are not the only ones
I again struggled with Samba config (I read the whole smb.conf man page! :)), but ended with strace. As I had my sample application working, I started comparing the process properties in the proc file system. And there, I discovered the attr folder, which stores various security-related attributes. The /proc/{pid}/attr/current file for my sample process contained unconfined while for the smbd process, its content was smbd (enforce). After searching through manual pages and Arch Linux wiki, I found that those settings come from the AppArmor module. The aa-status command only confirmed that:
# aa-status
apparmor module is loaded.
80 profiles are loaded.
77 profiles are in enforce mode.
...
   samba-dcerpcd
   samba-rpcd
   samba-rpcd-classic
   samba-rpcd-spoolss
   smbd
...
9 processes are in enforce mode.
   /usr/bin/avahi-daemon (1479) avahi-daemon
   /usr/bin/avahi-daemon (1489) avahi-daemon
   /usr/bin/dnsmasq (1698) dnsmasq
   /usr/bin/dnsmasq (1699) dnsmasq
   /usr/bin/nmbd (1778) nmbd
   /usr/bin/smbd (1785) smbd
   /usr/bin/smbd (1787) smbd
   /usr/bin/smbd (1788) smbd
   /usr/bin/smbd (5225) smbd
...
Now, I needed to locate the problematic AppArmor profiles. But how to find their names? Obviously, in the system journal! I should have checked it in the very beginning. I was studying the smb unit logs while all the details were at my fingertips:
The smbd profile, defined in /etc/apparmor.d/usr.sbin.smbd, denies access to my target folder. Let’s have a look at it (I left only the essential parts):
abi <abi/3.0>,

include <tunables/global>

profile smbd /usr/{bin,sbin}/smbd {
  ...

  /etc/mtab r,
  /etc/netgroup r,
  /etc/printcap r,
  /etc/samba/* rwk,
  @{PROC}/@{pid}/mounts r,
  @{PROC}/sys/kernel/core_pattern r,
  /usr/lib*/samba/vfs/*.so mr,
  /usr/lib*/samba/auth/*.so mr,
  /usr/lib*/samba/charset/*.so mr,
  /usr/lib*/samba/gensec/*.so mr,
  /usr/lib*/samba/pdb/*.so mr,
  /usr/lib*/samba/{,samba/}samba-bgqd Px -> samba-bgqd,
  /usr/lib*/samba/{,samba/}samba-dcerpcd Px -> samba-dcerpcd,
  /usr/lib*/samba/{lowcase,upcase,valid}.dat r,
  /usr/lib/@{multiarch}/samba/*.so{,.[0-9]*} mr,
  /usr/lib/@{multiarch}/samba/**/ r,
  /usr/lib/@{multiarch}/samba/**/*.so{,.[0-9]*} mr,
  /usr/share/samba/** r,
  /usr/{bin,sbin}/smbd mr,
  /usr/{bin,sbin}/smbldap-useradd Px,
  /var/cache/samba/** rwk,
  /var/{cache,lib}/samba/printing/printers.tdb mrw,
  /var/lib/samba/** rwk,
  /var/lib/sss/pubconf/kdcinfo.* r,
  @{run}/dbus/system_bus_socket rw,
  @{run}/smbd.pid rwk,
  @{run}/samba/** rk,
  @{run}/samba/ncalrpc/ rw,
  @{run}/samba/ncalrpc/** rw,
  @{run}/samba/smbd.pid rw,
  /var/spool/samba/** rw,

  @{HOMEDIRS}/** lrwk,
  /var/lib/samba/usershares/{,**} lrwk,

  # Permissions for all configured shares (file autogenerated by
  # update-apparmor-samba-profile on service startup on Debian and openSUSE)
  include if exists <samba/smbd-shares>
  include if exists <local/usr.sbin.smbd-shares>

  # Site-specific additions and overrides. See local/README for details.
  include if exists <local/usr.sbin.smbd>
Now, all is clear. AppArmor adds MAC (Mandatory Access Control) to the Samba process and interferes with the file system access checks. My share path (/mnt/data/winshare) was not in the AppArmor profile; thus, access was denied. I believe that Debian and openSUSE users might not experience this problem thanks to the update-apparmor-samba-profile script, but I haven’t had a chance to check it. Anyway, the solution for me was to create /etc/apparmor.d/local/usr.sbin.smbd-shares with the missing access rights (I will have more shares from the data drive, so I just gave access to /mnt/data).
While testing my shares with the system journal monitored, I discovered some more rules missing in the default AppArmor profiles. And I found that I wasn’t the only one with this problem. Inglebard reported a very similar issue and provided updates to the rules that worked for him. I added a comment with my findings. Finally, below are the updates that fixed all my problems with Samba.
$ cat /etc/apparmor.d/local/samba-dcerpcd
# Site-specific additions and overrides for 'samba-dcerpcd'

@{run}/samba-dcerpcd.pid lrwk,

/var/cache/samba/** rwk,

@{HOMEDIRS}/** lrwk,
/var/lib/samba/usershares/{,**} lrwk,

include if exists <samba/smbd-shares>
include if exists <usr.sbin.smbd-shares>
$ cat /etc/apparmor.d/local/samba-rpcd
# Site-specific additions and overrides for 'samba-rpcd'

/var/cache/samba/** rwk,

@{HOMEDIRS}/** lrwk,
/var/lib/samba/usershares/{,**} lrwk,

include if exists <samba/smbd-shares>
include if exists <usr.sbin.smbd-shares>
$ cat /etc/apparmor.d/local/samba-rpcd-classic
# Site-specific additions and overrides for 'samba-rpcd-classic'

/var/cache/samba/** rwk,
/dev/urandom rwk,

@{HOMEDIRS}/** lrwk,
/var/lib/samba/usershares/{,**} lrwk,

include if exists <samba/smbd-shares>
include if exists <usr.sbin.smbd-shares>
More than ten years ago (how time flies!), when I published the basic sample of a COM+ server and client, I thought that I wouldn’t be touching this subject again. But here we are, in 2022, and I have so much interaction with COM at work that I decided to write a new, updated, and […]
Show full content
More than ten years ago (how time flies!), when I published the basic sample of a COM+ server and client, I thought that I wouldn’t be touching this subject again. But here we are, in 2022, and I have so much interaction with COM at work that I decided to write a new, updated, and a bit more detailed post about this technology I don’t want to convince you to use COM as the backbone for your new applications. Instead, I want to show you how you may approach and use COM APIs if you need to work with them. We will also do some COM debugging in WinDbg. Additionally, I plan to release a new COM troubleshooting tool as part of the wtrace toolkit. Remember to subscribe to wtrace updates if you’re interested.
Today’s post will continue using the old Protoss COM classes, but we will update the code with various modern ideas. As you may remember, Nexus and Probe classes represent Blizzard’s Starcraft game objects. Nexus is a building that may produce Probes (CreateUnit method in the INexus interface), and Probe may build various structures, including Nexuses (ConstructBuilding method in the IProbe interface). I also added a new IGameObjectinterface, shared by Nexus and Probe, that returns the cost in minerals and the time needed to build a given game object. In IDL, it looks as follows:
If we run midl.exe after this change, it will generate a type library file (protoss.tlb). The type library provides a language-agnostic way to access COM metadata. For example, we may import it to a .NET assembly using the tlbimp.exe tool from .NET Framework SDK.
Updating the Protoss COM server
As you remember, the COM server requires a few DLL exports to make its COM classes instantiable. One of them is DllGetClassObject. The DllGetClassObject function from the old post directly constructed the Nexus and Probe objects. The more common approach is to return an IClassFactory instance for each implemented class and let the clients call its CreateInstance method. The clients often do this implicitly by calling the CoCreateInstance or CoCreateInstanceEx functions. These functions first ask for a class factory object and later use it to create a requested class instance. Supporting IClassFactory is straightforward:
The ProtossObjectClassFactory is a class template implementing the IClassFactory interface. I want to bring your attention to the CreateInstance method:
HRESULT __stdcall CreateInstance(IUnknown* pUnkOuter, REFIID riid, void** ppv) override {
    if (pUnkOuter) {
        return CLASS_E_NOAGGREGATION;
    }

    try {
        wil::com_ptr_t<IUnknown> unknown{};
        // attach does not call AddRef (we set ref_count to 1 in COM Objects)
        unknown.attach(static_cast<IT*>(new T()));
        return unknown->QueryInterface(riid, ppv);
    } catch (const std::bad_alloc&) {
        return E_OUTOFMEMORY;
    }

    return S_OK;
}
It uses the wil::com_ptr_t class. It’s one of the many smart pointers provided by Windows Implementation Library. Thanks to wil::com_ptr_t or wil::unique_handle, we no longer need to call Release or CloseHandle methods explicitly – they are called automatically in the smart pointer destructors. Thus, we free the resources when the pointers go out of scope. WIL and modern C++ really make using RAII with Windows API straightforward .
One missing piece in the old code was registration. I used reg files to register the Protoss COM library in the system. It’s not the best way to do so, and, instead, we should implement DllRegisterServerand DllUnregisterServerfunctions so that the clients may register and unregister our library with the regsvr32.exe tool. The code presented below is based on the sample from the great Windows 10 System Programming book by Pavel Yosifovich. Only in my version, I used WIL, and you may quickly see its usage benefits when you look at the original version (for example, no calls to CloseHandle and no error checks thanks to WIL result macros):
As you maybe noticed, I also added the registration of ProgIDs(Protoss.Nexus.1 and Protoss.Probe.1), which are human-friendly names for our COM classes. With these functions implemented, registering our COM classes is now a matter of calling regsvr32.exe protoss.dll from the administrator’s command line.
Updating the Protoss COM client
Thanks to the type library, we no longer need to explicitly generate and include the header files, but we may import the type library directly into the source code. The #import directive that we use for this purpose has several attributes controlling the representation of the type library in C++. For example, in the Protoss COM client, I’m using the raw_interfaces_only attribute as I want to work with the Protoss interfaces directly using the WIL com_ptr_t smart pointers. Our COM server uses IClassFactory, so we may call the CoCreateInstancefunction to create an instance of the Nexus class:
We can see that all class instances are eventually freed, so, hurray , we aren’t leaking any memory!
If you’d like to practice writing COM client code, you may implement a start_from_nexus function to output the same information, but create the Nexus class first. Don’t look at the client code in the repository, as this function is already there
C++ is not the only language to write a COM client. Let’s now implement the same logic in C#. I picked C# not without reason. .NET Runtime provides excellent support for working with native COM objects. Each COM class receives a Runtime Callable Wrapperthat makes the COM class look like any other .NET class. Now, you can imagine the number of magic layers to make it happen. So, there is no surprise that sometimes, you may need to wear a magical debugging hat to resolve a problem in COM interop But if you look at the code, it’s effortless:
using ProtossLib;

public static class Program
{
    static void ShowGameUnitData(IGameObject go)
    {
        Console.WriteLine($"Name: {go.Name}, minerals: {go.Minerals}, build time: {go.BuildTime}");
    }

    static void StartingFromProbe()
    {
        var probe = new Probe();
        ShowGameUnitData((IGameObject)probe);

        var nexus = probe.ConstructBuilding("Nexus");
        ShowGameUnitData((IGameObject)nexus);

        //_ = Marshal.ReleaseComObject(nexus);
        //_ = Marshal.ReleaseComObject(probe);
    }

    [STAThread]
    static void Main()
    {
        StartingFromProbe();

        // force release of the COM objects
        GC.Collect();
    }
}
If you decompile the ProtossLib.dll assembly, you will discover that Probe is, in fact, an interface with a CoClass attribute. And, although it does not implement IGameObject, we may cast it to IGameObject. Magical, isn’t it? Mixed-mode debugging helps a lot when debugging COM interop in .NET. For example, if you set a breakpoint on the QueryInterface method in the Probe class, you will discover that it i called when you cast the managed Probe instance to IGameObject.
Debugging COM in WinDbg
In this paragraph, I want to focus on debugging COM servers and clients in WinDbg. I will show you some commands, hoping they will be helpful also in your COM troubleshooting.
Let’s start with a breakpoint on the typical entry point for creating COM objects, i.e., the CoCreateInstancefunction (if the COM client does not use CoCreateInstance, you may set a breakpoint on the CoGetClassObject function):
Our goal is to print the function parameters (CLSID, IID, and the object address), so we know which object the client creates. If we have combase.dll private symbols, it’s a matter of calling the dv command. Otherwise, we need to rely on the dt command. For 32-bit, I usually create the CoCreateInstance breakpoint as follows:
I’m using bp /1 @$ra; g to break at the moment when the function returns. I didn’t want to use, for example, gu because one CoCreateInstance may call another CoCreateInstance, and one-time breakpoints are more reliable in such situations. An example 32-bit breakpoint hit might look as follows (notice that when we have private symbols, dps command nicely prints the GUIDs):
In the output, we can find CLSID (eff8970e-c50f-45e0-9284-291ce5a6f771), IID (246a22d5-cf02-44b2-bf09-aab95a34e0cf) and the created object address: 010ff620. Before we start examining it, we need to check the returned status code. We can do that with the !error @$retreg command (or look at the eax/rax register). If it’s 0 (S_OK), we may set breakpoints on the returned object methods. As each COM object implements at least one interface (virtual class), it will have at least one virtual method table. Thanks to the CoCreateInstance breakpoint, we know the queried IID, and we may find the interface method list in the associated type library. If we don’t have access to the type library (or our IID is IID_IUnknown), we still may learn something about this object by placing breakpoints on the IUnknown interface methods (as you remember, all COM interfaces need to implement it):
The breakpoint is very similar to what we did for CoCreateInstace. The code snippet below presents the 32- and 64-bit versions:
bp 031a6160 "dt ntdll!_GUID poi(@esp + 8); .printf /D \"==> obj addr: %p\", poi(@esp + C);.echo; bp /1 @$ra; g"

bp 00007ffe`1c751e6a "dt ntdll!_GUID @rdx; .printf /D \"==> obj addr: %p\", @r8;.echo; bp /1 @$ra; g"
Let me show you how I got the address of the QueryInterface function for the 32-bit breakpoint (031a6160). The first four bytes at the object address (009cfe3c) point to the virtual method table. We may find the vtable address by calling dpp 009cfe3c L1:
I knew that the IProbe interface (246A22D5-CF02-44B2-BF09-AAB95A34E0CF) has four methods (the first three coming from the IUnknown interface). Without this knowledge, I would have printed only the first three methods (QueryInterface, AddRef, and Release).
On each QueryInterface return, we may again examine the status code and returned object. The output below presents a QueryInterface hit for an IProbe instance. Let’s spend a moment analyzing it:
The 59644217-3e52-4202-ba49-f473590cc61a GUID represents the IGameObject interface. If you scroll up to the class definitions, you will find that it’s the second interface that the Probe class implements. The vtable at the object address looks as follows:
In the above output, we see that QueryInterface for IProbe (called by CoCreateInstance) sets the object pointer to the address 00e84ea0. While QueryInterface for IGameObject sets the object pointer to the address 00e84ea4 (four bytes further). And both calls were made on the same instance of the Probe class. Looking at the QueryInterface source code, we can see that this difference is caused by a static_cast:
The instruction *ppv = static_cast<IProbe*>(this) is here equivalent to *ppv = this, as IProbe is the default (first) interface of the Probe class, and a pointer to its vtable occupies the first four bytes of the Probe instance memory. IGameObject is the second interface and a pointer to its vtable occupies the next four bytes of the Probe instance memory. After these two vtables, we can find fields of the Probe class. I draw the diagram below to better visualize these concepts:
So, what are those adjustors in the IGameObject vtable? Adjustors allow the compiler to reuse the IUnknown methods already compiled for the IProbe implementation. The only problem with reusing is that methods implementing IProbe expect this to point to the beginning of the Probe class instance. So we can’t simply use their addresses in the IGameObject vtable – we need first to adjust the this pointer. And that’s what the sub dword ptr [esp+4],4 instruction is doing. Then, we can safely jump to the IProbe‘s QueryInterface implementation, and everything will work as expected.
To end the vtables discussion, I have one more WinDbg script for you:
This script sets breakpoints on the first N methods of a given vtable (replace N with any number you need). For example, to break on all the methods of the IGameObject interface, I would run:
We may also track COM objects from a specific DLL. When the application loads the target DLL, we need to set a breakpoint on the exported DllGetClassObjectfunction. For example, let’s debug what is happening when we call CoCreateInstance for the Probe COM object. We start by setting a break on the protoss.dll load:
0:000> sxe ld:protoss.dll
0:000> g
...
ModLoad: 66c90000 66cd4000   C:\temp\protoss-com-example\Debug\protoss.dll
Next, we set a breakpoint on the protoss!DllGetClassObject function and wait for it to hit:
We can see that CoCreateInstance uses the Probe class CLSID and asks for the IClassFactory instance. IClassFactory inherits from IUnknown (as all COM interfaces) and contains only two methods:
Our breakpoint gets hit, and we see that the requested IID equals IID_IProbe, which proves what I mentioned previously, that CoCreateInstance internally uses an IClassFactory instance to create a new Probe class instance.
Finally, when we deal with COM automation and need to decode parameters passed to the IDispatchinstance, we may use the dt -r1 combase!tagVARIANT ARG_ADDRESS command. It nicely formats all the VARIANTfields but requires the combase.dll symbols.
We reached the end of this long post, and I hope I haven’t bored you too much I also hope that the presented materials will help you better understand and troubleshoot COM APIs. The source code of the Protoss COM example is available at https://github.com/lowleveldesign/protoss-com-example.
I made several updates to my open-source tools in the last four weeks, and I also released one new tool. In this post, I will describe those updates briefly, including some discoveries I made along the way. dotnet-wtrace The biggest news is the release of dotnet-wtrace, a new tool in the wtrace toolkit. I created […]
Show full content
I made several updates to my open-source tools in the last four weeks, and I also released one new tool. In this post, I will describe those updates briefly, including some discoveries I made along the way.
dotnet-wtrace
The biggest news is the release of dotnet-wtrace, a new tool in the wtrace toolkit. I created it because I could not find a tool that would show the runtime (and not only) events in real-time. Dotnet-wtrace does not simply dump the events data but processes it to make the output easily readable. Below, you may see an example screenshot containing GC events from an ASP.NET Core application.
Besides GC events, dotnet-wtrace will display exceptions, loader, ASP.NET Core, EF Core, and network events. The documentation also describes its various filtering capabilities.
Dotnet-wtrace is entirely implemented in F# and relies on Microsoft.Diagnostics.NETCore.Client and Microsoft.Diagnostics.Tracing.TraceEvent libraries. I must admit I enjoy coding in F# greatly. F# might be a bit hard to grasp at first, especially if you’re new to functional programming, but the benefits of learning it are numerous. Keeping your variables immutable, avoiding nulls, and writing stateless code whenever possible will make your apps only safer. F# compiler won’t allow implicit conversions and will complain about all unhandled conditions. The list of benefits is much longer I also find F# syntax more concise and consistent than C# one. If I gained your interest and you want to experiment with F#, I recommend the Get Programming with F# book by Isaac Abraham – it helped me a lot in the beginning. Its content was more approachable than other materials available on the Internet. I deviated from the main subject of this post, so let’s get back to dotnet-wtrace. The features I miss most in the current version are call stacks for exceptions and summary statistics. I plan to add them in future tool releases, so please subscribe to the wtrace newsletter to be the first to try them
wtrace
I also made minor updates to wtrace , allowing it to trace image loader (issue #15) and UDP events. Additionally, I published a wtrace package to Chocolatey (issue #13), so if you’re using this package manager, you may install wtrace with this simple command: choco install wtrace.
procgov (Process Governor)
There were some significant changes in the procgov tool to implement the feature requested by ba-tno (btw., the issue description is excellent). It is now possible to update the process limits by rerunning procgov with new parameter values. When working on this feature, I discovered interesting behavior of the Windows job objects – with the last handle to the job object closed, the job disappears from the Object Manager (you can’t open it by name), but its limits still apply to the process. To overcome this problem, I’m now duplicating the created job handle in the target process to keep the job accessible.
I’ve planned to refactor the procgov codebase for some time already, and I finally found a moment to do that. Thanks to the CsWin32 project, I could remove lots of boilerplate PInvoke code. I was surprised by how smoothly the CsWin32 code generators worked in Visual Studio 2019. Interestingly, the code generators retrieve the signatures from the win32metadata assembly, generated with the help of the ClangSharp project. Some signatures are maybe a bit more complex to use than in my older manual setup, but I prefer to spend a minute longer writing the call instruction than 20 minutes on preparing the PInvoke signature. I also split the stateful, hard-to-maintain ProcessGovernor class into two static (stateless) types: ProcessModule and Win32JobModule, which use a shared SessionSettings object (lesson learned from functional programming :)). The code is now easier to understand and modify.
It should also be soon possible to install procgov with Chocolatey. Its package is awaiting approval. Moreover, I moved the procgov build from Azure Devops to GitHub Actions and added steps to keep the Chocolatey package in sync with the main repo.
I hope you’ll find the new features and tools helpful, and if you have any ideas for improvements, let me know or create an issue in the tool repository. Thank you.
Last week we published the final module of the .NET Diagnostics Expert Course: I’m excited and happy that it’s finally available. But I’m also relieved as there were times when I thought it would never happen 🙂 In this post, I want to share some details about the course and why I decided to make […]
I’m excited and happy that it’s finally available. But I’m also relieved as there were times when I thought it would never happen In this post, I want to share some details about the course and why I decided to make it.
How it all started
It was my plan for a long time to publish a course on .NET diagnostics. However, I have never found enough time to focus on it, and apart from handling a few free training sessions for the devWarsztaty initiative, I hadn’t made much progress in realizing it. So what changed last year? Firstly, in late summer, I decided to leave Turbo.net and focus on learning and my private projects, most importantly wtrace. I finally published https://wtrace.net and started working on a new wtrace release and other tracing tools. Three weeks passed, and while talking with Szymon, the idea of a .NET diagnostics course emerged. I thought that the timing would never be better, so I drafted the course plan, and Konrad published the https://diagnosticsexpert.com site. Then I prepared two webinars, and Dotnetos started the presale of the course at the beginning of December. I was under stress that the interest would be low and not many people will find the subject interesting. The presale, however, went very well (thank you all who put trust in me!), giving me some relief.
Making-of
And then the recordings started. At first, I tried recording the lessons as I was presenting the slides. It did not work very well, and every lesson took me hours to complete. My wife took pity on me and browsed tutorials for starting YouTubers to find that they often use transcripts. And thus, I began writing transcripts That made the lesson preparation longer, but the recording time was much more manageable. Unfortunately, transcripts did not work for DEMOs, so they still required hours in front of the microphone. Another problem with DEMOs is that they are not always entirely predictable. Sometimes, during the DEMO, I received an output I haven’t thought of or, even worse, discovered a bug in the diagnostics tool. Once I had raw materials ready, Konrad and Paulina reviewed them, and Andrzej processed the videos. Konrad then watched the final recordings, making sure they do not contain any repetitions or other issues.
There were various problems I hit along the way. In the first month, my camera broke. And, as I didn’t want to lose any time, I created a temporary solution:
The positive side of it is that you may see that the course has solid fundaments! I also spilled tea on my laptop (thankfully, it survived after drying) and corrupted my drive when testing diskspd (entirely my fault – I shouldn’t be doing it after midnight). Fortunately, the backup worked.
What’s in the course
Having covered the course making, let me describe to you the course content. When preparing the lessons, I focused on practicality, presenting techniques and tools which you may employ to diagnose various .NET (and not only) problems. There are 11 modules in the course:
Module 1, “Debugging,” describes the building blocks of a debugger, symbol files management, and features of Debuggers, both managed (VS, VS Code) and native (WinDbg, LLDB)
Module 2, “Tracing,” focuses on Event Tracing for Windows, Linux tracing APIs (perf, LTTng, eBPF), and .NET Event Pipes
Module 3, “Windows and Linux diagnostic sources,” covers various applications to monitor processes on Windows and Linux (including ps, top, htop, Process Hacker)
Module 4, “High CPU usage,” describes ways of troubleshooting CPU-related issues, including CPU sampling, thread time (clock time) profiling, and .NET Profiling API
Module 5, “Deadlocks,” covers techniques for troubleshooting deadlocks and waits using memory dumps and trace-based wait analysis
Module 6, “Network issues – TCP, UDP,” concentrates on monitoring TCP and UDP connections and troubleshooting various connectivity issues (including slow server responses, dropped connections, or intermittent network errors). Apart from typical network tracing tools such as Wireshark or tcpdump, we also use .NET network traces.
Module 7, “Network issues – DNS, HTTP(S),” is about troubleshooting issues in higher layer protocols: DNS, HTTP, and TLS. Apart from system tools, I also cover ASP.NET Core and Kestrel logs. In this module, we also implement and use various network proxies to intercept and modify the traffic.
Module 8, “Application execution issues,” targets assembly loading issues, exceptions, and production debugging techniques (including system image preparations, automatic dump collection, and remote debugging)
Module 9, “Miscellaneous issues,” describes diagnosing memory, File I/O, and some other issues. It also lists final tips and tricks for troubleshooters.
Module 10, “Diagnostics logs in the application,” shows ways of how we can interact with the debugger from within the application and how we may publish custom performance traces.
Module 11, “Writing custom diagnostics tools,” covers usage of ClrMD, Diagnostics Client, and TraceEvent libraries to write our custom diagnostics tools.
As you maybe noticed, the first three modules present general concepts and tools, while the subsequent six modules focus on various diagnostics cases. Finally, the last two modules are about implementing code for diagnosing purposes. Each module ends with homework exercises. I wanted them to be challenging and resemble problems I observed in the production. And, as it’s a practical course, I spent a lot of time in DEMOs.
Although the course concentrates on .NET, many presented techniques could be employed to troubleshoot native applications or even system problems. I also believe that debugging, tracing, and reading source code (if it’s available, of course) are the best ways to learn how libraries and applications function.
Final words
In the end, I would like to thank Dotnetos, in particular, Konrad, for the endless hours he spent reviewing the videos and slides. It was a huge and challenging project that occupied me for the last six months (two months more than initially anticipated :)). But I’m happy with the final result, and I hope that those who decide to participate in it will enjoy the prepared materials.
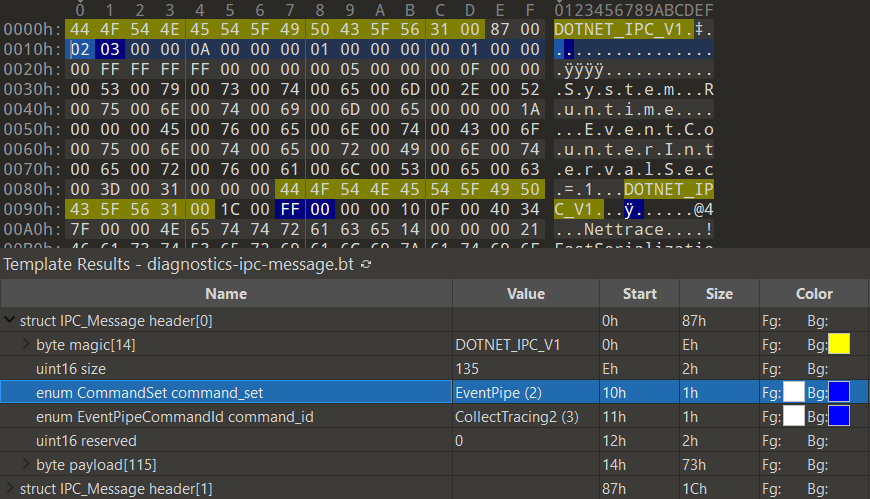
While playing with EventPipes, I wanted to better understand the Diagnostic IPC Protocol. This protocol is used to transfer diagnostic data between the .NET runtime and a diagnostic client, such as, for example, dotnet-trace. When a .NET process starts, the runtime creates the diagnostic endpoint. On Windows, the endpoint is a named pipe, and on […]
Show full content
While playing with EventPipes, I wanted to better understand the Diagnostic IPC Protocol. This protocol is used to transfer diagnostic data between the .NET runtime and a diagnostic client, such as, for example, dotnet-trace. When a .NET process starts, the runtime creates the diagnostic endpoint. On Windows, the endpoint is a named pipe, and on Unix, it’s a Unix domain socket created in the temp files folder. The endpoint name begins with a ‘dotnet-diagnostic-’ string and then contains the process ID to make it unique. The name also includes a timestamp and a ‘-socket’ suffix on Unix. Valid example names are dotnet-diagnostic-2675 on Windows and dotnet-diagnostic-2675-2489049-socket on Unix. When you type the ps subcommand in any of the CLI diagnostics tools (for example, dotnet-counters ps), the tool internally lists the endpoints matching the pattern I just described. So, essentially, the following commands are a good approximation to this logic:
# Linux
$ ls /tmp/dotnet-diagnostic-*
/tmp/dotnet-diagnostic-213-11057-socket /tmp/dotnet-diagnostic-2675-2489049-socket
# Windows
PS me> [System.IO.Directory]::GetFiles("\\.\pipe\", "dotnet-diagnostic-*")
\\.\pipe\dotnet-diagnostic-9272
\\.\pipe\dotnet-diagnostic-13372
The code for the .NET process listing is in the ProcessStatus.cs file. After extracting the process ID from the endpoint name, the diagnostics tool creates a Process class instance to retrieve the process name for printing. Armed with this knowledge, let’s try to intercept the communication between the tracer and the tracee.
Neither named pipes nor Unix domain sockets provide an API to do that easily. I started looking for the interceptors for either the kernel or user mode. I found a few interesting projects (for example, NpEtw), but I also discovered that configuring them would take me lots of time. I then stumbled upon a post using socat to proxy the Unix domain socket traffic. I wondered if I could write a proxy too.
Writing an EventPipes sniffer
The only problem was how to convince the .NET CLI tools to use my proxy. I did some tests, and on Linux, it’s enough to create a Unix domain socket with the same process ID but with the timestamp set to, for example, 1.
Let’s take as an example a .NET process with ID equal to 2675. Its diagnostic endpoint is represented by the /tmp/dotnet-diagnostic-2675-2489049-socket file. In my proxy, I am creating a Unix domain socket with a path /tmp/dotnet-diagnostic-2675-1-socket. The file system will list it first, and dotnet-trace (or any other tool) will pick it up as the endpoint for the process with ID 2675:
The code to create the proxy socket looks as follows:
private static async Task StartProxyUnix(int pid, CancellationToken ct)
{
    var tmp = Path.GetTempPath();
    var snoopedEndpointPath = Directory.GetFiles(tmp, $"dotnet-diagnostic-{pid}-*-socket").First();
    var snoopingEndpointPath = Path.Combine(tmp, $"dotnet-diagnostic-{pid}-1-socket");

    File.Delete(snoopingEndpointPath);

    var endpoint = new UnixDomainSocketEndPoint(snoopingEndpointPath);
    using var listenSocket = new Socket(endpoint.AddressFamily, SocketType.Stream, ProtocolType.Unspecified);
    listenSocket.Bind(endpoint);

    using var r = ct.Register(() => listenSocket.Close());

    try
    {
        var id = 1;
        while (!ct.IsCancellationRequested)
        {
            listenSocket.Listen();

            if (ct.IsCancellationRequested)
            {
                return;
            }

            var socket = await listenSocket.AcceptAsync();
            Console.WriteLine($"[{id}]: s1 connected");

            // random remote socket
            var senderSocket = new Socket(AddressFamily.Unix, SocketType.Stream, ProtocolType.Unspecified);
            await senderSocket.ConnectAsync(new UnixDomainSocketEndPoint(snoopedEndpointPath));
            Console.WriteLine($"[{id}]: s2 connected");

            _ = SniffData(new NetworkStream(socket, true), new NetworkStream(senderSocket, true), id, ct);
            id += 1;
        }
    }
    catch (SocketException)
    {
        /* cancelled listen */
        Console.WriteLine($"Stopped ({snoopingEndpointPath})");
    }
    finally
    {
        File.Delete(snoopingEndpointPath);
    }
}
On Windows, it’s more complicated as there is no timestamp in the name. Thus, I decided to create a fake diagnostics endpoint that will look like an endpoint for a regular .NET process but, in reality, will be a proxy. Remember that CLI tools also call the Process.GetProcessById method, so the PID in my endpoint name must point to a valid process accessible to the current user. The process must be native, so the diagnostic endpoint name is not already taken. I picked explorer.exe , and to record EventPipes traffic, I will use explorer as the target process in .NET CLI tools, as on the image below:
And the code for creating my proxy named pipe looks as follows:
private static async Task StartProxyWindows(int pid, CancellationToken ct)
{
    var targetPipeName = $"dotnet-diagnostic-{pid}";
    var explorer = Process.GetProcessesByName("explorer").First();
    var pipeName = $"dotnet-diagnostic-{explorer.Id}";
    try
    {
        var id = 1;
        while (!ct.IsCancellationRequested)
        {
            var listener = new NamedPipeServerStream(pipeName, PipeDirection.InOut, 10, PipeTransmissionMode.Byte,
                                    PipeOptions.Asynchronous, 0, 0);
            await listener.WaitForConnectionAsync(ct);
            Console.WriteLine($"[{id}]: s1 connected");

            if (ct.IsCancellationRequested)
            {
                return;
            }
            var sender = new NamedPipeClientStream(".", targetPipeName, PipeDirection.InOut, PipeOptions.Asynchronous);
            await sender.ConnectAsync();
            Console.WriteLine($"[{id}]: s2 connected");

            _ = SniffData(listener, sender, id, ct);
            id += 1;
        }
    }
    catch (TaskCanceledException)
    {
        Console.WriteLine($"Stopped ({pipeName})");
    }
}
The fake diagnostic endpoint would work on Linux too, but the timestamp is less confusing. And we can always use our proxy to send some funny trace messages to our colleagues .
What’s left in our implementation is the forwarding code:
static async Task Main(string[] args)
{
    if (args.Length != 1 || !int.TryParse(args[0], out var pid))
    {
        Console.WriteLine("Usage: epsnoop <pid>");
        return;
    }

    using var cts = new CancellationTokenSource();

    Console.CancelKeyPress += (o, ev) => { ev.Cancel = true; cts.Cancel(); };

    if (RuntimeInformation.IsOSPlatform(OSPlatform.Windows))
    {
        await StartProxyWindows(pid, cts.Token);
    }
    else
    {
        await StartProxyUnix(pid, cts.Token);
    }
}

private static async Task SniffData(Stream s1, Stream s2, int id, CancellationToken ct)
{
    var outstream = File.Create($"eventpipes.{id}.data");
    try
    {
        using var cts = CancellationTokenSource.CreateLinkedTokenSource(ct);
        var tasks = new List<Task>() {
            Forward(s1, s2, outstream, $"{id}: s1 -> s2", cts.Token),
            Forward(s2, s1, outstream, $"{id}: s2 -> s1", cts.Token)
        };

        var t = await Task.WhenAny(tasks);

        var ind = tasks.IndexOf(t);
        Console.WriteLine($"[{id}]: s{ind + 1} disconnected");
        tasks.RemoveAt(ind);

        cts.Cancel();

        await Task.WhenAny(tasks);
        Console.WriteLine($"[{id}]: s{1 - ind + 1} disconnected");
    }
    catch (TaskCanceledException) { }
    finally
    {
        outstream.Close();
        s1.Dispose();
        s2.Dispose();
    }
}

private static async Task Forward(Stream sin, Stream sout, Stream snoop, string id, CancellationToken ct)
{
    var buffer = new byte[1024];
    while (true)
    {
        var read = await sin.ReadAsync(buffer, 0, buffer.Length, ct);
        if (read == 0)
        {
            break;
        }
        Console.WriteLine($"[{id}] read: {read}");
        snoop.Write(buffer, 0, read);
        await sout.WriteAsync(buffer, 0, read, ct);
    }
}
I’m saving the recorded traffic to the eventpipes.{stream-id}.data file in the current directory. The code of the application is also in the epsnoop folder in my diagnostics-tools repository.
Analyzing the EventPipes traffic
I also started working on the 010 Editor template. At the moment, it only understands IPC messages, but, later, I would like to add parsers for some of the diagnostic sequences as well (feel free to create a PR if you work on them too!). The template is in the blog samples repository, and on a screenshot below, you can see the initial bytes sent by the dotnet-counters monitor command:


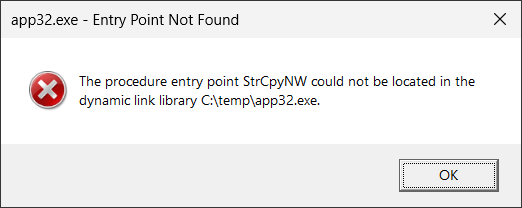


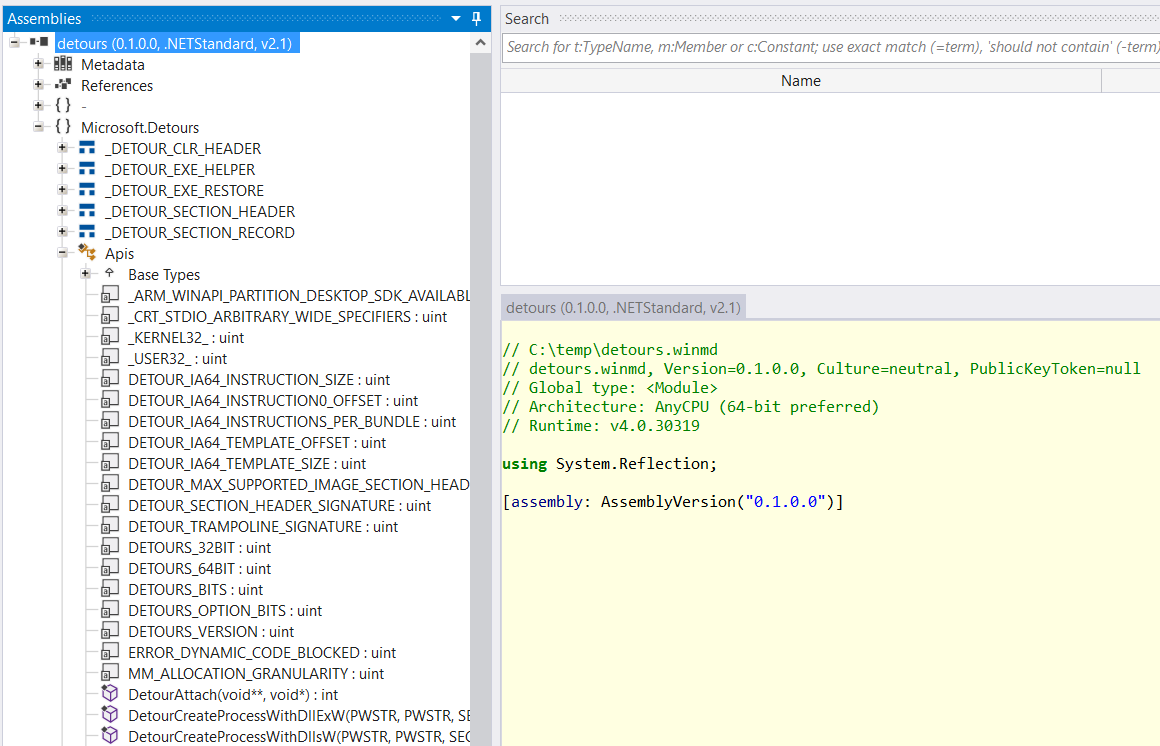


 I don’t want to convince you to use COM as the backbone for your new applications. Instead, I want to show you how you may approach and use COM APIs if you need to work with them. We will also do some COM debugging in WinDbg. Additionally, I plan to release a new COM troubleshooting tool as part of the
  , we aren’t leaking any memory!
 But if you look at the code, it’s effortless:
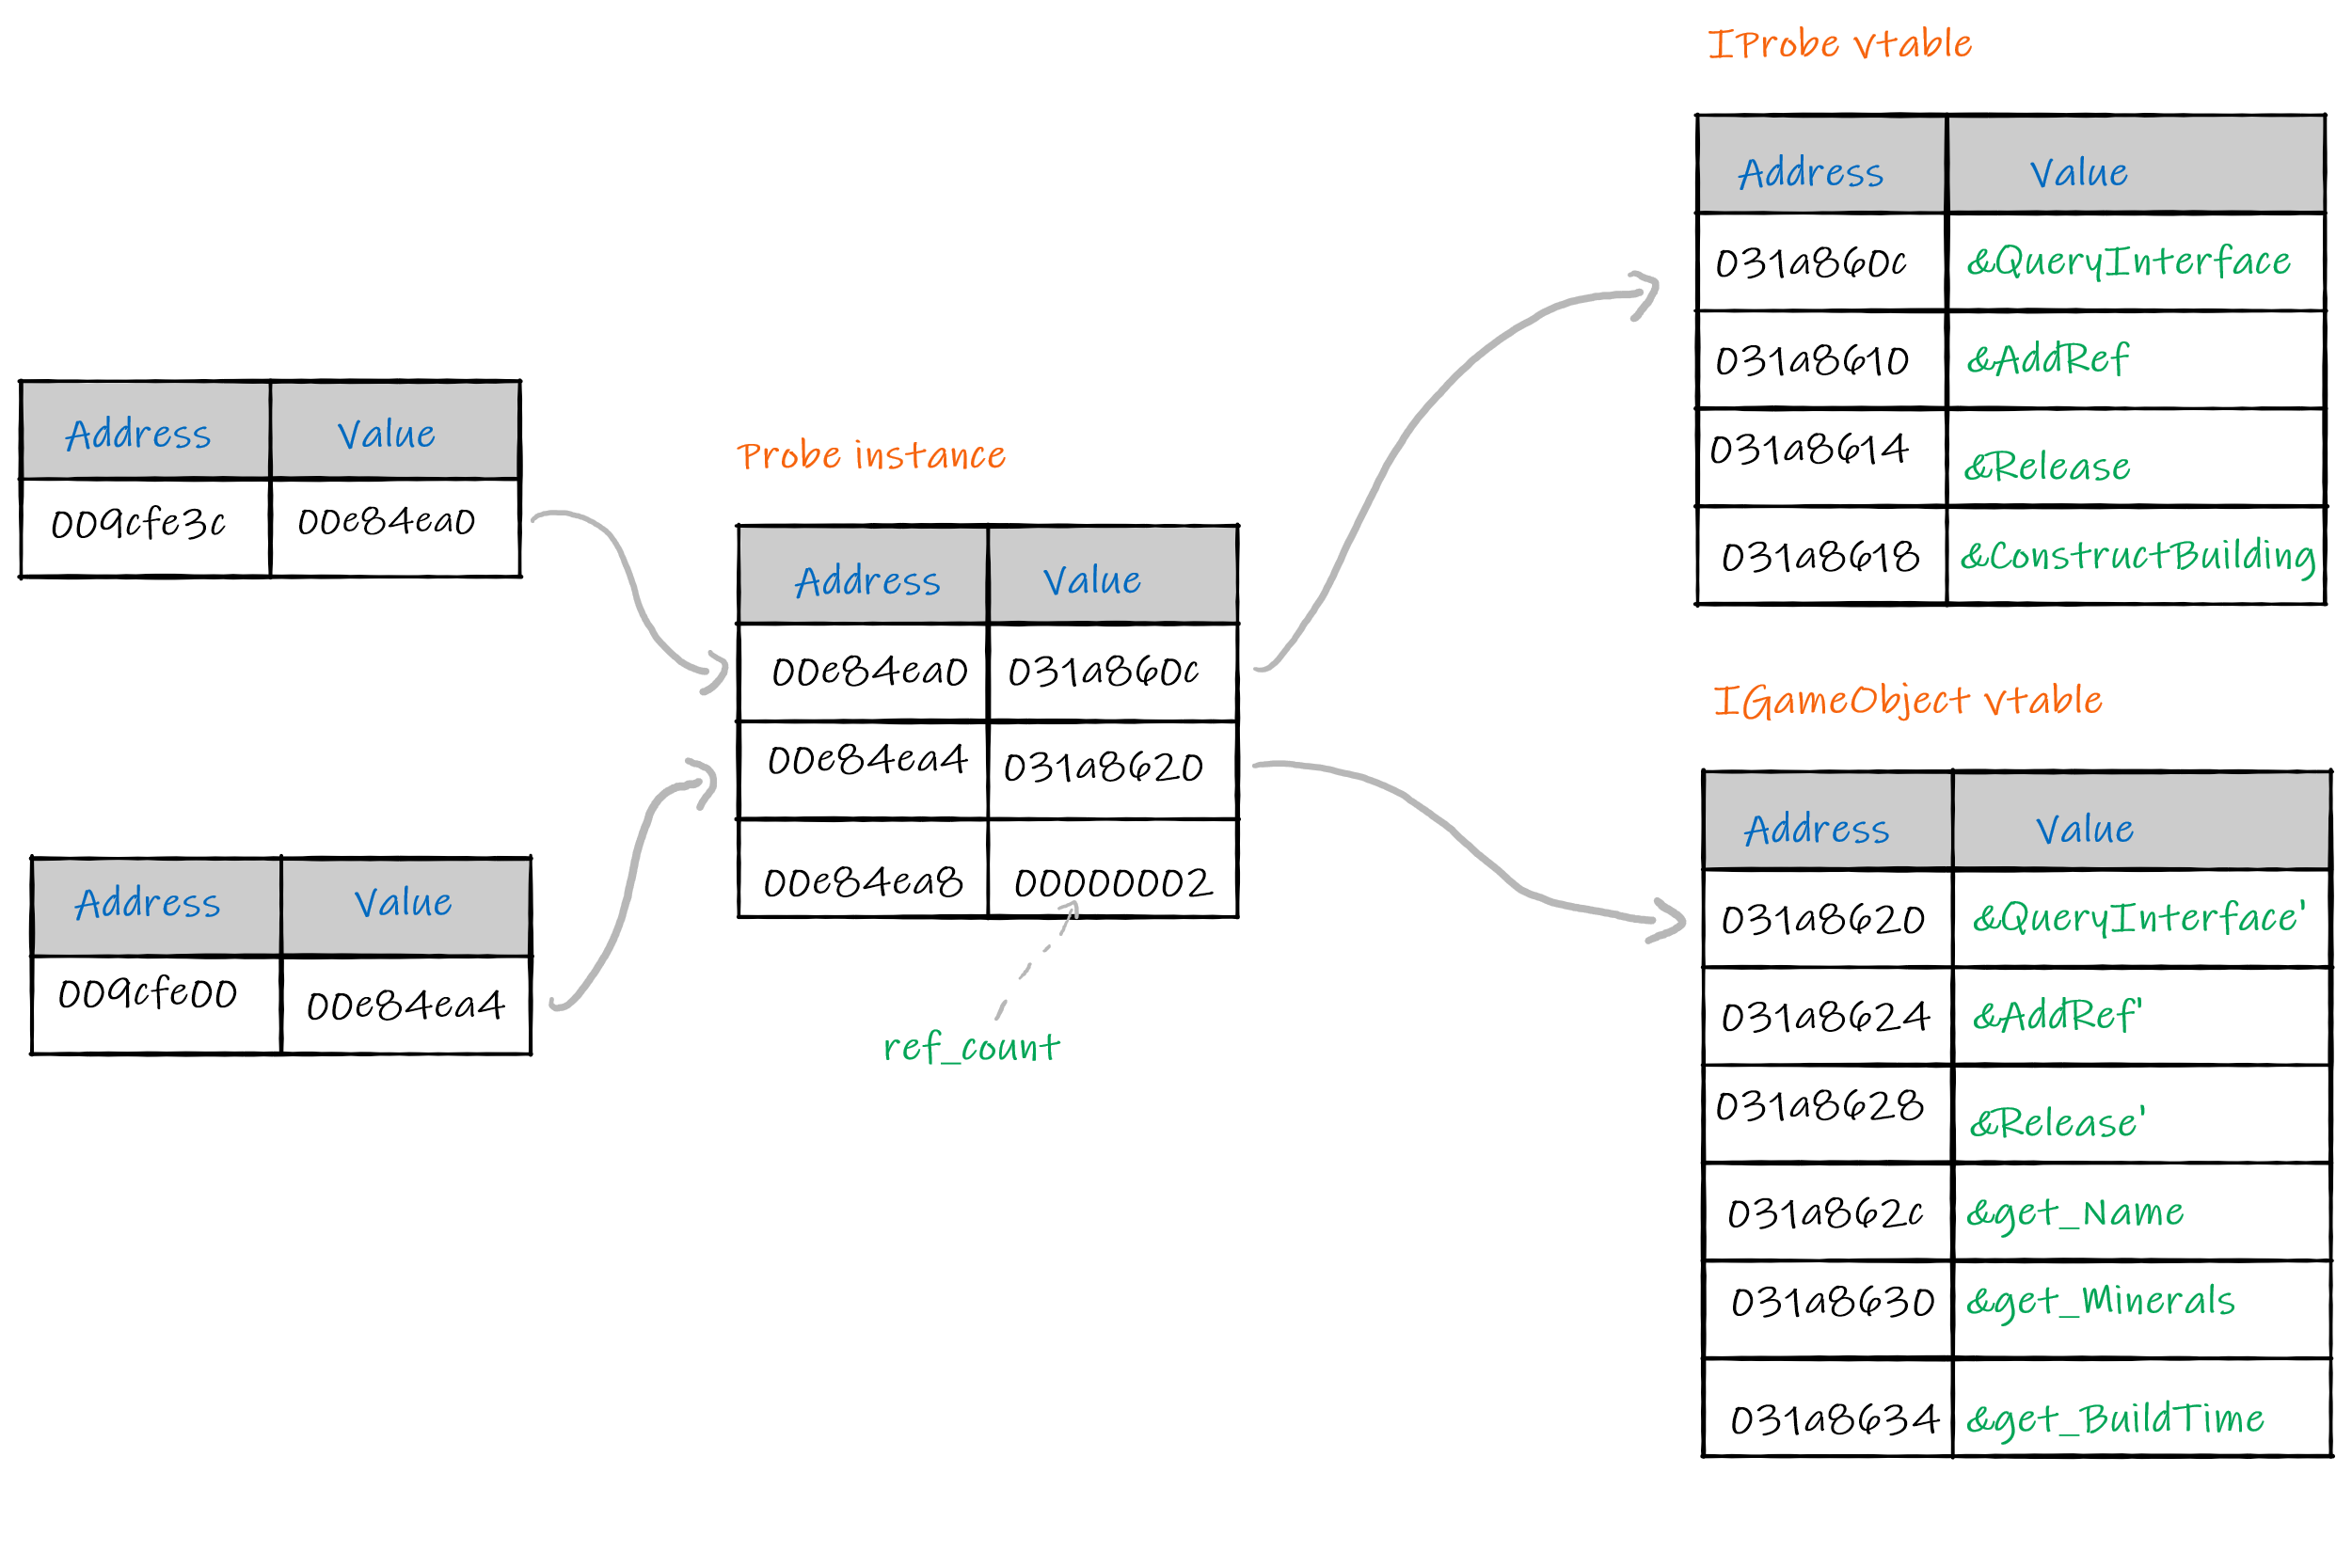


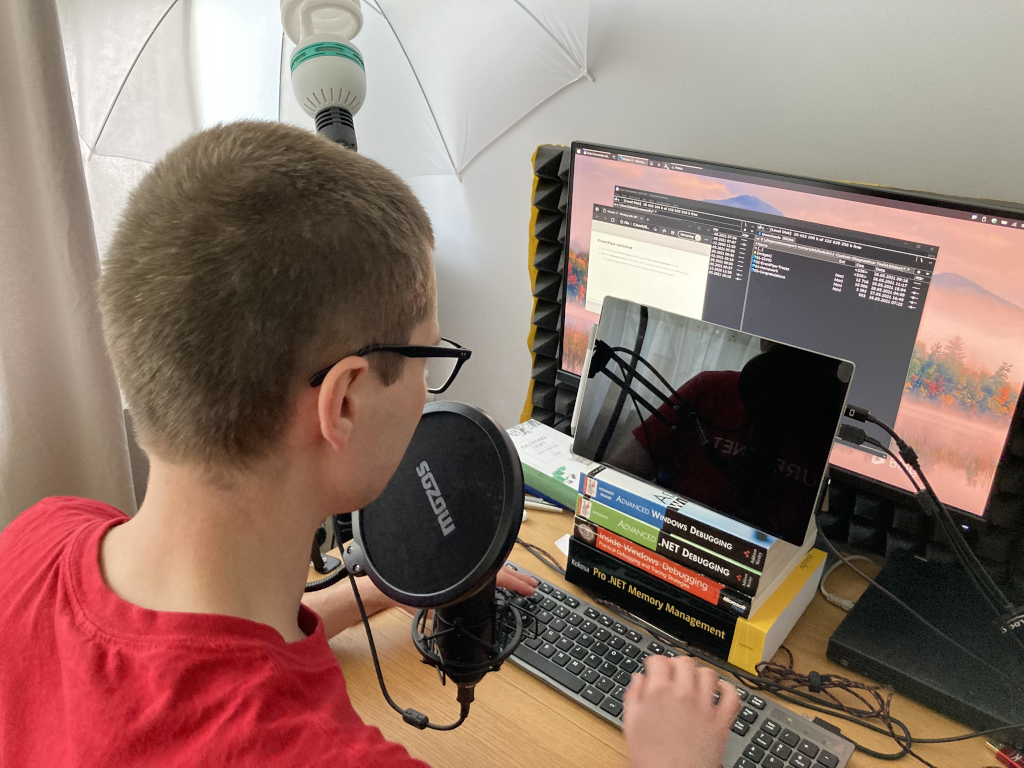


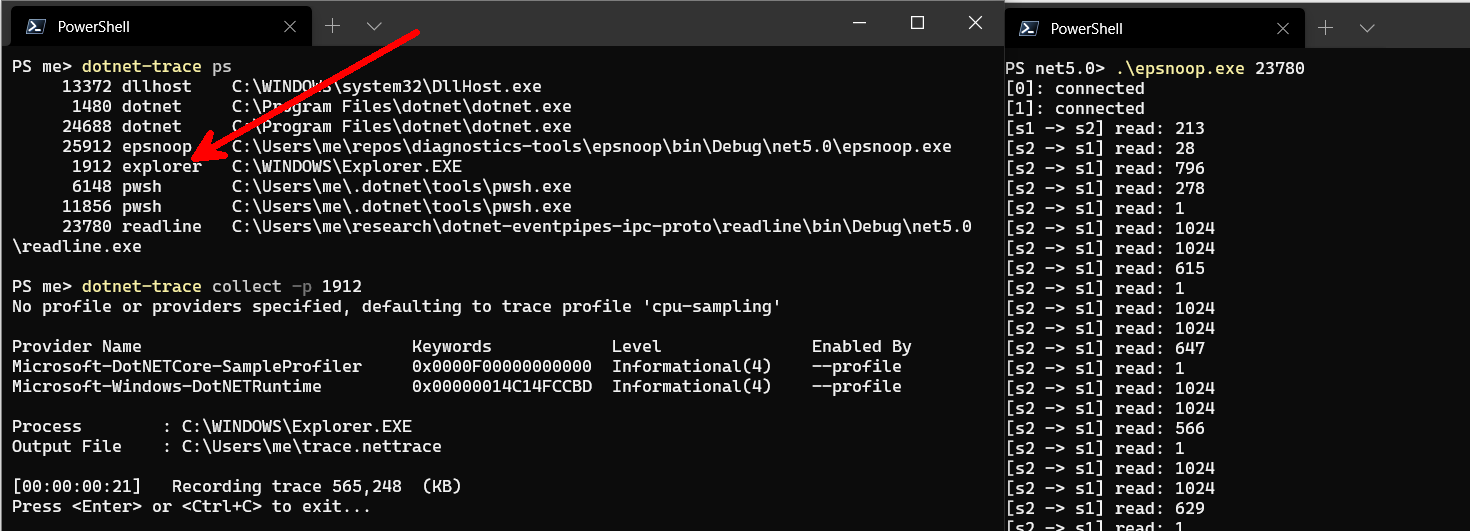
 .
.