Show full content
Written in my personal capacity. Thanks to many people for conversations and comments. Written in less than 24 hours; sorry for any sloppiness.
[Link to donate here — please use this link rather than going to his website — but please read at least the first few paragraphs!]
It’s an uncanny, weird coincidence that the two biggest legislative champions for AI safety in the entire country announced their bids for Congress just two days apart. But here we are.
On Monday, I put out a long blog post making the case for donating to Alex Bores, author of the New York RAISE Act. And today I’m doing the exact same thing for Scott Wiener, who announced a run for Congress in California today (October 22).
Much like with Alex Bores, if you’re potentially interested in donating to Wiener, my suggestion would be to:
- Read this post to understand the case for donating to Scott Wiener.
- Understand that political donations are a matter of public record, and that this may have career implications. Decide if you are willing to donate to Scott Wiener anyway.
- If you’ve already donated to Bores, I think there isn’t much cause for concern, with one exception. If you have the sort of federal policy role where donating against an incumbent might hurt your career, or think there’s a good chance that you will be in such a role in the near future, consider waiting to donate until Nancy Pelosi, the incumbent, announces retirement.
- If you would like to donate to Scott Wiener, you can donate at this link. (Please use this link, rather than going to Wiener’s website to donate – that lets him know that the donation is from someone who cares about AI safety!)
To state my bottom line up front, I think that:
- Marginal donations to Alex Bores still look a bit better than donating to Wiener. If you haven’t yet maxed out to Bores, my recommendation is to do that first.
- If you have maxed out to Bores, and you are not working in a policy role where donating against an incumbent might hurt your career (and won’t be in the near future), my recommendation would be to donate now (Wednesday, October 22nd) to Wiener.
- However, if you disagree with my modeling assumptions, you might decide that it makes sense to instead wait and only donate if Nancy Pelosi retires. Edit 11/6: Nancy Pelosi has announced her retirement, so this is no longer a relevant consideration. Donations that come sooner are now more or less straightforwardly better.
[Edit 10/31: at this point, I think donations to Wiener are almost as effective as donations to Bores, and will be roughly as effective if/when Pelosi decides to retire!]
Just two days later…AI safety champion Alex Bores announced on Monday that he’s running for Congress. In my blog post about Alex Bores, I wrote:
I expect that big opportunities that are as exciting as this one will come up very rarely (maybe once every couple of years). One comparison point: it has been reported that Scott Wiener will run for Congress. I’m super excited about this, and think that we’ll only get big donation opportunities this good once a year or so. Nevertheless, I think that donating to Bores looks a little better, mostly because it’s clearer to me that Bores will continue to prioritize AI safety.6
Where footnote 6 read:
[6]: Note that I wrote a version of this paragraph before I found out that Scott Wiener might run! So I don’t think I’m biased by the recency of this news; I think that, by coincidence, we’ll be getting two amazing donation opportunities only a few days/weeks apart.
Well, today, October 22nd, Scott Wiener announced that he is also running for Congress. As I indicated above, I think this is a really good donation opportunity. In this doc, I will lay out the case for donating to Scott Wiener.
My current bottom line: my current estimate is that donating to Wiener on Wednesday, October 22, looks 75% as good as donating to Bores on his launch day. This is better than any other donation opportunities that I’m aware of, and is likely to be better than any big donation opportunities that I’ll become aware of in the next several months. I have donated $7,000 (the legal maximum) to Wiener.
(While there are considerations cutting in both directions, the main reason that donating to Wiener looks worse than donating to Bores is because Wiener is challenging Nancy Pelosi, and it’s not clear whether she’ll retire. If she doesn’t, it’s unlikely that Wiener will win.)
(Worried that I’m underestimating the frequency of such opportunities, and that I’ll keep asking for money? Here’s a section on that.)
IntroductionScott Wiener represents San Francisco in the California legislature and has been an AI safety champion. He sponsored and fought really hard for SB 1047, which is my all-time favorite piece of AI safety legislation today (even better than the RAISE Act). Gov. Newsom vetoed the bill (in large part due to opposition from big tech), but it got really close: it passed the legislature, and my sense is that vetoing the bill was a pretty close call for Newsom.
(There’s debate on whether the second-order effects of SB 1047 were net-positive. Some argue that the second-order effects were net-negative because it galvanized opposition to AI safety legislation from big tech. Others argue that the second-order effects were net-positive because the provisions of the bill survived as ideas for public policy and shaped efforts like the RAISE Act in New York. I lean toward the second camp, but I’m not sure.)
This year, Wiener sponsored and fought for SB 53, a whistleblower protection and transparency bill that passed the legislature and was signed into law by Gov. Newsom last month. I’m a big fan of this bill, even though I don’t think it goes far enough.
Today, Scott Wiener announced that he’s running for Congress. I believe that donating to his campaign is a really good use of philanthropic dollars to mitigate AI x-risk. My blog post on Alex Bores is a good starting point for thinking about donations to Scott Wiener. However, there are some important differences to keep in mind (more here).
(If you’re already convinced to donate to Scott Wiener, you can donate here (and thank you so much!). My donation suggestion is $7,000 (the maximum), if you can afford it. But note: if you didn’t donate to Alex Bores, then before deciding to donate, please be aware that political donations are a matter of public record! If you’re potentially interested in working in the federal government, this could have career implications for you. See this post for more discussion. Additionally, if you are or soon will be a federal lobbyist or similar, consider waiting to donate until Pelosi retires. If you’re not sure whether this applies to you, feel free to reach out and I’ll try to connect you with an expert.)
Things I like about Scott Wiener A champion of AI safetyThe main thing I like about Scott Wiener is that he has been a really dedicated AI safety champion in the California legislature. This started with SB 1047, an AI safety bill that would have applied only to companies that train models with >$100 million training runs, and which would have instituted the following rules for those companies:
- Whistleblower protections for employees.
- Companies must “create a reasonable safety and security plan (SSP) such that their model does not pose an unreasonable riskof causing or materially enabling critical harm: mass casualties or incidents causing $500 million or more in damages.”
- The bill required the SSPs to be concrete, and to “include objective evaluation criteria for determining compliance.”
- Companies “must adhere to their own SSP and publish the results of their safety tests.”
- Companies must be able to shut down any models under their control, if necessary.
- Companies that violate these rules and cause critical harm (as defined above) would be held liable for the harm.
(All quotes are from Zvi’s summary of the bill.)
I think that this bill was really good: very well-crafted to be as light-touch as possible while still trying to mitigate the most catastrophic harms from advanced AI.
Unfortunately, the bill generated a huge amount of opposition from big tech. Under these circumstances, lawmakers usually back down, because they don’t care enough about the bill that they would spend their political capital on passing it and make powerful enemies along the way. But that did not deter Wiener, who fought really hard for the bill, revising it repeatedly to try to appeal to as broad a coalition as possible while still retaining the most important parts. In the end, the bill passed the state legislature, although it was vetoed by Gov. Newsom.
Having talked to the AI safety advocates working with Wiener, passing this bill through the legislature was an exhausting ordeal for Wiener and his staff. He was constantly bombarded with personal attacks on Twitter, and made powerful enemies in big tech.
Not to be deterred, the very next year, Wiener introduced SB 53, an AI whistleblower protection and transparency bill. The bill essentially did a subset of what SB 1047 did, but was crafted to strike a balance between helping ensure that advanced AIs are built safely and having a good chance of being signed by Gov. Newsom. Essentially, the bill:
- Institutes whistleblower protections for AI company employees (the least controversial part of SB 1047).
- Requires companies to publish a “frontier AI framework” describing the measures that the company is taking to mitigate catastrophic risks.
- Requires companies to publish “model cards” summarizing how likely their models are to cause catastrophic risks.
- Report “critical safety incidents” to the government of California.
- Not say anything false about catastrophic risk from its frontier models.
In summary, SB 53 is a transparency bill: companies won’t face consequences unless they lie. And while I think this bill doesn’t go far enough, I think it’s a great bill, and it says a lot about Wiener that he was willing to push for another AI safety bill in spite of the personal nightmare he endured when trying to pass SB 1047.
Further, my understanding from talking to AI safety advocates who worked closely with Wiener on the bill is that Wiener wasn’t just pushing a bill that was written and handed to him by AI safety advocates. Instead, he really understood the technical details of the bill and was key to crafting the bill.
Abundance“Abundance” is a recently-coined term referring to the pro-growth wing of the Democratic Party. In a nutshell, abundance prioritizes solving issues that stem from scarcity. This includes things like:
- Building a lot more housing.
- Investing a bunch in the development of clean energy technology.
- Generally being careful not to place overly burdensome regulations on industries.
I think abundance is pretty great, and Wiener has been one of the foremost champions of the abundance cause. The most recent example of this is SB 79, which makes it much easier to build housing near public transit. I’m not an expert here, but I’ve gathered from the discussion on Twitter that this is a really big deal for increasing the housing supply.
I’m not sure, but my guess is that if you asked advocates for the abundance agenda who their favorite state legislator in the entire country was, the most common answer would be Scott Wiener.
EffectivenessScott Wiener keeps passing important bill after important bill. I’m not sure whether he is literally the most effective current state legislator in the entire United States, but I don’t know who else it could be. When I ask ChatGPT who the most effective state legislator in the United States is, it refuses to answer; but at least when I ask it who the most effective state legislator in California is, it says Scott Wiener.
In other words: I’m not an expert, but I follow politics reasonably closely. And as far as I know, it is literally true that among the 8,000 state legislators in the United States, Scott Wiener is the most effective one at counterfactually passing important bills. (A couple of policy people I talked to agreed with this assessment.)
What are the differences between Scott Wiener and Alex Bores?In this section, I’ll presume familiarity with the case for donating to Alex Bores as laid out in my blog post, and talk about the main ways that Scott Wiener’s situation is different.
The state of the raceIn this subsection, I’ll talk about differences between the state of Bores’ race and the state of Wiener’s race.
The donkey in the room: Nancy PelosiAlex Bores is running for an open seat: Rep. Jerry Nadler retired, and there is a race to replace him. By contrast, Scott Wiener is running against former House Speaker Nancy Pelosi, an extremely powerful member of Congress. So why is he running, and does he stand a chance?
Nancy Pelosi may decide to retire: according to Politico, Pelosi “hasn’t said if she plans to run for another term in 2026.” My current guess is that Pelosi is 60% likely to retire, but this guess is based on very little information (and I’m not sure anyone besides her inner circle has more information). (There are some relevant Kalshi markets; see footnote.1)
Note: unfortunately, my cost-effectiveness analysis is pretty sensitive to this 60% number. This number is not resilient: I did my best to make a guess by thinking about it on my own, talking to people, etc. But I am kind of flying blind when it comes to this number.
If Pelosi doesn’t retire, I think that Wiener is quite unlikely to win. I wouldn’t completely rule it out: Pelosi is very old (will be 86 in 2026), and voters are feeling kinda burned by Dianne Feinstein and Joe Biden. According to SF Standard, a recent poll showed that 51% of SF voters prefer someone else to Nancy Pelosi (though I think the poll hasn’t been publicly released, so take this with a grain of salt). And in 2020, a far-left, no-name challenger to Pelosi with a sexual harassment scandal got 22% of the vote against Pelosi (back when she was merely 80).2
After chatting with a couple of people whose opinions on this I trust, I think that Wiener would have a 10% chance of winning against Pelosi.
Why didn’t he wait until Pelosi retires? Does it make sense to donate now, or only once she retires? More on that below.
Pelosi on AI safetyNancy Pelosi urged Gov. Newsom to veto SB 1047, which may have sunk the bill. (See this Manifold market, where the probability that SB 1047 would get signed dropped from 50% to 35% on this news.)
Some people have asked me what I think about AI safety advocates backing Wiener before Pelosi announces her retirement, in terms of effects on Congressional advocacy in the coming year. My guess is that these effects will be small, especially because Wiener will have many communities strongly backing him, but I’m open to changing my mind on this.
Who else is running?At least for now, besides Pelosi, Wiener’s main opponent would be Saikat Chakrabarti. The two main things to know about Chakrabarti is that (1) he’s a left-wing activist and AOC protégé, and (2) he’s very rich (“holds at least $50 million in Stripe equity”, apparently) and plans to mostly self-fund his campaign.
SF is a pretty left-wing place, and I think that Chakrabarti is a formidable opponent. If Pelosi retires, I’d slightly favor Wiener over Chakrabarti, because he has represented SF for many years. But I think that it would be a close race.
There are also rumors that Christine Pelosi, Nancy Pelosi’s daughter, may run. I think that her main advantage would be having the support of Nancy Pelosi; however, I ultimately think that this won’t be enough for her to win. I would be surprised if she wins the race.
There will be other candidates as well – for example, I expect there to be a candidate backed by big tech if Pelosi retires – but I’m not aware of anyone in particular who’s worth noting.
Edited to add: it’s also worth keeping an eye on San Francisco Supervisor Connie Chan. If Pelosi decides not to run, Pelosi is likely to back Chan. Chan is a progressive who is more ideologically similar to Chakrabarti than to Wiener. If I had to guess right now, I would guess that Chan is a strong candidate who’s second most likely to win the seat (after Wiener) if Pelosi doesn’t run, although I’m really unsure about that.
Overall, I think that Wiener has a 45% chance of winning if Pelosi retires, and a 10% chance of winning if she doesn’t, for an overall ~30% chance of winning.
Why doesn’t Scott Wiener wait?If Scott Wiener knew for sure that Nancy Pelosi was not retiring, I’m not sure whether he would have decided to run. Maybe he’s more optimistic than me about his chances of beating Pelosi.
But my guess is that the main reason for Wiener to jump in early is that, if Pelosi retires late, he doesn’t want support to consolidate around Chakrabarti by the time that Pelosi retires. There’s a pretty big advantage to jumping in early: you can raise more money and get early endorsements. I do think that Wiener is somewhat more likely to win conditional on Pelosi retiring as a result of jumping in now rather than later, but it comes at the cost of burning political capital if she doesn’t retire.
Overall, I don’t know whether Wiener made the right choice by jumping in now. It seems plausible either way. But that’s the choice that he has made.
California’s top-two systemUnlike most states, California doesn’t have partisan primaries. They have a “top-two primary system”, which means that:
- A primary election featuring all candidates regardless of party is held (on June 2, 2026).
- The top two advance into the general election (on November 3, 2026).
One consequence of this is that if the top two candidates in the primary are Wiener and Chakrabarti, then non-Democrats – who’d probably favor Wiener – would be voting. This is similarly true if the top two candidates are Wiener and Pelosi.
This also has implications for the value of the first $3,500 of a donation versus the last $3,500; see below.
Scott Wiener is a really strong fundraiserScott Wiener has already raised $1 million through an exploratory committee (the step before announcing that you’re running). This is really impressive, but not too surprising: he has the backing of many influential groups, including the abundance movement and LGBT rights advocates. I expect Bores to also be a reasonably strong fundraiser, but not quite as strong. This means that counterfactual AI safety dollars go less far for Wiener than they do for Bores. (Though there are considerations in the other direction; see below.)
Will Scott Wiener be an AI safety champion in Congress?In my analysis of Alex Bores, I wrote that I’m confident that Bores would make AI safety one of his top priorities.
Scott Wiener has done a ton for AI safety in California; nevertheless, I’m less confident that Wiener will continue to prioritize AI safety, compared to Bores. That’s because Wiener is generally a really effective legislator and has gotten a huge amount done besides AI safety. It’s harder to get things done in Congress, so I think Wiener will have to be more picky and won’t just be able to “do everything”. My guess is that his first priority would be YIMBY/abundance-type stuff.
However, I think that there’s a pretty good chance that AI will become a high-salience issue more generally. In those worlds, I think AI safety would very plausibly become Wiener’s first priority, and that people would look to him as Congress’ foremost expert on AI safety legislation (at least, if Bores doesn’t get elected).
I also think that Wiener is a really experienced legislator. As far as I know, he is the most effective state legislator anywhere in the country, in terms of passing important bills. This is an important consideration.
All things considered, my guess is that having Wiener in Congress would be somewhat less valuable than having Bores in Congress when AI isn’t super salient, and about as valuable when AI is really salient.
Are there positive effects from strengthening ties between Scott Wiener and AI safety?In general, I think that if advocates for an issue donate to a candidate, that creates stronger bonds between the advocates and the candidate, and makes the candidate more likely to prioritize the issue.
I think that this applies in the case of AI safety and Scott Wiener, and is an important effect to consider. This is especially the case because Scott Wiener used a lot of political capital on SB 1047. I think that elected representatives are somewhat less likely to pick similarly bruising fights if they don’t know that the communities who care about those issues will stand behind them and support them like this.
Running for higher officeScott Wiener is running for a seat in the House of Representatives, but many House members later go on to serve in even higher-ranking roles. Scott Wiener is generally better positioned than Alex Bores to seek higher office in the future. He’s a more experienced and powerful legislator who has built a name for himself to a greater extent than Bores has. I think conditioned on winning, Wiener is somewhat more likely than Bores to become a senator,3 cabinet official, high-ranking representative, or US president.
Cost-effectiveness analysisI think that there two separate strategies for donating to Scott Wiener, and it’s not a priori obvious which one’s better:
- Donate on launch day.
- Donate once Nancy Pelosi retires; if she doesn’t retire, don’t donate.
In this section, I’ll consider both options. The analysis will be a bit wonky, so I’ll state my bottom line in advance.
My bottom lineI think that:
- Marginal donations to Alex Bores still look a bit better than donating to Wiener. If you haven’t yet maxed out to Bores, my recommendation is to do that first.
- If you have maxed out to Bores, and you are not working in a policy role where donating against an incumbent might hurt your career (and won’t be in the near future), my recommendation would be to donate now (Wednesday, October 22nd) to Wiener.
My confidence in this recommendation is weak-to-medium. My recommendation is somewhat sensitive to the parameters of my analysis. For example, I would change my mind and believe that some donors with particularly good counterfactual uses of money would prefer to wait until Pelosi makes her decision if:
- I thought that Wiener’s fundraising numbers had zero effect on whether Pelosi retires; or
- I thought that money given to Wiener when Pelosi retires is only 10% less valuable than money given on day 1 (rather than my current estimate of 20%); or
- I thought that Pelosi was unlikely to retire.
Why is donating now better than waiting and donating if Pelosi retires? There’s a lot of factors that go into my overall estimate, but I can tell a story that captures most of what the numbers are saying.
First, there are a few factors that make donations today look better than donations later. The most important effect is that money now increases Wiener’s probability of winning somewhat more than money later increases his probability of winning. (Maybe 20% more.) The second most important effect is that I think Pelosi is a little more likely to retire if she sees that Scott Wiener raised a lot of money.
Second, even if we found out right now that Pelosi was definitely going to run, donations to Wiener wouldn’t look that bad. By my estimates, they’d be about 30% as good as day-1 Bores donations.4 That’s basically because, although Wiener is in a much worse position, he’s not out of the running, so donations still increase his probability of winning. This means that the money isn’t totally wasted in worlds where Pelosi stays in.
A summary of the numbersI’ll put the full cost-effectiveness analysis, but I’ll say the main numbers here.
I chose to denominate impact in “day-1 dollars given to Bores”: in other words, how good this donation opportunity is compared to how good donating to Alex Bores was on Monday.
How good is donating to Scott Wiener on day 1? The numbers I got were:
- An effect size of 58% (i.e. 58% as good as Bores day-1 dollars) from the effect on increasing the probability that Wiener will win.
- An effect size of 6% from donations increasing the probability that Nancy Pelosi retires.
- An effect size of 11% from having Wiener’s back after his costly and impactful work, strengthening ties between Wiener and AI safety advocates.
And so overall, this comes out to: 75% as good as day-1 donations to Bores.
How good is waiting and donating if Pelosi retires? The numbers I got were:
- An effect size of 38% from the effect on increasing the probability that Wiener will win (all coming from the 60% of worlds where Pelosi retires).
- An effect size of 8% from having Wiener’s back after his costly and impactful work, strengthening ties between Wiener and AI safety advocates (all coming from the 60% of worlds where Pelosi retires).
- Supposing that Pelosi doesn’t retire and so you don’t donate to Wiener, you’ll use that money in some other way (or you’ll save it or whatever). How much do you like how you would spend that money, compared to giving it to Alex Bores on day 1? Call that number c; you get to decide what c is. (If you donated to Bores, hopefully you think c < 1!). Then there is an effect size of 40%*c from this counterfactual use of money (all coming from the 40% of worlds where Pelosi does not retire).
And so overall, this comes out to: 46% + 40%*c as good as day-1 donations to Bores.
If you trust these numbers, it makes sense to wait to donate until Pelosi retires if c > 72%. But note that if you believe that your c is greater than 77%5 and you trust my numbers, then you shouldn’t be donating to Wiener at all. (You should instead be using it in whatever way makes it more than 77% as good as donating to Bores.) So there’s a very narrow range of c-values under which it makes sense to wait (compared to either donating to Wiener now or not donating to Wiener no matter what), and even in those worlds, donating now is only very slightly suboptimal.
See the appendix for a full cost-effectiveness analysis!
[Edit: the current cost-effectiveness analysis fails to account for the opportunity cost of Scott Wiener remaining in the State Senate for another two years — 2027-2028 — until he needs to leave due to term limits. I think this is an important consideration. My current all-things-considered belief is that this consideration is almost canceled out by the other neglected effect of strengthening ties between AI alignment advocates and Wiener in worlds where he loses and remains in the State Senate for those two years. However, this analysis is subject to change. I have a quantitative model here — feel free to get in touch.]
An important second-order effectThere’s a positive second-order effect to donating to Wiener, where politicians see that AI safety champions get lots of donations, and this makes them more likely to become AI safety champions themselves. This is not accounted for in the above cost-effectiveness analysis.
Logistics and details of donating Who can donate?Any US Citizen or permanent resident (e.g. any green card holder6) can donate.
How much can I donate?You can give up to $7,000: $3,500 for the primary election and $3,500 for the general election. If Scott Wiener loses the primary election, you will get back any money you donate beyond $3,500.
Above, I talked about California’s top-two primary system: the top two candidates, regardless of party, advance to the general election. This has an important consequence that potential donors should be aware of: if Wiener advances to the top two and then loses, people who donate beyond $3,500 won’t get a refund. (By contrast, if Bores loses, people who donate beyond $3,500 will get a refund on everything beyond the first $3,500.)
Does that mean that donors should donate $3,500, rather than $7,000? I don’t think so, because the top-two system means that Wiener is likely to have a competitive general election in November 2026. I haven’t done the math, but someone I trust said that the last $3,500 look a tiny bit better than the first $3,500. (By contrast, for Bores, the last $3,500 looked a lot better than the first $3,500.)
How do I donate?You can donate through ActBlue at this link!
If you are donating on October 22nd: donations via ActBlue are preferred (credit card, Paypal, Venmo, Google Pay). While ActBlue donations are instant, checks and wire transfers made directly to the campaign’s bank account may take more than 24 hours to receive.
If you are donating after October 22nd: feel free to donate via ActBlue, or consider doing a bank transfer. That’s because ActBlue (the vendor that donations go through) charges a 4% fee: if you donate $7,000, the Wiener campaign will receive $280 less than that. I don’t currently know how to do this, but feel free to reach out and I’ll try to figure it out!
Will my donation be public? What are the career implications of donating?Yes: donations are a matter of public record. You should take this into account when making your decision. The current administration has been illegally using ideological/loyalty litmus tests for hiring for some roles (e.g. rejecting people who say that Biden won the 2020 election). My best guess is that they are also discriminating on the basis of political donations, at least for some roles. So if you think you might want a role in the federal government, and you don’t already have a recent history of donating to Democrats, you should take this into account.
You can read my discussion of career capital considerations here, and see here for another good post on the matter.
If you’ve already donated to Alex Bores, I think there isn’t much cause for concern, with one exception. If you have the sort of federal policy role where donating against an incumbent might hurt your career, or think there’s a good chance that you will be in such a role in the near future, consider waiting to donate until Nancy Pelosi, the incumbent, announces retirement.
[Edit: Additionally, I’ve only just learned of some potential concerns regarding personal information being revealed via political donations. I expect that this is not a concern for the vast majority of people; however, if you are particularly concerned about privacy, feel free to reach out and we can chat.]
Potential concerns Are these requests for donations just going to continue?I really doubt it. I specifically called out Scott Wiener in my Bores post, saying that he was the one other AI safety champion that I was super excited about. I can’t think of anyone who comes close and who might run for Congress in the 2026 cycle. (I know another AI safety champion who’s currently running for Congress, but I’m only recommending that as a second-tier donation.)
In my Alex Bores post, I said that I thought Bores was a once-in-two-years opportunity and Scott Winer was a once-a-year opportunity. I stand by that – and in particular, I wouldn’t be surprised if I end up recommending two or three more donations in 2027-28 about as strongly as I’m recommending Wiener/Bores.
I’d be kind of surprised if I recommended any donation this strongly in 2025; nothing’s on my radar. Maybe something will come up in 2026? Who knows. But I definitely don’t anticipate regularly suggesting donations with this level of strength.
(One possible way that I could turn out to be wrong: if there’s a Republican AI safety champion – one that isn’t quite as aligned on AI safety, but who would be super valuable to have in Congress because they’re a Republican – I think that might end up being an amazing donation opportunity. I’m not aware of any such person who might run in 2026, but it wouldn’t completely shock me. 2028 seems more plausible.)
Other concernsSee “Potential concerns” from my Bores post, including:
- What if Bores loses?
- What about the press coverage?
- Feeling rushed?
There are nuances, but I think these same concerns are at play here, to about the same degree.
Appendix: Cost-effectiveness analysis details Baseline unit: comparison to Alex BoresThe target audience of this doc is people who have already been convinced to give to Alex Bores, and are considering whether to also donate to Scott Wiener. As such, my units here will be Bores-day-1-dollars per dollar (B$/$): so for example, if donating to Wiener on day 1 is 50% as altruistically good as donating to Bores on day 1, that would mean that donating to Wiener on day 1 is a 0.5 B$/$ opportunity.
(As a reminder: I estimated that an extra $85,000 donated to Bores on day 1 would increase his chances of winning by about 1%.)
Factors that I’ll considerHere are the various mechanisms by which donating to Scott Wiener, or holding off until Pelosi makes her decision, could have positive effects:
- Effect of fundraising numbers on whether Wiener wins the race (conditioning on Pelosi retiring or not).
- Effect of fundraising numbers on whether Pelosi retires.
- Effect of fundraising numbers on strengthening ties between Wiener and AI safety advocates.
- [Only relevant when considering the option of waiting to see whether Pelosi retires] Counterfactual usefulness of donors’ money: holding off on donating gives donors the ability to use their money in a different way if Pelosi stays in.
I will use the following numbers:
- Probability Pelosi retires: 60%
- How good it would be to elect Wiener, compared to electing Bores: 87.5%. This comes from three numbers:
- Above I said that “all things considered, my guess is that having Wiener in Congress would be somewhat less valuable than having Bores in Congress when AI isn’t super salient, and about as valuable when AI is really salient.” Overall, I’d guess that having Wiener in Congress is about 70% as good as having Bores in Congress, for AI safety.
- My guess that about half of Bores’ impact comes from him being a representative, compared to potentially holding higher office in the future
- My guess that Wiener is somewhat (1.5x?) more likely to be elected to higher office in the future
- The calculation here is .5*.7 + .5*1.5*.7 = .875
I estimated that raising $85k for Bores would change his probability of winning by about 1%.7 How does that compare to Wiener?
Some factors that make money given to Wiener look better:
- Conditional on Pelosi retiring, Wiener’s probability of winning is closer to 50% (my best guess is 45%, compared to Bores’ 20%). If you think of money as pushing Wiener further to the right on the logistic S-curve of win probability, that makes a greater difference in win probability than it does for Bores.
- SF is a cheaper place to run ads than New York, so a dollar goes further.
Some factors that make money given to Wiener look worse:
- Conditional on Pelosi not retiring, Wiener’s probability is farther from 50% (my guess is 10%), so donations have a smaller effect on P(win): maybe about a third as far as if she retires.
- Because Wiener is an excellent fundraiser and already has $1 million, and because SF is a cheaper place to run ads than New York, I think that we are steeper into the diminishing-returns curve.
- I think that endorsements matter less in this race, because Wiener is really well-known in the district. Additionally, dollars have less effect on endorsements, because party elites’ opinions of Wiener are more set in stone.
Overall, I think these effects roughly cancel out, with maybe money to Wiener looking just slightly worse. I’ll say that money to Wiener goes about 90% as far as money to Bores if Pelosi retires, and 30% as far if she doesn’t.8 And so the calculation looks like:
- [In the 60% of worlds where she retires] 0.9 * 0.875
- [In the 40% of worlds where she doesn’t retire] 0.3 * 0.875
This gives us a total of 0.58 B$/$ just from this consideration.
2. Effect of fundraising numbers on whether Pelosi retiresDifferent people I asked had pretty wildly diverging opinions here, but my all-things-considered guess is that Pelosi is 2 percentage points more likely to retire if Wiener raises $1M more. The mechanism is that if Wiener raises more, Pelosi will be faced with the prospect of a more bruising, competitive primary that she’d rather avoid. But I don’t think this effect is all that strong, because Pelosi is already facing a fairly formidable opponent in Saikat Chakrabarti. Plus, there’s a consideration in the other direction: if Pelosi wants to hold her seat until conditions look favorable for her daughter Christine to win a primary, then Wiener putting up a strong showing would increase the chances that Pelosi would hold the seat for another two years. But I think this is a weaker effect than the positive effect mentioned above.
Given that Wiener is 45% to win if Pelosi retires and 10% to win if she doesn’t, $1M increases Wiener’s probability of winning by (45% – 10%)*2% = 0.7% via this mechanism. By comparison, $1M to Bores raises his probability of winning by about 11%, per my blog post. So that’s another 0.7*0.875/11 = 0.06 B$/$.
3. Effect of fundraising numbers on strengthening ties to AI safety advocatesScott Wiener used a lot of political capital on SB 1047, and I think it’s important to show him that we have his back. I think that elected representatives are somewhat less likely to pick similarly bruising fights if they don’t know that the communities who care about those issues will stand behind them and support them like this. This is important to keep in mind. This is important to keep in mind.
Feel free to reach out if you want details on my thinking here, but I don’t think this ends up being a huge consideration, relative to the effect of helping Wiener win. My estimate is 0.11 B$/$.
And therefore…Adding these numbers up, we get 0.75 B$/$.
In other words: I think that giving to Scott Wiener on Wednesday, October 22nd (day 1) is about ¾ as good as it was to give to Alex Bores on Monday (day 1 of his campaign).
Donating if Pelosi retiresPelosi is 60% to retire and donations are better in worlds where she retires, so one option is to wait for her to decide: if she retires, donate; if she runs, don’t.
Conditional on Pelosi retiring, donating later is slightly worse than donating now for boosting Wiener’s chances and slightly worse for boosting how much he feels supported by the AI safety community (and thus, how likely he is to work with us in the future). Plus, donating now makes Pelosi more likely to retire.
On the other hand, conditional on Pelosi not retiring, your money could plausibly be better spent.9 So how does the math shake out?
The analysis below examines the strategy of waiting, then either donating to Wiener if Pelosi retires (60%) or using the money in the best way if Pelosi doesn’t retire (40%). So the calculation will look like “60% * (some of the terms discussed above) + 40% * (next best use of money)”.
1. Effect of fundraising numbers on whether Wiener wins the raceIf Pelosi retires, my guess is that it would be in December or so, but I’m pretty uncertain: it could be in November, or in early 2026.
My guess is that money when Pelosi retires is somewhat worse than money now (see this section of my Alex Bores post for why). It would range from a little worse (10% worse) if she retires soon, to a lot worse (40% worse) if she retires late.10 In expectation, I think that conditional on Pelosi retiring eventually, giving money to Wiener when she retires looks about 20% worse than giving money to Wiener now.
So above I wrote:
- [In the 60% of worlds where she retires] 0.9 * 0.875
And now that’s:
- [In the 60% of worlds where she retires] 0.9 * 0.8 * 0.875 = 0.63
And so, this effect contributes 60% * 0.63 = 0.38 B$/$.
2. Effect of fundraising numbers on whether Pelosi retiresIf you don’t give until Pelosi retires, the effect here is 0 B$/$.
3. Effect of fundraising numbers on strengthening ties to AI safety advocatesI think that raising money later would have a somewhat weaker effect, because Wiener would probably not appreciate it quite as much. I’ll call the effect size here 0.08 B$/$ (compared to 0.11 B$/$ above).
4. Counterfactual usefulness of your moneyIf you wait and only donate if Pelosi retires, then, in the 40% of worlds where Pelosi doesn’t retire, you’ll get to spend your money on other things you value! How good the counterfactual use of your money is depends on your values and beliefs, but let’s denominate it in terms of “fraction as good as donating to Alex Bores”. Let’s call this fraction c (so c = 0 means you don’t value your money at all, and c = 1 means you could use a dollar that you’re thinking of giving to Scott Wiener in order to do something that you value as much as you value giving a dollar to Bores).
For what it’s worth, in my view:
- If you’re plugged into efforts to build relationships between members of Congress and AI safety advocates, and would give your money to that instead, then I think that using c = 0.5 is about right.
- In my view, pretty much all ways to give away money are much worse than giving to Bores (c < 0.2). One exception to this might be efforts to preserve democracy in the United States, which I haven’t evaluated closely but which look pretty good to me.
- If this is funging against money that you would have spent on personal stuff or savings, I’ll leave it up to you to decide how to weigh that!
Adding these numbers together, we get 0.46 + 0.4c B$/$.
So, you should hold off on donating if 0.46 + 0.4c > 0.75, which happens if c > 0.72.
(But note that if you defer to my analysis but your personal c is greater than 0.77, then you shouldn’t be donating to Scott Wiener at all! You should be using your money for whatever thing is more than 77% as good as day-1 donations to Bores.)
This means that my analysis suggests that giving to Wiener now pretty much dominates the strategy of waiting and giving to Wiener if Pelosi retires.
Plugging in your own Pelosi retirement probabilityAs indicated above, my recommendation is pretty sensitive to the probability that Pelosi retires. I chose 60% as my all-things-considered estimate, but I’ll let you plug in your own estimate if you have an opinion that differs strongly from mine.
If your probability that Pelosi will retire is p, then donating now comes out to 0.67p + 0.36 B$/$,11 whereas waiting and donating if Pelosi retires comes out to 0.78p + c(1 – p) B$/$.
If you think that Pelosi is only 40% to retire, then you should wait to donate if your c is greater than 0.53. If you think that Pelosi is only 20% to retire, then you should wait to donate if your c is greater than 0.42.
- As of this writing, there is an atrociously worded Kalshi market called “Will Nancy Pelosi retire before the midterms?” that’s pretty illiquid and is trading at 22%. The question is whether this market is about Pelosi announcing before the election that she will retire/resign before the end of her term or if it’s about Pelosi announcing before the election that she will retire before or at the end of her term. As far as I can tell, a plain reading of the rules summary suggests the latter (which is what we care about). However, I asked my friend Jesse, who is one of the top traders on prediction markets, and he told me his intuition was that only the former counts (so it would only resolve YES if Pelosi left her seat early). He then asked two people who he thought were particularly good at reading Kalshi rules, and they agreed. He pointed me to a similar market on Mitch McConnell, where the rules are exactly the same (they point to the same document), but the rules summary is clear (“resign” cannot refer to retirement) – plus it’s clear from the market price, since McConnell has announced that he won’t seek reelection.
Another instructive market is this one, which is really illiquid but asks whether Pelosi will come in the top two in the June primary (which is basically equivalent to her deciding to run). This market technically implies that Pelosi is at least 85% to retire, though I basically wouldn’t read anything into that: it’s extremely illiquid. That said, there are arbitrages worth tens of dollars under an interpretation of the first market that would imply that Pelosi is 78% to seek reelection. I think this is some more evidence that people are interpreting the first market in the way that Jesse did. ︎
︎ - In fairness, some of that vote was Republican anti-Pelosi vote, and Wiener would need a lot of backing from Democrats to beat Pelosi. But someone I trust looked at the numbers in more detail and estimated that the challenger got 17% of voters who voted for Biden in that election. ︎
- I think this despite California being a bigger state than New York. ︎
- By contrast, if we found out today that Pelosi will retire, then day-1 donations to Wiener look almost exactly as good as day-1 donations to Bores. (My point estimate is 97% as good.) ︎
- That’s the solution to the equation 46% + 40%*c = c, i.e. the indifference point between donating later and doing whatever you were going to use your money on instead. ︎
- Some green card holders have expressed concern to me that they might have problems with immigration/naturalization if they donate. The Trump administration has really shocked me with its lawbreaking; nonetheless, I think that the Trump administration is currently pretty far from being so brazen as to systematically deny people citizenship because of their political donations. I can’t completely rule it out, though; I think that donating to Democrats could have a 1-2% chance of causing someone to be unable to become a citizen. In most of those worlds, the U.S. looks much more like a dictatorship than it does now. ︎
- There’s been a little less coverage of Bores’ fundraising number than I’d have expected – though I’ve heard that the number has been mentioned in New York Politico – so my current guess is $90k/1% rather than $85k/1%. ︎
- This factor of 3 difference is based on the slope of the logistic curve at y = 10% vs. y = 45%. ︎
- Although this isn’t super clear, and I might end up recommending that people donate in a world where Pelosi doesn’t retire but the race ends up looking close. ︎
- If you read my post on Bores closely, you might notice that the numbers I used there would have implied a 20%-60% range here, rather than 10%-40%. The main reason for the lower numbers is that I expect a larger fraction of the usefulness of Wiener’s money to come from advertising rather than signaling campaign strength, so early money is still better, but by less. ︎
- Assuming that p is not too close to 0 or 1. The “effect of donations on probability that Pelosi retires” term acts a little weirdly at the extremes. ︎


 . For example, Jaime forecast a 40% chance. If GPT-5 is released this year, then the “perfect” forecast would be 100%, which means that his “forecasting error” would be 0.6. Thus, I would pay Jaime
  . On the other hand, if GPT-5 is not released, then his forecasting error would be 0.4, so I would pay Jaime
  .
.
 with probability
  by communicating
  bits [of information…] Notably, this bound only depends on the error Alice and Bob are willing to tolerate, and not on the amount of information available to them.
 and
and  and accepts if k and k + 2 are both prime. A deductive argument about p(C) might point out that the density of primes in this range is roughly 1%, so if we presume that the event that k is prime and the event that k + 2 is prime are independent, then we get an estimate of p(C) = 0.01%. A more sophisticated argument might take this one step further by pointing out that if k is prime, then k is odd, so k + 2 is odd, which makes k + 2 more likely to be prime (by a factor of 2), suggesting a revised estimate of p(C) = 0.02%. A yet more sophisticated argument might point out that additionally, if k is prime, then k is not divisible by 3, which makes k + 2 more likely to be divisible by 3, which reduces the chance that k + 2 is prime.
 , define
 ![C[x_i = 0]](https://s0.wp.com/latex.php?latex=C%5Bx_i+%3D+0%5D&bg=ffffff&fg=000000&s=0&c=20201002) to be the circuit that you get when you “force”
to be the circuit that you get when you “force”  to be 0. (The resulting circuit now has n – 1 inputs instead of n.) Define
 ![C[x_i = 1]](https://s0.wp.com/latex.php?latex=C%5Bx_i+%3D+1%5D&bg=ffffff&fg=000000&s=0&c=20201002) analogously. The deductive estimator’s estimate of p(C) should be equal to the average of its estimate of
analogously. The deductive estimator’s estimate of p(C) should be equal to the average of its estimate of ![p(C[x_i = 0])](https://s0.wp.com/latex.php?latex=p%28C%5Bx_i+%3D+0%5D%29&bg=ffffff&fg=000000&s=0&c=20201002) and
and ![p(C[x_i = 1])](https://s0.wp.com/latex.php?latex=p%28C%5Bx_i+%3D+1%5D%29&bg=ffffff&fg=000000&s=0&c=20201002) .
.


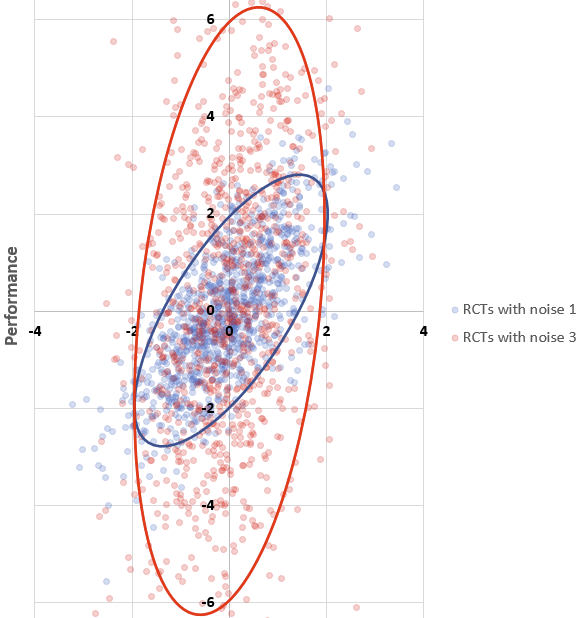
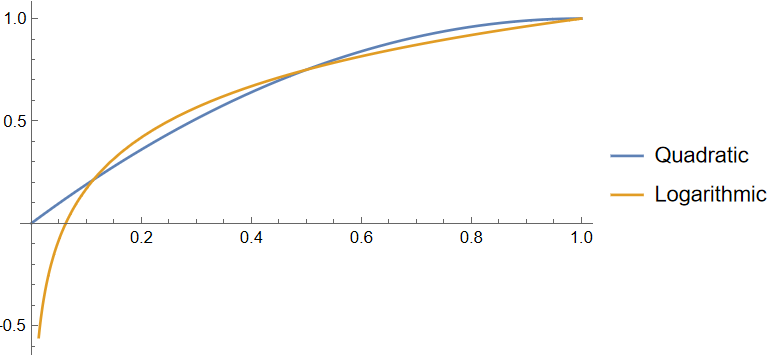
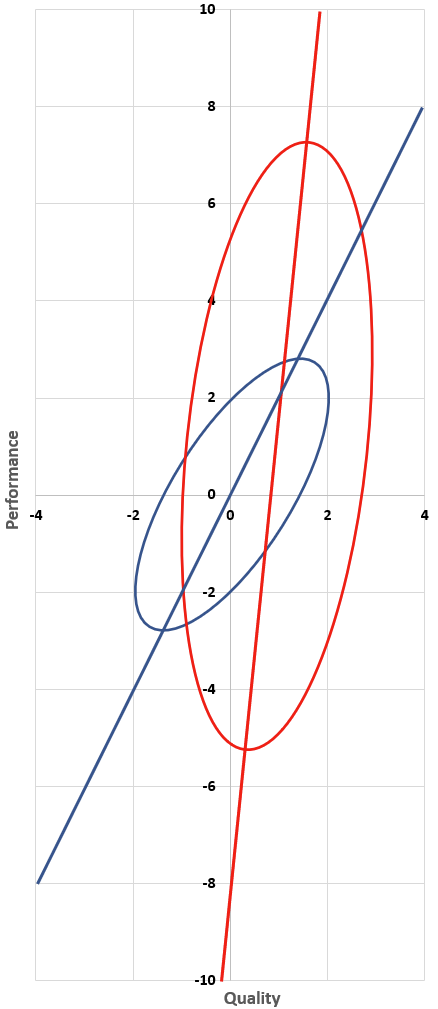
![\mathbb{E}[\text{Performance} | \text{Quality} = q] = q](https://s0.wp.com/latex.php?latex=%5Cmathbb%7BE%7D%5B%5Ctext%7BPerformance%7D+%7C+%5Ctext%7BQuality%7D+%3D+q%5D+%3D+q&bg=ffffff&fg=000000&s=0&c=20201002) . That would be useful if you were guessing performance based on quality. But you know performance and don’t know quality. So while this red line has the property that for every x-value, there’s as much of the ellipse above it as below it, what you want is a line with the property that for every y-value, there’s as much of the ellipse to the left of it as to the right of it.
. That would be useful if you were guessing performance based on quality. But you know performance and don’t know quality. So while this red line has the property that for every x-value, there’s as much of the ellipse above it as below it, what you want is a line with the property that for every y-value, there’s as much of the ellipse to the left of it as to the right of it.
![\mathbb{E}[\text{Quality}] = 0.5 \cdot \text{Performance}.](https://s0.wp.com/latex.php?latex=%5Cmathbb%7BE%7D%5B%5Ctext%7BQuality%7D%5D+%3D+0.5+%5Ccdot+%5Ctext%7BPerformance%7D.&bg=ffffff&fg=000000&s=0&c=20201002)


 such that
 ![\mathbb{E}[\text{Quality}] = \beta \cdot \text{Performance}](https://s0.wp.com/latex.php?latex=%5Cmathbb%7BE%7D%5B%5Ctext%7BQuality%7D%5D+%3D+%5Cbeta+%5Ccdot+%5Ctext%7BPerformance%7D&bg=ffffff&fg=000000&s=0&c=20201002) . To do so, we’re going to look at the expected value of quality times performance in two different ways. Abbreviating quality as Q and performance as P, we have
. To do so, we’re going to look at the expected value of quality times performance in two different ways. Abbreviating quality as Q and performance as P, we have![\mathbb{E}[Q \cdot P] = \mathbb{E}[Q(Q + \text{noise})] = \mathbb{E}[Q^2] = \text{Var}(Q) = 1.](https://s0.wp.com/latex.php?latex=%5Cmathbb%7BE%7D%5BQ+%5Ccdot+P%5D+%3D+%5Cmathbb%7BE%7D%5BQ%28Q+%2B+%5Ctext%7Bnoise%7D%29%5D+%3D+%5Cmathbb%7BE%7D%5BQ%5E2%5D+%3D+%5Ctext%7BVar%7D%28Q%29+%3D+1.&bg=ffffff&fg=000000&s=0&c=20201002)
![\mathbb{E}[Q \cdot P] = \mathbb{E}[P \cdot \mathbb{E}[Q \mid P]] = \mathbb{E}[P \cdot \beta P] = \beta \mathbb{E}[P^2] = 10\beta,](https://s0.wp.com/latex.php?latex=%5Cmathbb%7BE%7D%5BQ+%5Ccdot+P%5D+%3D+%5Cmathbb%7BE%7D%5BP+%5Ccdot+%5Cmathbb%7BE%7D%5BQ+%5Cmid+P%5D%5D+%3D+%5Cmathbb%7BE%7D%5BP+%5Ccdot+%5Cbeta+P%5D+%3D+%5Cbeta+%5Cmathbb%7BE%7D%5BP%5E2%5D+%3D+10%5Cbeta%2C&bg=ffffff&fg=000000&s=0&c=20201002)
 .
. . Since expected quality is 50% of performance, your best guesses about the qualities of the blue interventions after seeing the RCT results are distributed with mean 0 and standard deviation
  , which is about 0.71.
 . Since expected quality is 10% of performance for these interventions, your best guesses for the qualities of the red interventions after seeing the RCT results are distributed with mean 0 and standard deviation
  , which is about 0.32.
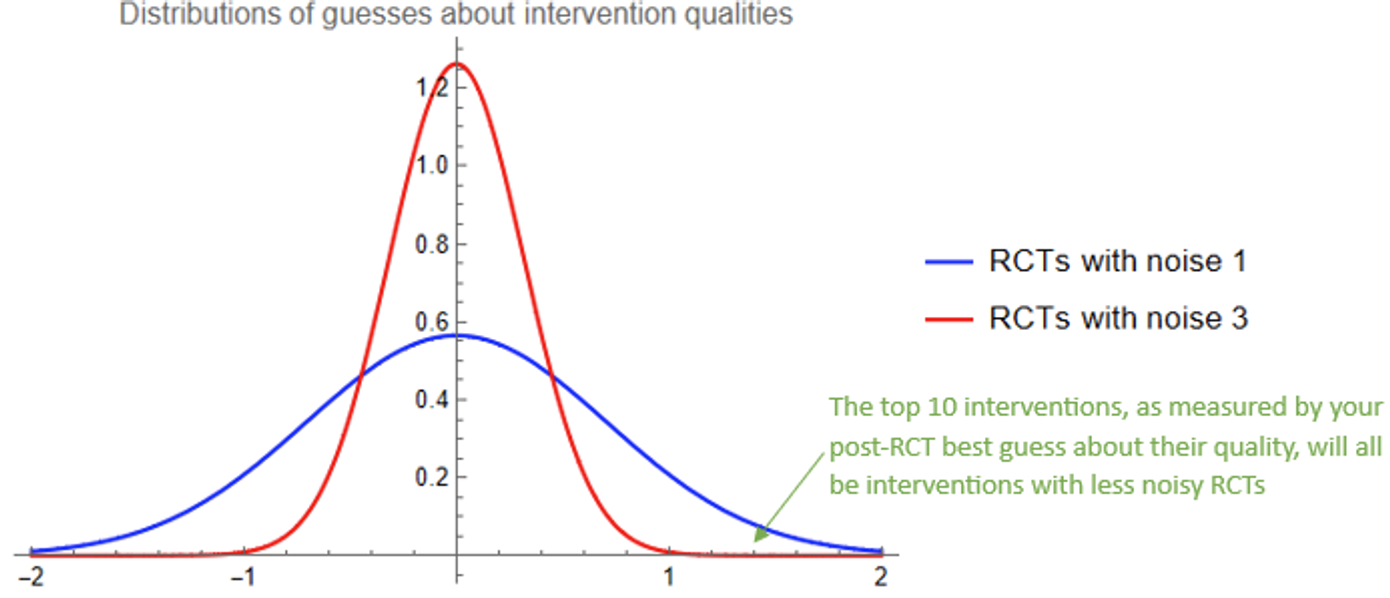
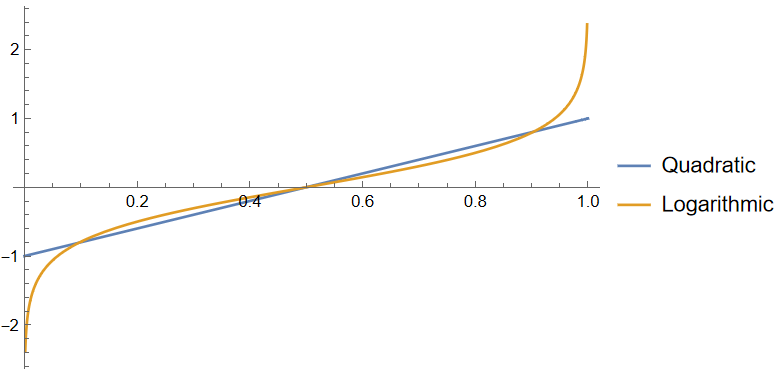
![\mathbb{E}[\text{Quality}] = 1 + 0.1(\text{Performance} - 1).](https://s0.wp.com/latex.php?latex=%5Cmathbb%7BE%7D%5B%5Ctext%7BQuality%7D%5D+%3D+1+%2B+0.1%28%5Ctext%7BPerformance%7D+-+1%29.&bg=ffffff&fg=000000&s=0&c=20201002)


![\mathbb{E}[\text{Quality}] = r(0.5P) + (1-r)(0.1P).](https://s0.wp.com/latex.php?latex=%5Cmathbb%7BE%7D%5B%5Ctext%7BQuality%7D%5D+%3D+r%280.5P%29+%2B+%281-r%29%280.1P%29.&bg=ffffff&fg=000000&s=0&c=20201002)


 as a function of P. What if we just look at r, the probability that the intervention had an RCT with noise 1, as a function of P?