Show full content
January 2026 saw a large number of weather stations achieve record maximum temperatures in Australia, particularly in New South Wales, South Australia and Victoria between Jan 26 and 31.
The map below shows the large region of Australia with an average maximum in excess of 45°C during the last week of January (map under Creative Commons Attribution 4.0 International Licence).

Below is a list of weather stations (with at least 20 years of records) achieving their highest recorded maximum temperature, followed by a map showing these locations. Australia had its 7th and 8th recorded instance of at least 50°C. Data comes via statewide climate summaries in the Bureau of Meteorology website here.
Station State New record (°C) Date in Jan ’26 Previous record (°C) Date of previous record Years of record Andamooka SA 50 29th 48.1 24 Jan 2019 56 Port Augusta Aero SA 50 30th 49.5 24 Jan 2019 25 Marree Aero SA 49.8 29th 48.5 25 Jan 2024 28 Pooncarie Mail Agency NSW 49.7 27th 48.2 16 Jan 2019 24 Tarcoola Aero SA 49.7 30th 49.1 24 Jan 2019 28 Woomera Aerodrome SA 49.6 30th 48.2 20 Dec 2019 77 Renmark Aero SA 49.6 27th 48.6 20 Dec 2019 31 Roxby Downs (Olympic Dam Aerodrome) SA 49.6 29th 48.5 25 Jan 2011 29 Ceduna AMO SA 49.5 26th 48.9 19 Dec 2019 84 Fowlers Gap AWS NSW 49.1 27th 47.5 25 Jan 2019 22 Wanaaring Post Office NSW 49 27th 48.6 12 Jan 2013 34 Walpeup Research VIC 48.9 27th 48.1 7 Feb 2009 62 Hopetoun Airport VIC 48.9 27th 48.8 7 Feb 2009 22 White Cliffs AWS NSW 48.9 31st 48.2 16 Jan 2019 21 Tibooburra Airport NSW 48.7 28th 48.4 02 Jan 2014 29 Wilcannia Aerodrome AWS NSW 48.7 27th 48.5 25 Jan 2019 27 Mildura Airport VIC 48.6 27th 46.9 03 Jan 1990 80 Wudinna Aero SA 48.6 26th 48.4 19 Dec 2019 27 Balranald (RSL) NSW 48.4 27th 47.7 18 Jan 1908 118 Ivanhoe Aerodrome AWS NSW 48.4 27th 47.9 16 Jan 2019 26 Coober Pedy Airport SA 48.3 30th 48.3 20 Dec 2019 32 Leigh Creek Airport SA 48.2 29th 46.9 24 Jan 2019 44 Loxton Research Centre SA 48.2 27th 47.3 20 Dec 2019 42 Longerenong VIC 48.1 27th 47.6 7 Feb 2009 62 Ballera Gas Field QLD 48.1 29th 47.8 02 Jan 2014 24 Broken Hill Airport AWS NSW 47.8 27th 46.3 16 Jan 2019 39 Swan Hill Aerodrome VIC 47.7 27th 47.5 25 Jan 2019 30 Cobar MO NSW 47.6 31st 47 15 Jan 2001 64 Cobar Airport AWS NSW 47.6 31st 47.3 11 Feb 2017 33 Ouyen (Post Office) VIC 47.5 8th 47.3 20 Dec 2019 69 Nyngan Airport NSW 47.5 27th 47.4 11 Feb 2017 95 Streaky Bay SA 47.5 26th 47.2 23 Jan 1982 70 Charlton VIC 47.4 27th 46.6 7 Feb 2009 22 Trangie Research Station AWS NSW 47.3 26th 47 11 Feb 2017 58 Yunta Airstrip SA 47.1 27th 46 15 Jan 2019 28 Corowa Airport NSW 47 28th 46 7 Feb 2009 and 31 Jan 2020 56 Condobolin Airport AWS NSW 46.9 31st 46.9 11 Feb 2017 33 Hawker SA 46.8 30th 46.1 19 Dec 2019 54 Yanco Agricultural Institute NSW 46.6 28th 46.1 10 Feb 2017 27 Mortlake Racecourse VIC 46.3 27th 46 7 Feb 2009 36 Cleve SA 46.2 26th 46 24 Jan 2019 70 Dubbo Airport AWS NSW 46.1 26th 46.1 11 Feb 2017 34 Yarrawonga VIC 46 28th 46 7 Feb 2009 and 31 Jan 2020 33 Elliston SA 45.9 26th 44.3 23 Jan 2019 65 Arkaroola SA 45.9 30th 45.5 31 Dec 1981 49 Westmere VIC 45.8 27th 45.2 20 Dec 2019 20 Hamilton Airport VIC 45 27th 45 20 Dec 2019 43 Warrnambool Airport NDB VIC 45 27th 44.8 7 Feb 2009 28 Yongala SA 45 30th 44 7 Feb 2009 69 Casterton VIC 44.7 27th 44.5 29 Jan 2009 and 20 Dec 2019 21 Khancoban AWS NSW 43.6 28th 43.3 07 Feb 2009 and 31 Jan 2020 30 Tuggeranong (Isabella Plains) AWS ACT 43.5 28th 43.3 04 Jan 2020 30 Tumbarumba Post Office NSW 43 28th 42 04 Jan 2020 59 Omeo VIC 40.5 27th 40.4 30 Jan 2009 and 7 Feb 2009 22 Hunters Hill VIC 39.3 28th 38.8 04 Jan 2020 33 Stanthorpe Leslie Parade QLD 38.2 26th 38 24 Dec 1972 64 Grampians (Mount William) VIC 37.2 27th 36.6 30 Jan 2009 and 7 Feb 2009 20 Guyra Hospital NSW 35.3 26th 35.1 11 Feb 2017 43 Falls Creek VIC 30.5 28th 29.7 16 Jan 2014 36Marree, SA probably had the hottest stretch of 8 days from 24-31 January:
Five consecutive days of 48°C were recorded both in Marree and Smithville AWS (NSW). According to the BOM summary here, this is an Australian record. Marree back in 1973 had 13 consecutive days of at least 45°C, so that Australian record stands. The summary also mentions that a daily maximum temperature of 49.0 °C or more was observed in Australia 19 times this January; the most in any previous month was 6 in January 2019.

 , made by stacking rows of
  unit squares as shown in the figure below for
  .
.
 . Then we shall add up the number of rectangles with top-right corner at
  (
( ). This number is given by the number of places we can choose the bottom-left corner since these two points uniquely determine the rectangle. The bottom-left corner can be at any
  coordinate between
  and
and  inclusive. Similarly it can be at any
  coordinate between
  inclusive, yielding
  rectangles in total. This is illustrated for
  where the bottom left corner of each rectangle’s corner is labelled from
  to
to  .
.
 and
and  gives our desired quantity

 is constant sum to binomial coefficients of the form
  .
. 
 is equal to
  since we may choose
  items from
  by first selecting the middle item in position
  (in place
  up to
up to  ), then having
  remaining places (from
  to
to  ) to choose the third item. Hence summing over diagonals where
  gives
gives
 and
and  respectively where
  ,
,  and
and  . Hence we are looking for the number of integer solutions to
 and after subtracting
 bars separating
  stars where
  represents the number of stars between bar
  (treat bar
  ways of placing such bars, giving us our desired result.


 . Using trigonometry we find
  . For small angles,
  where
where  is measured in radians, an approximation that is only around 1% inaccurate even when
 and the fact that angles
  times angles
  in degrees.
  in time T. Multiplying this by 3.6 to convert from m/s to km/h gives us the approximate scale factor of 165.


 . Assume the observer is in the northern hemisphere and the point
  represents the north celestial pole about which the stars appear to rotate anti-clockwise as the earth rotates on its axis (in the southern hemisphere stars rotate clockwise about the south celestial pole). The red ellipse illustrates the circular path of a star over a 24-hour period – point
  is its highest location while point
  is where it will be after a quarter of a day. Also shown in the diagram are axes
  (pointing east),
  (pointing north),
  (pointing directly overhead) and corresponding unit basis vectors
  ,
,  and
and  .
.
 – the time (as a proportion of a day) after the star has reached its highest point
 – the angle of
  – the latitude of the observer (-90° to 90°)
 . If
. If  , we would have a northern pole star and
  . If
. If  we would have a star on the celestial equator and
  . More generally,
 , hence we have
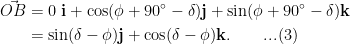
 from the fixed line
  which is the projection of
 and
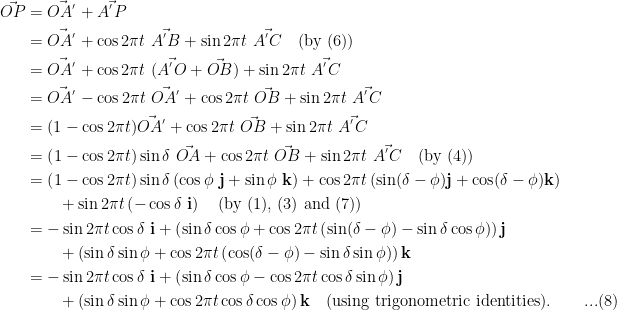
and  . For any point
  on the path we can write
![\displaystyle \vec{A^{'}P} = \cos 2\pi t\ \vec{A^{'}B} + \sin 2 \pi t\ \vec{A^{'}C}, \quad t \in [0, 1].\quad\quad ...(6)](https://s0.wp.com/latex.php?latex=%5Cdisplaystyle+%5Cvec%7BA%5E%7B%27%7DP%7D+%3D+%5Ccos++2%5Cpi+t%5C+%5Cvec%7BA%5E%7B%27%7DB%7D+%2B+%5Csin++2+%5Cpi+t%5C+%5Cvec%7BA%5E%7B%27%7DC%7D%2C+%5Cquad+t+%5Cin+%5B0%2C+1%5D.%5Cquad%5Cquad+...%286%29&bg=ffffff&fg=000000&s=0&c=20201002)
 ,
, 
 ,
, 
 ,
, 
 ,
, 
 has the same length as
  and is pointing directly west (i.e. perpendicular to both
  and
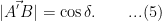
and  ), we have from (5):
 :
:
 equal to the
 , the fixed location of the pole star.
 . This traces a circle with diameter joining
 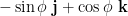 and
and  (two antipodal points), hence it is a great circle on the celestial sphere.
 (observer on the equator) we obtain
  , hence the
  (observer at the north pole) we obtain
  , hence the star traces out a circle with constant angle of elevation.
 (assuming a circular orbit with radius
  starting at
  at
at  ). The parameter
  here represents the fraction of year after the winter solstice. Earth’s axis of rotation points in the direction
  , being tilted away from the sun in the north when
  .
. . Then the angle
  between the sun’s position and the earth’s axis satisfies
 . If
. If  , we have the equinoxes and
  then
then  .
.
 and hence
 . For example taking the sun on the summer solstice at Melbourne, Australia we have
  and so
  . This corresponds to a bearing of
  , around 20 degrees south of east. The answer given in
  , slightly more perhaps because it takes into account refraction and the fact that the sun is not pointlike.


 are to be determined. Multiplying both sides by
  for some
 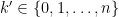 ,
,
 in both sides gives
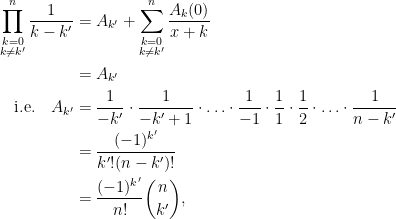
![\displaystyle \begin{aligned}n=1&:& \frac{1}{x(x+1)} &= \frac{1}{x} - \frac{1}{x+1}\\n = 2&:& \frac{1}{x(x+1)(x+2)} &= \frac{1}{2} \left[ \frac{1}{x} - \frac{2}{x+1} + \frac{1}{x+2} \right]\\n=3&:& \frac{1}{x(x+1)(x+2)(x+3)} &= \frac{1}{6} \left[ \frac{1}{x} - \frac{3}{x+1} + \frac{3}{x+2} - \frac{1}{x+3}\right] \end{aligned}](https://s0.wp.com/latex.php?latex=%5Cdisplaystyle+%5Cbegin%7Baligned%7Dn%3D1%26%3A%26+%5Cfrac%7B1%7D%7Bx%28x%2B1%29%7D+%26%3D+%5Cfrac%7B1%7D%7Bx%7D+-+%5Cfrac%7B1%7D%7Bx%2B1%7D%5C%5Cn+%3D+2%26%3A%26+%5Cfrac%7B1%7D%7Bx%28x%2B1%29%28x%2B2%29%7D+%26%3D+%5Cfrac%7B1%7D%7B2%7D+%5Cleft%5B++%5Cfrac%7B1%7D%7Bx%7D+-+%5Cfrac%7B2%7D%7Bx%2B1%7D+%2B+%5Cfrac%7B1%7D%7Bx%2B2%7D+%5Cright%5D%5C%5Cn%3D3%26%3A%26+%5Cfrac%7B1%7D%7Bx%28x%2B1%29%28x%2B2%29%28x%2B3%29%7D+%26%3D+%5Cfrac%7B1%7D%7B6%7D+%5Cleft%5B+%5Cfrac%7B1%7D%7Bx%7D+-+%5Cfrac%7B3%7D%7Bx%2B1%7D+%2B+%5Cfrac%7B3%7D%7Bx%2B2%7D+-+%5Cfrac%7B1%7D%7Bx%2B3%7D%5Cright%5D+%5Cend%7Baligned%7D&bg=ffffff&fg=000000&s=0&c=20201002)


 is drawn parallel to
  ), thus dissecting the triangle into two. Each of the smaller triangles then has an inscribed parallelogram where two of the vertices are on a side of each triangle. Then by drawing lines parallel to sides if required, we create two sub-problems each having four vertices of the parallelogram on the sides of the triangle.
 formed by lines parallel to the sides.
 as shown in the figure below). In this figure, if we let
  and the height of ABC from
  , then by the similarity of triangles
  and
and  ,
,  and
and  has height
  . Then the area of the parallelogram
  is
is  which is
  times the area of
  . This quantity has maximum value 1/2 when
  so we conclude that the parallelogram does not exceed half the triangle’s area.
 are the sides of the triangle with
  the second longest side length. Then let the segment
  joining the midpoints of
  and
and  . It remains to be shown that there exist parallel segments of this same length from
  to
to  . The longest possible such segment has length
  and the shortest has length
  , half the length of the altitude of
  . This follows from

 of
of 


 inscribed in
  is on
is on  is on
is on  . We claim that the largest such square is either
  (two vertices on
  inscribed in
  ,
,  and
and  . To show these circles intersect at a single point, we can prove that if the circumcircles of triangles
  are cyclic by the following equality:
 ,
,  being cyclic.
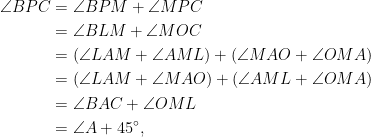
 and
and  . Hence
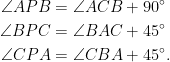
 respectively on the sides
  of the triangle. Consider the locus of the points of the square as
  also traces a line segment, between the points
  and
and  so as to be contained within the triangle.
  is maximised. We have seen that the point
  or
or  . We therefore conclude that the largest square inside a triangle will have two points on a side.
  with altitude
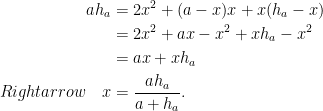

 is the same as if
  , where
  is right-angled. In this case the square’s side length is
  .
.
 is obtuse
 .
.

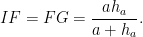
 and hypotenuse
  , we wish to compare the quantities
  and
and  , the two possible sums of the base and height of the triangle. We always have
  because the diameter of the incircle of the triangle is shorter than the altitude from the hypotenuse (i.e. the incircle is inside the triangle). We conclude that the largest square in a right-angled triangle is constructed on its two legs rather than its hypotenuse.