
How to Open Source Your Code | Sanjay Nair
Software engineering leader based in Atlanta, Georgia, sharing insights on leadership, technology, and software development.
The Prometheus monitoring system and time series database. - prometheus/prometheus
Software engineering leader based in Atlanta, Georgia, sharing insights on leadership, technology, and software development.

A production application went down and was recovered six hours later after users started reaching support and developers rebooted the app. This happened on a...

Grafana is an open source visualization and dashboarding technology that allows you to explore your metrics, logs, and traces no matter where the data is.

An open-source monitoring system with a dimensional data model, flexible query language, efficient time series database and modern alerting approach.
Learn how to use Delve (dlv) for Go program debugging, including local and remote debugging with VSCode, breakpoint management, and goroutine analysis.

Describes the Grafana Loki architecture.
An open-source monitoring system with a dimensional data model, flexible query language, efficient time series database and modern alerting approach.
Kracekumar's personal website, mostly blog.

Nearing the end of our series, Dave Lucia explores observability tools and strategies for Elixir teams in midsize settings, sharing how to boost application monitoring and reliability from startups to Series C/D companies and more!
Observability stack for local development and troubleshooting toolkit - cbos/observability-toolkit

Tales of adventures in GoLand, one month in. A subjective look at the Go language, after having spent about a month using it, with zero previous experience.
Building a highly available PowerDNS cluster with MariaDB standard replication to enable DNS-based failovers for other highly available services.
Within my work at Red Hat and Kubernetes SIG instrumentation I have been working on kube-state-metrics , a Prometheus exporter exposing the state of a Kubernetes cluster to a Prometheus monitoring system. In particular I have focused on performance optimizing metric rendering for both latency as well as resource usage. Below I want to describe our approach of metric driven performance tuning, using Prometheus to monitor kube-state-metrics on top of Kubernetes, which in itself enables Prometheus to monitor Kubernetes.

A by the numbers look back at what happened to Helm and the community charts in 2017.
I am passionate about Observability already for a long time. Monitoring tools have been helping me already for quite some years to get insights in the behavior of a service and especially a landscape of services. In 2016 I was working at a project where we were facing a number of problems and didn’t really have a clue what was going on in our application landscape. I suggested to work on more insights and we stared using Telegraf, InfluxDB, Prometheus and Grafana. Grafana 3.1 was the first release we used. The more metrics we put into InfluxDB the more insight we gained. We were able to move from reactive to proactive. The load on the systems was doubling every year, so we knew we had to make sure we were prepared. And because of the insights we were able to invest in the next bottleneck so we could serve customers with the right quality.

Influxdb vient de sortir la version 3 de sa base de données (orientée time-series), avec une petite astuce sur le modèle de licence, pour continuer à faire de l’open-source sans se faire piller, comme certain de ses prédécesseurs.
Prometheus project documentation for Overview
An open-source monitoring system with a dimensional data model, flexible query language, efficient time series database and modern alerting approach.
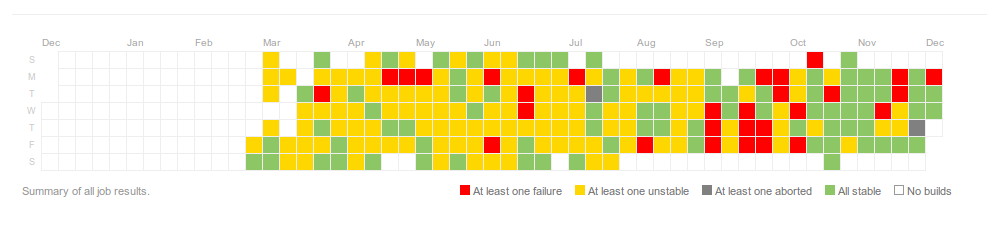
On Monday this week, the Prometheus authors have released version 1.0.0 of the central component of the Prometheus monitoring and alerting system, the Prometheus server. (Other components will follow suit over the next months.) This is a major milestone for the project. Read more about it on the Prometheus blog, and check out the announcement of the CNCF, which has recently accepted Prometheus as a hosted project.

End of year – let's look back on which services found their way into my HomeLab.