
What is Kubernetes? Scalable cloud-native applications
Kubernetes automates container-based application deployment, management, scaling, and more. Here's everything you need to know about K8s.
Kubernetes automates container-based application deployment, management, scaling, and more. Here's everything you need to know about K8s.
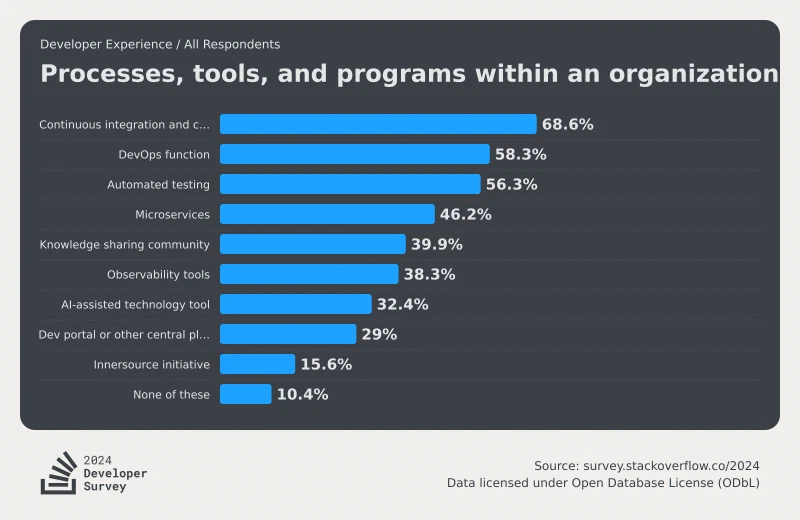
A survey of how code gets deployed and monitored, and how that impacts SWEs
Contribute to intel/ipmctl development by creating an account on GitHub.

An overview of my self-hosted setup in 2026, covering services running on Unraid, a root server, and a Raspberry Pi — including backups, and file sync.


Collecting Docker metrics with Prometheus
See what is new and what has changed with release 0.4.0 of Microsoft Open Service Mesh.

Enterprise bot detection shouldn't require a PhD in infrastructure (or thousands a month in expenditure to use!). Two lines of code, zero external...
Collecting Docker metrics with Prometheus
Never stray from the way.
This article provides detailed Kubernetes resources and learning paths, covering CNI, CRI, CSI and core technologies in cloud-native environments. We also share some important learning resources and methods to help readers further advance in the Kubernetes ecosystem.
Learn how to build your first Prometheus dashboard in Grafana.
Examples for using Prometheus Remote Write. Contribute to nickcharlton/prometheus-remote-write development by creating an account on GitHub.
How the Internet Identity canister uses its stable memory to achieve safe upgrades.

Learn how to secure your Kubernetes network using Cilium and NetworkPolicies in this article. We'll explain the ingress and egress policies, show how to visu...
Exploring a missing piece of the software observability stack to monitor business logic.
Talk resources for "Weighing a Cloud: Measuring Your Kubernetes Clusters", copresented at KubeCon NA 2019 with Han Kang.
Talk resources for "Operating within Normal Parameters: Monitoring Kubernetes", presented at SREcon19 Americas.
Monitoring systems have evolved over time to support evolving architecture styles and deployment strategies Generation X+1: Monolithic applications, …
How to monitor your machine learning models in production.

Enhance your own learning or give your students tasks that will build proficiency

A few weeks ago I was woken up with the following message "Hey, devices are randomly disconnecting from WebSockets can you come online and help?". Usually,...

Enable telemetry on your Nomad server and client nodes and use Prometheus to collect cluster metrics.
An overview over the tech I use

Learn how to set up and use Prometheus+Grafana to monitor a PostGIS backed Phoenix application
How to customize Navidrome to your environment
In previous blog posts, we discussed how SoundCloud has been moving towards a microservice architecture. Soon we had hundreds of services, with many thousand instances running and changing at the same time. With our existing monitoring set-up, mostly based on StatsD and Graphite, we ran into a number of serious limitations. What we really needed was a system with the following features: A multi-dimensional data model, so that data can be sliced and diced at will, along dimensions like instance, service, endpoint, and method. Operational simplicity, so that you can spin up a monitoring server where and when you want, even on your local workstation, without setting up a distributed storage backend or reconfiguring the world. Scalable data collection and decentralized architecture, so that you can reliably monitor the many instances of your services, and independent teams can set up independent monitoring servers. Finally, a powerful query language that leverages the data model for meaningful alerting (including easy silencing) and graphing (for dashboards and for ad-hoc exploration). All of these features existed in various systems. However, we could not identify a system that combined them all until a colleague started an ambitious pet project in 2012 that aimed to do so. Shortly thereafter, we decided to develop it into SoundCloud’s monitoring system: Prometheus was born.