GeistHaus
log in · sign up

AaLl86 Security

Part of andrea-allievi.com

An in depth looking in Computer Security, and low level OS Internals

stories primary
New Year post: Anti-cheat evolution in Windows 11
Uncategorized
Hello there! As usually, long time not updating the blog (8 months 😟)… good news is that this week I am on vacation, so I have a little more free time. There are two non-AI related technologies that me and my team created in the year 2025 that I wanted to talk about (in these […]
Show full content

Hello there!

As usually, long time not updating the blog (8 months 😟)… good news is that this week I am on vacation, so I have a little more free time. There are two non-AI related technologies that me and my team created in the year 2025 that I wanted to talk about (in these months, everyone seems to talk about AI, but that is another story):

  1. The Micro-executive, which allows the OS to updates PTEs on ARM64 respecting the break-before-making rule.
  2. An attestable Anti-cheat report, designed to prevent cheat kernel modules to be loaded when a game is running.

Since #1 is too much MM state machines, I have decided to go with #2. I can return to #1 in case I will get interest from readers. So what is an attestable report? Before talking about it, we should first give an introduction about how the TPM works, why it is important, and how it could be leveraged to protect against cheaters in competitive video games (I personally love Doom, but far to be competitive 🤣) .

So, let’s start by talking about what is a TPM. There is a lot of literature available online that generally describes the TPM, or Trusted Platform Module as a “dedicated security chip that securely stores cryptographic keys and performs cryptographic operations to protect your computer’s hardware and software integrity, acting as a root of trust for the boot process”. This definition is pretty abstract: the reality is that the TPM does a lot of things (interested readers can check the amazing “A practical guide to TPM 2.0” by Will Arthur and David Challenger). This write-up will not describe the TPM in details, but, for the sake of the “anti-cheat” discussion, the TPM:

  1. Provides a way for the OS to mathematically prove that certain areas of (boot) code and data have not been tampered with.
  2. Provides a way to external (or remote) entities to prove that they are really talking to a real authentic TPM
  3. Provides to the OS an hardware mechanism to store encryption keys that can potentially be made available only if the integrity of certain “measurements” is guaranteed.

This write-up assumes that the reader knows the theory behind the public/private (or asymmetric) encryption method. If not, I invite the reader to take a look at the public literature.

The TPM has a list of Platform Configuration Registers (PCRs) which supports a main cryptographic operation called “Extend”, similar, but not identical, to “hashing”: you can verify that an hash is correct only if you know the original data, but not vice versa (you can not recover the original data just from an hash). Similarly, a TPM Extend operation is another cryptographic function that securely updates a PCR by hashing the current PCR value with a new measurement, creating a cumulative, tamper-evident record. Thus, the Extend operation has another important property: you can extend a PCR every time you want, but the final result always depends on both the previous and new data, implicitly building a so called chain of measurements.

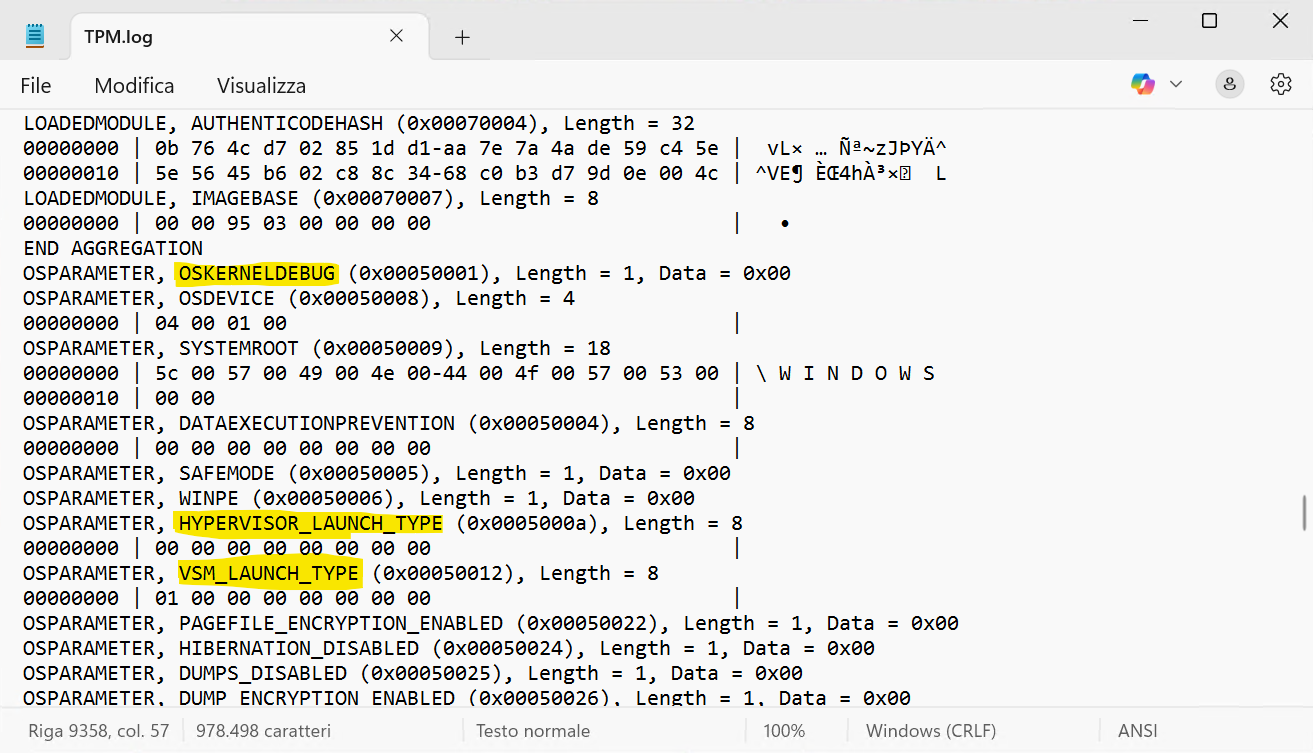
The OS maintains a “record” of the list of the measurements that generates the final PCR values in a “TCG log” (which does not have any size limit). The TCG log itself is not signed, but the final list of PCR values can be retrieved from the TPM with a Quote request (interested readers can take a look at the TpmApiQuote2 function), which is signed with an Attestation Identity Key (or AIK).

The purpose of the AIK is to sign data (PCR values) to prove that they originate from a real TPM, without having been tampered with. Hence, the AIK is the root of trust of the TPM. Careful readers can ask… how an external entity can prove that the AIK is really generated by a TPM?

If so, this is a nice question which requires going into a little more details. Every TPM is provisioned in its fuses with a secret Endorsement Key (or EK), which is particular per TPM, and by which the TPM never directly exposed its private part. The AIK, being a normal public/private key pair generated by the TPM, can be trusted in one of two ways:

  1. Using an AK (Attestation key) certificate chain, which is signed by a third party Attestation Certificate Authority, proving that the TPM is genuine (via its EK)
  2. Using the public part of the EK to encrypt (or wrap) the AIK public key. Since only the TPM can decrypt the public key, the remote entity can attest that the TPM is legit.

I know, is confusing… Skipping all the inner details (for those, take a look at these two articles: 1, 2), the reader should assume that the AIK is really the root of trust of the TPM, and it can not be forged. This means that the TPM quote can be attested to be correct and generated by a real TPM.

But, since any extend operation can not be forged either, with the TCG log and the signed TPM quote, a remote entity can attest also that every measurement is correct (thus, since the OS loader measures various parts of kernel code and data, the remote server can also be sure that the OS boot has not been tampered with).

We only need to discuss the last piece of the puzzle. Certain encryption keys used by the OS can be generated via the TPM and can be “sealed” using the content of certain PCRs being in a particular state. Thus, on the next boot, in case a single PCR value is not what is expected by the TPM, the TPM will refuse to “unseal” the key.

Furthermore, the OS can also measure the value of the public part of an encryption key previously “unsealed” by the TPM, allowing a remote entity to indirectly verify that the key has been generated in a “trusted” baseline (since the public part is present in the TCG log, and the final PCR values are signed).

We explained enough TPM details which are fundamentals for the attestable driver report. Let’s see how this work and the problem that is going to (try to) solve… Note that the TPM is usually implemented as a small chip soldered in the computer’s main board. The Microsoft Pluton implementation (and other form of newer TPMs) can also be soldered in the SOC (system-on-chip), making very difficult for a person to forge it or bypass its security characteristics.

How people cheat in video-games

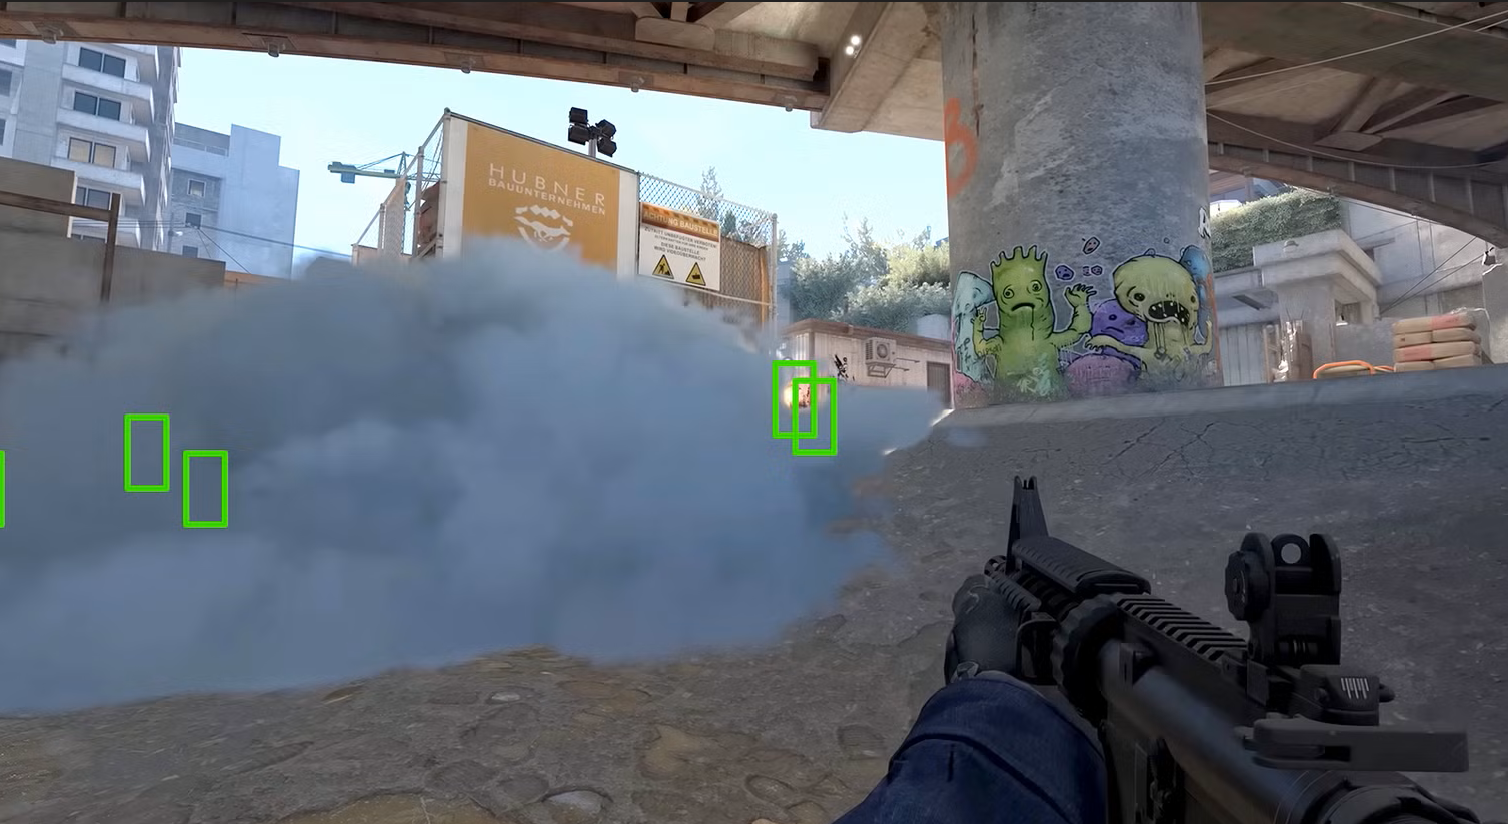
There are a myriad of ways for a player to cheat in a competitive video game. I never really understood how people enjoy winning a match in a unfair way, but I am probably too naïve (especially since now there are also tournaments where players win monetary awards). Anyway, to summarize, a technically skilled player can cheat by:

  1. Modifying the code or data of the game engine directly from another piece of software (in this case we say that the CPU is modifying the target game memory).
  2. Using specialized hardware able to perform malicious DMA to transparently change the content of the game engine code or data in memory while the game is executing.

There are multiple game vendors and companies that have created anti-cheat solutions to mainly prevent cheating using external software (case #1 described above). The solutions kind of work well, and usually execute in a higher privilege environment than the video game (for example, a kernel driver or even a customized Hypervisor). Solving #2 is not trivial. A game can always require a IOMMU (again, I assume that the reader knows what a IOMMU is, if not, check here) and refuse to start in case it is missing or disabled, but the IOMMU is not always able to protect malicious DMA into the entire VTL 0 memory, where NT kernel and drivers resides (note that the IOMMU protects the entire secure memory where the Hypervisor and Secure Kernel run though). This is because of performance and complexity reasons which resides in the Memory manager implementation (remember, players do not want to loose a single frame and Windows should still be competitive in Gaming).

So, how we tried to solve the issue? Since we could not prevent malicious DMAs to happen – cheaters have also built faked PCI-Ex peripherals (for example disguised as sounds cards) for being able to pass undetected by the anti-cheat engines – we used a different approach: an attestable driver report.

The latest Windows Insider release (or the future 1B non-security patch of 25H2, which will be available in January 2026) includes a new API available only when HVCI is on, and callable from any user-mode application: GetRuntimeAttestationReport (note that the following definition is included in the latest Windows Insider SDK).

#define RUNTIME_REPORT_PACKAGE_VERSION_CURRENT  (1)

typedef enum _RUNTIME_REPORT_TYPE {
    RuntimeReportTypeDriver = 0,
    RuntimeReportTypeCodeIntegrity = 1,
    RuntimeReportTypeMax
} RUNTIME_REPORT_TYPE;

BOOL GetRuntimeAttestationReport (
   UCHAR* Nonce, 
   UINT16 PackageVersion,
   UINT64 ReportTypesBitmap, 
   _Out_ PVOID ReportBuffer, 
   _Inout_ PUINT32 ReportBufferSize);

A user-mode application would initially calculate the needed memory buffer size by simply invoking the API specifying a 32-byte nonce (containing random bytes) and a UINT32 bitmap containing bit 0 set to 1.

Then, the application allocates a new memory buffer, and call again the API: this time the system will invoke the Secure Kernel (via a QUERY_RUNTIME_ATTESTATION_REPORT secure call). The Secure Kernel generates a signed and attestable report containing descriptors for all the kernel modules ever loaded by the OS (yes, it also includes unloaded drivers) and copies it into the target buffer.

Before understanding which kind of information a game can extract from the report, and discuss how the report is composed, let’s take a step back and understand how a remote entity (the video game server in this case) can prove that the report is intact and produced by the Secure Kernel, which is considered part of the TCB (Trusting computing base).

Remote Attestation of the Driver report

What does a game engine can do when it has obtained a signed driver report? Why this can be helpful in detecting cheaters? Astute readers should probably already know how to answer these questions… but let finalize the topic here to clear all the doubts (or at least I will try)….

In the first part of this write-up we talked about the TPM and how the system can retrieve a signed TPM quote. A TCG log instead contains all the measurements that made to the final values of the PCRs contained in the quote. Note that on boot, Windows measures the status of many security features, like whether HVCI is on, the presence of a IOMMU, of any debugger, and so on…

A snip of a test system TCG log obtained via the PCP tool or the TBSLogGenerator showing that there is no Kernel debugger attached and SK has been correctly started.
A snip of a test system’s TCG log obtained via the PCPTool or the TBSLogGenerator showing that there is no Kernel debugger attached and both the Hypervisor and Secure Kernel are going to be started.

This means that, when a competitive video-game server wants to verify (or attest) that a player is using the game in a safe environment it can:

  1. Ask the TPM quote, a copy of the TCG log and the Driver report to the client’s game engine. The client transfers the data to the server via regular means (TCP/IP connection, named pipes or similar…)
  2. Starting from a value of 0, reproduce the various measurements listed in the client’s TCG log. At the end, the server calculates the final PCRs values.
  3. Compare the calculated PCRs values with the one located in the TPM quote. If they do not match, it means that the client environment has been modified (so the game should not be allowed to continue).
  4. Otherwise, verify that the TPM quote is signed correctly by checking the public part of the AIK. This means that it has been generated by a real TPM (these four described steps are part of the standard “attestation” procedure).
  5. If the security properties enabled in the client system (and measured into the TCG log) are the ones required by the game, proceed in parsing the Driver report. Otherwise stop and do not allow the game to run.
  6. Check the driver report signature: the public part of the signing key should match the Secure Kernel signing IDK, which has been measured into the TCG log. This proves that the Driver report has been really generated by the Secure Kernel, which is part of the TCB.
  7. Parse each kernel module listed in the report. Check each hash and blacklist any driver that has been signed by a malicious actor, drivers that are known to contains bugs exploitable by a cheater, or kernel modules that are used to control malicious hardware (like the ones that perform faked DMA transfers).
  8. If all the verification succeeded, allow the game to run. Every arbitrary number of minutes, request a new driver report from the client. Note that the TCG log is not needed anymore, as long as the TPM quote does not change (which means that the system integrity has not changed).

It does not matter if the malicious driver has been unloaded after performing its game modifications for allowing the player to cheat: the report will also list kernel modules that have been briefly loaded and then discarded.

Careful readers can ask… what if a cheating kernel module is loaded manually, without notifying the OS? In that case, the driver would be still listed in the report?

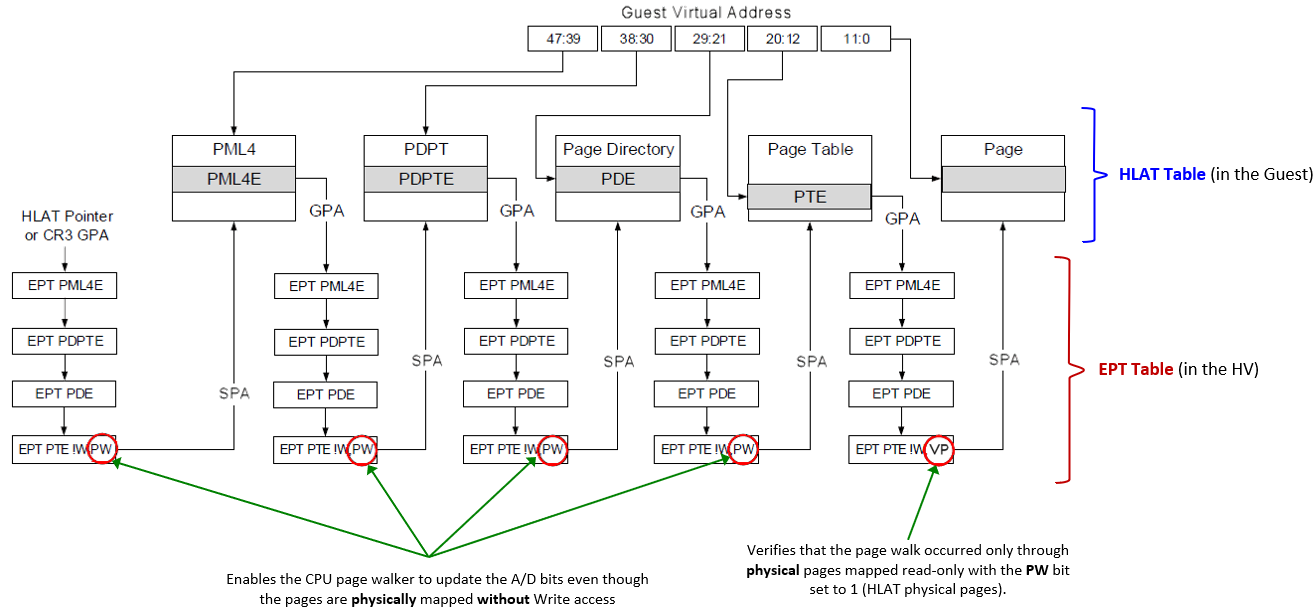
Yes, correct, in that case the report would miss it, but there is a catch. Since the driver report is available only when HVCI is on, there is no way in which a cheater can load any kind of executable code in NT, without passing through the Secure Kernel (which is trusted), since all Kernel memory is marked as not-executable in the Hypervisor Stage-2 translation tables (or in the Second Level Address Translation in Intel terms).

Content of the Attestable report

At the time of this write-up, Windows supports two types of attestable reports: code integrity and drivers. Explaining what a is inside the Code Integrity report is outside the scope of this blog post. Instead, a driver report contains a list of kernel module descriptors (described by the _DRIVER_INFO_ENTRY data structure, contained in the “winnt.h” file of the public Insider SDK) and a bunch of flags.

An individual kernel module descriptor contains the following data:

  • A human readable name of the NT kernel module.
  • The full image’s SHA256 hash.
  • The SHA1 hash of the entire module’s leaf certificate that has passed code integrity validation (this can always be the same for each WHQL driver, that is why we added also the OEM name).
  • The number of loading and unloading times
  • A human readable string of the OEM name stored in the authenticated OPUS block of the digital signature
  • Some flags describing the state of the module (whether is currently unloaded, or whether is an hotpatch).
Conclusions and possible attack vectors

The technique discussed in this write-up is aimed to prevent cheaters to easily modify a game engine with the goal to have unfair advantages in competitive gaming. In this blog post we voluntarily did not talk about possible attack vectors, leaving it as a homework for the readers (spoiler: there is an attack vector that is very hard to be laid out).

Note that describing why the Secure Kernel and the Hypervisor are part of the Trusted Computing Base (TCB) is outside the scope of this write up, since it will require another entire article. The idea is that if one of these two components is owned by a malicious actor, is already a game-over (and the system would be owned). A lot of technologies like Secure Boot, Secure Launch, Trusted Boot (and others…) exist to protect and keep them part of the TCB.

I would be happy to talk about possible bypasses that the reader can find. If you have some questions or you want to discuss a possible attack vector just drop me a message on X (my handle is @aall86) or via regular e-mail (info@andrea-allievi.com)

This is all for now folks!

Wish you all a Great Year 2026! 🎉🎉🎊

Andrea

https://www.andrea-allievi.com/?p=754
Extensions
A MiniKvm to rule all machines … remotely :-)
Uncategorized
(sometimes you need to learn something new and adapt) Hello everyone!Today I want to deviate a little from the classical “low-level engineering” post (another one will arrive soon 😃) and describe a project by which I started to work more than one year ago. Randomly enough, two Chinese companies already copied it, but I will […]
Show full content

(sometimes you need to learn something new and adapt)

Hello everyone!
Today I want to deviate a little from the classical “low-level engineering” post (another one will arrive soon 😃) and describe a project by which I started to work more than one year ago. Randomly enough, two Chinese companies already copied it, but I will not say their names here because is useless.

At work, I always need to deal with test machines to debug and experiment with kernel code that I write and requires new hardware (HLAT and LASS being the latest). When I travel back to my home city in Italy, I am at 9 hour behind the Redmond time zone, and often it happen that my code does not work as expected, or the machine hangs without being able to access the debugger anymore (something similar happened too, like the need to access / modify some settings in the debugger). So what to do?

Back in the days I was waiting the “raising” of the American morning (which starts at 6PM in Italy) to ask some colleague to restore my test machine, but this was not working anymore for a lot of issues that the reader can imagine… 😔

So, after some researches in Internet, I was not happy about the cost, the performance and the characteristics of the multitude of KVMs already available on market. I knew that I could have done something better, so I decided to study and deal with C#, Direct Show, Media Foundation and high level APIs that Windows provides to manage Video/audio and multimedia processing. Note that I never really programmed anything serious in the Multi-media world, or either in the high level C# language (something that happened last time in the high school, and I am 38 years old now 😗), but… after some trivial newbie mistakes, I had a lot of fun with these technologies (I found C# and .Net in general pretty great).

Before begin let’s say that for this post, all the material has been published in my GitHub account, under the MiniKvm_public repository.

How let’s start with the basics: a KVM stands for Keyboard, Video and Mouse. For my idea, I needed all of those, but also the ability to control the power supplied to the target machine. Thus, I decided to divide the problem and start with just the power: I wanted to be able to switch on and off (or power cycle) a target machine….

KVM Power interface

Controlling the power interface of a target machine was actually pretty easy. I knew some basics of electronics and I knew also that transistors (BJTs and MOSFETs) can be easily used to pilot the “Reset” (and others) pin of the motherboard of any workstation. Cool, but what about situations in which you can not control any MB PINs (for laptops or customized devices that do not exposes power PINs)?

Simple, similar to Transistors, another common component heavily used in electronics is called Relay. A relay is a electrically operated switches that open and close the circuits by receiving electrical signals from outside sources. It is similar to a transistor but it can operate on way higher currents (like 120 and 240 V, the same current as the standard appliances work in our day-to-day life).

For power, I’ve learnt the basis on these electronic components and I wired them up using a cheap Arduino controller, which is piloted by a USB-to-Serial connector, allowing me to “talk” to the relays and transistors via a serial port. Initially I had fun programming the Arduino controller and building the base electronic board for controlling the relay and transistors. I attached two relays at the 120/240 V power line, making me able to switch on and off two workstations from their main power supply. I then added two transistors, able to briefly “close” the circuit for the “Reset” and “Power” switch of another two test machines.

You can check the code for the Arduino controller here: https://github.com/AaLl86/MiniKvm_public/blob/main/Arduino/RelaySensor_board.ino. Furthermore, you can find more information on transistors and relays here, here and here. Since assembling something similar is trivial, I will not continue with more details on the “Power” part… let’s switch to the “Video” part…

High speed video input

A basic prerequisite for my KVM was that it would have been able to pilot at least a Full HD resolution (1920×1080) at high speed, minimum 30 FPS (but ideally 60. I ended up with this prerequisite after trying to use some commercial KVMs used to manage test systems in our lab… they literally suck… and the excuse was: why do you need high resolution or high speed? After the bootstrap you can use RDP. This, in my opinion, is not always true and is not a good excuse).

Thus, armed with some patience, I searched online something like “Video capture” and I found that a lot of stores already commercialize products like the one I was looking for, especially for video game streaming (XD). A video capture card like this or this are able to accept as input a 4K signal and capture it at a good resolution of Full HD (60 FPS) or 2K (30 FPS. Note that this is the output resolution). They are pretty cheap and perfect for the goal (only problem is that they only works with HDMI interface for some reason. At the time of this writing, no affordable Displayport capture cards exist, I have no idea why).

So great, I had the device, but now how to deal with it? I needed an API to access it and to manage the frames it captures. Luckily enough, after some testing and research I found that all these kinds of device uses the same “Camera” Pnp device setup class as the webcam included in your laptop. Great news… this means that the same programming interfaces used by the Camera App (included in Windows 11) could be used for my KVM. I bought one of the video capture card from Amazon and I tested it, and yes, my camera App was able to show the screen output (BIOS included) from another workstation. Great, would have been better only if I knew how to capture video and audio from a Camera…

Even here, a quick look at MSDN helped a lot (and also a look at the myriad of open-source camera applications available on the Web helped too). Since the code to interface with these devices is pretty messy, here is a recap on the two main technologies available in Windows:

  1. DirectShow – The classical interface built in the Windows 2k era. Entirely COM based, pretty well documented in MSDN and obsolete. I did some experiment with a MFC application and I was able to enumerate all my devices, their supported resolution and acquire some video input in around 6 hours
  2. Media Foundation Platform (MFP) – The next generation multimedia platform for Windows. Still COM based, but exposes a brand-new API set (the majority exposed in the “mfapi.h” header) which I found decently to use. Fully documented in MSDN. I did some experiments with MFP with another MFC application and I succeeded in capturing the video stream from the video capture card.

There was a big problem that I needed to solve though. The acquisition of Full HD uncompressed signal require a lot of bandwidth, in terms of CPU power. Thus, showing the original “untouched” captured signal on the screen was pretty trivial, but when the window was resized the problem started to arise. I tried to deal with the C++ IMFSinkWriter class, but I found it pretty cumbersome to use in my entire project. Plus designing a modern GUI solely with Win32 and MFC was an hard and time-consuming job for a free-time project like this. … So it was time to move to C# and see if some available library could have been able to translate Media Foundation or DirectShow in a handy .Net class.

I do not want to discuss all the implementation details here, but just to give to the reader an overview. C# is great, fast and effective, and I found various pretty easy-to-use libraries able to acquire video frames from a camera and display in a Windows Forms Control (like AForgeNet for example). All of these libraries were great, but they were still suffering of the same issue when the video was not displayed in its original resolution: performance: each frame was resized with GdiPlus, which is great, but not designed to deal with this huge quantity of data.

A uncompressed Full HD frame size is around 8 MB. Thus, my new algorithm should have been able to resize in 1 second around 474MB of data (8MB multiplied by 60 FPS). Something that a single core of my little host machine could not stand (a dual core Celeron 630SE TigerLake-U based. One of the goal of this project was to be able to run and scale well also on mini-PC and economic systems) . So, I scratched my head to try to find a solution, since GdiPlus was not able to resize all frames fast enough to condense more than 25 FPS.

I need to admit that I spent multiple nights trying to solve the issue… I tried two main strategies:

  1. Process each frame with multiple cores. Assuming that in 1 seconds the KVM was receiving and processing 30 or 60 frames, with a lot of patience (and correct synchronization) I could have each core resizing individual frames, and then combine back the result in a new contiguous video stream.
  2. Compress the individual frames or the video signal using codec like MP4, HEVC and so on…

Solution #2 was too difficult for me to achieve, since I have no idea how a video compression algorithm really work, and learning all the details was really too much (Again, I am not a video or multimedia expert). In one week I kind implemented #1 (with a lot of issues, since doing the frame synchronization correctly is far away for being easy), and the results were ok, but still not enough. I was able to touch around 48 FPS by saturating all the two cores of my slow Celeron. I was still curious to understand how commercial video applications scale well also in slow systems.

I was almost giving up when I discovered Emgu Cv. This library is great, and is the only one that I found that does not rely on GdiPlus to resize bitmaps. And guess what? The implemented resize algorithm is fully parallel, meaning that is automatically able to scale to multiple cores. Thus, I deleted all my code and performed the resize with a simple:

Boom! 60 FPS with 2 Celeron cores at around 90% of their utilization – Mission accomplished (faster than the default Camera App of Windows. Thanks Emgu CV, great job, better than my naive implementation)! Note that I skipped all the issues that .Net brings when processing high density frames and somehow you screwed up with memory allocation / freeing (thanks Garbage collector!). It has lead my little host machine to leak 4 to 8 GB of commit on my MiniKvm process in less than 10 seconds 😂.

High speed HID over USB

Now the hardest part… how to send HID (Human Interface Devices) command via a USB cable? One obvious solution was to design a brand-new USB miniport driver that somehow accepts HID commands coming from one side and transfers it to the other side. But this was a little too complicated since it required messing up with the USB driver stack of the OS (plus, I needed to study all the USB HID specifications, published here, and not immediately trivial). So, I searched on Internet and I stumbled upon a solution that was turning a Raspberry PI into a USB keyboard (here), plus bunch of other home-made ones (see here). None of them worked, since they require “special devices” which were not compatible with my design (I wanted to control multiple targets from a single host).

While I was starting to study the specs for the worst solution ever (writing a new USB miniport driver), I discovered on AliExpress the perfect controller, called CH9329 😊. This chip is basically a Serial to HID converter, is extremely chip and does its job in a very great way. There was only a problem: while the chip datasheet was public and easily downloadable (see
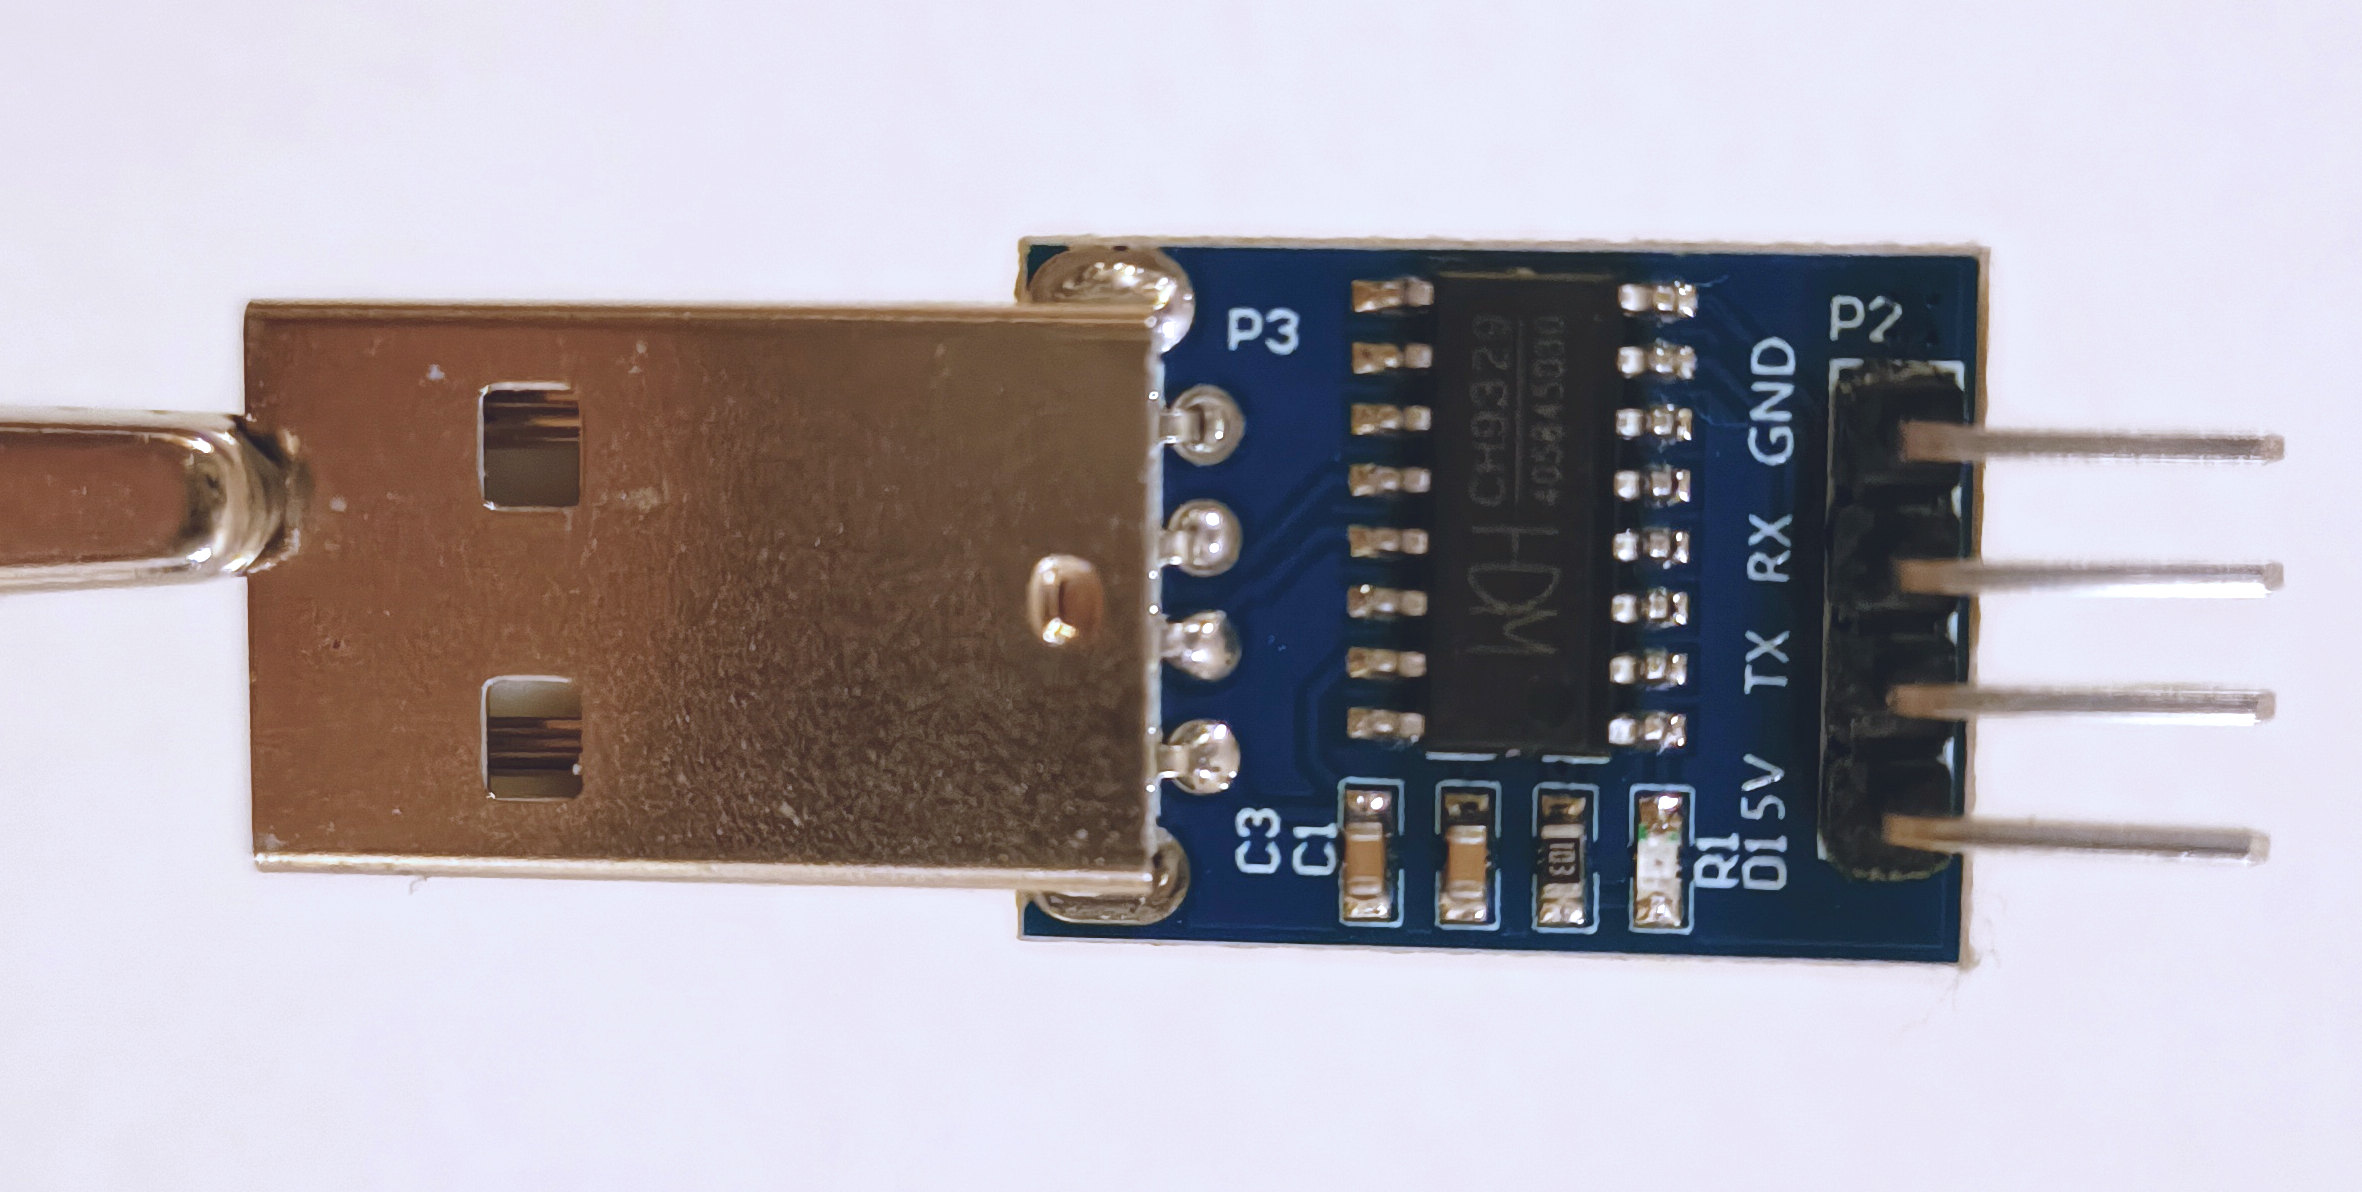
 here), its “Communication Protocol” was not, making almost impossible to use all the features of the chip. Luckily enough, after multiple hours of research (using also peer-to-peer networks), I was able to find the Chinese version of the protocol specifications. I do not speak Chinese, nor I am able to interpret it, so I got the idea of using one of the free translation service (like this one for example), and voilà… I got my English protocol specifications (published on my GitHub).

Armed with the new specs, I bought a couple of USB-to-Serial adapter on Amazon, a iron soldering kit and I started to assemble the final cable. The final cable created a Serial port on the host, which I could have sent command to, while the other side of the cable was identified by the target system as a “USB keyboard and mouse”. Perfect! 👌

After a lot of night spent in implementing the CH9329 protocol in C# and testing it, I was able to:

  1. Fully control the keyboard and mouse of the target device
  2. Re-program the CH9329 chip to operate at the full speed (by default the chip operates at 9600 bps) and to identify itself to the target machine with a customized USB descriptor.

The results were great: I was fully able to move the mouse, and press keyboard keys remotely with a very fast speed (with video at 60Fps the delay is almost imperceptible, unless you play FPS video games I guess 😗). I published the entire class used to send and receive commands to the CH9329 in my GitHub MiniKvm project, here. If you are curious, here is the main routine used to assemble any CH9329 packet:

Putting everything all together: MiniKvm

Creating a fully fledged easy-to-use application was not easy at all, but it allowed me to learn “how to use” high level languages and to deal with problems that I was not aware they could exist (like the frame compression, video processing, memory leak on C# applications and so on…). The resulting application is at version 1.0, meaning that is fully stable and supports:

  • Video acquisition up to 4K resolution at 60FPS (depending on the acquisition device), including full screen support and dynamic resizing
  • Piloting keyboard and mouse of the target device, with synthetic multi-thread copy/paste and special commands (like CTRL+ALT+DEL)
  • Power switching the target device, through a fully XML configurable “home-made” Arduino solution or others (MiniKvm includes a XML parser for the describing power switch commands, still no GPIOCXL support though 🥹)
  • Support up to 16 target machines from one single host (but this limit can be raised if needed), which can also be used at the same time (depending on the host CPU speed).
  • All of this by employing hardware that everyone can buy / access, that costs less than 100 USD (see the project readme file for details).

Now that I have spoken already too much, let’s see my amazing video creation skills able to assemble a 10 minutes video explaining all the details of how this work:

https://youtu.be/q4mnAL9lZvM

Note that this is one of my first YouTube video, so I do not promise anything regarding its quality 😁. If you like this project, feel free to send me a mail (info@andrea-allievi.com) or reach me on X (@aall86) for contributing to it (I am always looking for new contributors). Indeed the project needs to have the following features added:

  • A fully fast and secure HTML dynamic interface, reachable on the web (removing the need to RDP to the host machine)
  • Audio support
  • Support for recording the target device video and audio
  • Supports for the GPIOCXL driver stack, needed to access the integrated GPIO interface of certain motherboards (like the Aaeon one used for my test).

That is all for now folks! Thanks for reading. I hope that you enjoyed this post as I did in designing this thing 😊

For the next blog posts I will be back in describing low level OS problems, Windows Internals tips and tricks as before…. Stay tuned! 😉

Andrea (aka AaLl86)

https://www.andrea-allievi.com/?p=726
Extensions
Downgrade attack: a story as old as Windows…
News
As usual, it is long time that I do not update my blog… my bad, I am always kind of bad in finding free time between projects and personal life (I am almost finishing an amazing Kvm to allow me to remote control any machine from the UEFI BIOS, but this is a huge story […]
Show full content

As usual, it is long time that I do not update my blog… my bad, I am always kind of bad in finding free time between projects and personal life (I am almost finishing an amazing Kvm to allow me to remote control any machine from the UEFI BIOS, but this is a huge story for another blog post). Today, after I have been asked multiple times, and after reading some analysis on internet (like this one from @_0xDeku), I would like to talk about an attack old as the early days of Windows… the rollback attack.

Back in the days, more than two years ago, I have received some weird bugs to take care of, regarding the unexpected possibility to replace the “securekernel.exe” binary with an older version in a fully updated Windows OS. My first thought was… of course, … did the person that opened the bug just discovered the “warm water” 😂?

The entire Code Integrity module and Windows image verification system were never invented to support such-a-scenario. Everything that MM and CI (in all their implementations) do is to verify that the module being loaded has the proper digital signature, and is signed with the proper verified timestamp… it does almost nothing to verify that the current version is below the latest available or ever run.

So, after a brief discussion with some coworkers, I closed the bugs as “by design” without too much of thinking, since fixing the bug was requiring an entire re-implementation of the way by which Windows was loading every boot and runtime image (and not only the Secure kernel or modules belonging to the virtualization solutions)…


…every problem comes from trust…

But let’s step back for a moment and let’s discuss why preventing rollback in a secure way is a difficult problem to solve. Let’s put ourselves for a moment in the skin of an attacker that wants to exploit a bug in an old version of… let’s say… the Hypervisor:

  • Good starting point is to replace a original Microsoft-signed hvxx64.exe (where, as you know, the first “x” depends on the platform architecture) with an older version that has the bug, and hope for the best to not break the thin layer of binary compatibility between the Hypervisor, Secure Kernel and regular NT kernel (as a note I originally though that this layer was waaay more sensible, but I was wrong)
  • At this point, let’s assume that a minimum version list exists, in a form of a file, a registry key or whatever…
  • At this point what the attacker would do? Easy, he/she would replace also the “minimum version list” with an older one.
  • This can be done also if the HV loader will refuse to load the Hypervisor binary due to a version mismatch: he/she can replace also the OS loader binary.
  • As you can imagine, this behavior can be repeated in a chain, until the attacker is in a position to replace everything in the chain which verifies the version of the target “leaf” module.
  • Even worse, assume for a moment that the version of the “minimum version list” file is hard-coded into the OS loader, the attacker will replace the OS loader itself.

More than one year ago, I was officially asked to resolve this issue, and I started to scratch my head, with the goal to find a solution for it… After many meeting and talking with other teams, … What did we end up with?


What is a good “root” of trust?

So, as the reader can see, the problem can be solved by defining what is the “root” of trust, an entity that can not be replaced or spoofed and that will provide the initial verification for the next stage of truth. Windows already supports an entity like that, and MS also made it mandatory for Windows 11: the TPM. Readers can ask: why the TPM can not be spoofed?

The answer is simple: because it uses asymmetric cryptography to produce and sign an “attestation report” which contain a “TCG log” containing all the measurements of code (and data) that the firmware and the boot / OS loader executed (remember: a measurement is an hash – usually SHA256 – of a particular data or code. Measurements can only be extended, never deleted or reset. For this and other TPM concepts, I will let the reader to take a look at the great “A Practical Guide to TPM 2” book, which is even free in its PDF edition).

How the signing process using asymmetric encryption works is described in my Windows Internals book (look at the section about Secure boot in Chapter 12), but is not the only part of the motivation. The final part of this (long) story is that the TCG log (and thus everything measured by the TPM) is signed with the so called Attestation Identity Key (AIK, to be specific the private part of it) which is generated in hardware by the TPM. Trust in the AIK is established through a process (I do not even know all the details to be honest, it is signed or something) that transfers trust from the AIK to the root Endorsement Key (or EK). The EK is a unique, non-migratable asymmetric key embedded (or “fused”) into the TPM during manufacturing. Note that attackers can not extract or forge the EK, hence the root of trust is intact.


Putting together the pieces of the puzzles – WDAC policies

After having identified the “root of trust” I should have chosen a technology able to express all the requisites for a “minimum version list”. While designing complex solutions, it is always a great idea to start with something that already exist, and see if it can be adopted for the new requisites. After a couple of weeks used to deal with the requisites, my amazing colleagues in the Code Integrity team shows me the “WDAC policies”, also known as Windows Defender Application Control policies.

Readers can find all the specs here: Application Control for Windows | Microsoft Learn. Without going into too much details, a WDAC policy is a XML file with descriptors specifying whether to block or allow the loading of a image based on various rules. Customers can create their own policies and feed them to Code Integrity (CI) using CiTool or Powershell. At the end of the day, the new policy will be stored in the Windows system directory (“\System32\CodeIntegrity\CIPolicies\Active”) or in the EFI system partition (“\EFI\Microsoft\Boot\CiPolicies\Active”). All the policies are consumed by the Boot manager or OS loader (in the former case, boot applications can also be blocked).

This blog post does not want to cover all the aspects of the WDAC policies, but just provide to the reader a simple overview.

A WDAC policy XML file is composed of the following sections:

  • The “Rules” section describes the global policy control options, like Audit mode, WHQL requirements ans so on (described here). The section is mandatory
  • The “FileRules” section describes a list of files (and their characteristics) to where the rules should be apply to. File rule attributes are described here. As the reader can see, a WDAC policy can identify a file via a lot of ways: FileName, Hash, Path, Signer and so on…
  • The “Signers” and “EKUs” sections describes the digital certificate used to sign a particular file. Signers and files are usually connected via the “FileAttribRef” attribute (this is important since this link apply the signature search to the correct files)
  • The “SigningScenarios” is the most important one and describes each class of rule to apply.

There is a lot of documentation available on the web, thus interested readers can consult it. I found a pretty good documentation, written by an external individual contributor (@CyberCakeX), available here: https://github.com/HotCakeX/Harden-Windows-Security/wiki/Introduction.

So, we created an individual WDAC policy file, called VbsSiPolicy (and present in your insider release system under “\Windows\System32\CodeIntegrity”) which contains all the minimum version of all the modules located into the TCB (I am speaking about OS loader, Boot drivers, HV and VBS modules). From now, in this blog, I will call this WDAC policy as “Anti-rollback” policy.

The Boot library loads the initial policies located in the EFI system volume very early in the boot process (see BlSIPolicyCheckPolicyOnDevice for those who are interested). After the boot volume (which may be Bitlocker encrypted) is unlocked and the execution control is transferred to the OS loader, the VBS policy file is loaded, parsed and activated. From now on all the TCB modules need to pass a minimum version check…


…but… so, what? How does the OS defend against bad attackers?

If the reader asked this question it means that she/he is on the right track: an attacker can replace the policy file itself with an old one, or replace Winload too. How to deal with this?

Here is how:

  1. The OS loader, after it has calculates the VBS policy (described in the Windows Internals book, not to be confused with the Anti-rollback policy), checks whether the anti-rollback policy has been correctly loaded by the OS loader (every policy is identified by a GUID), and, if not, or if the version of the policy is less than the hardcoded one, it immediately crash the system
  2. All the SI policies (included the anti-rollback one) are always measured by the TPM (in PCR 13). This means that remote parties, through attestation, can verify whether the anti-rollback policy is present on the system.
  3. The main idea is that the anti-rollback policy version and hash will be tied to the PCRs used to seal the VSM master key. Every time an update is delivered to the target system, the VSM master key ring will be predictively re-sealed using the new anti-rollback policy version.

As informed readers know, the main entities of a system that need to be protected are the secrets that it stores. All the secrets in Windows OS are stored in VSM. Hence, via the scheme above, it is still true that an attacker can replace the OS loader and the anti-rollback policy (and potentially the system will survive), but, in that case, all the secrets are irreparably gone, achieving the protection that we desire (talking about Windows Hello or all the secrets stored in VTL 1 is behind the scope of this blog post).

Useless to say that the schema above is extremely simplified, since there are a lot of problems that I have not even mentioned, like:

  • The TPM is mapped in the NT kernel via classical MMIO, which means that attackers can act like “men in the middle” between the communication from the Secure Kernel to the TPM.
  • Updating the Anti-rollback policy after an update means that people can not uninstall the update (unless loosing all the secrets stored in the machine), and this is not acceptable, since Windows runs in millions of different system, and sometime it happens that the update screw something.
  • Some updates are delivered with Hotpatches (you can read about the NT hotpatch engine here, admiring my incredible terrible Excel drawing skills 😊), which are binaries that can not live without the old base image.

So, long story short, solving correctly this problem is far away to be easy!


How to debug this black magic?

Part of what I discussed here is already implemented and distributed in Windows. I downloaded and installed the public Windows Insider release build 27695 from the official website (which, at the time of this writing is already old), and did some investigation…

First, useless to say again that initial legacy WDAC policy are processed very early in the boot process, before every kind of debugger connect. So how to debug that? Easy, using JTAG (Exdi) or QEMU. Speaking of them, SourcePoint does a good job in stepping through the initial BootMgr code. The strategy is to exploit a UEFI shell and the JTAG break that Alexis and I implemented long time ago. A picture is better than any explanation:

Efi shell launching Bootmgfw with the JTAG break

If you do the same and then you break into the JTAG debugger you will realize that the code execution is stuck at a very initial stage of the EfiMain entrypoint of the Boot manager:

From there, you just need to set the byte addressed by the BdInfiniteLoop symbol to 0 and set your breakpoints. Reverse engineering the Bootmgfw binary with the symbols is trivial and you can find references to the term “SiPolicy” there and in the OS loader using IDA (spoiler: a good starting point is the BlSIPolicyPackagePolicyFiles routine).

Note that a lot of Code integrity code works only when Secure Boot is on. I have been able to install customized Secure boot keys in my QEMU virtual machine, and realized that in the AAEON board keys are already loaded by default, which mean that you can debug it (using the JTAG EXDI interface connected to SourcePoint) with Secure boot ON and witness also other WDAC policies being applied (like Secure Boot policies, which prevents the enablements of classical kernel debuggers).

I think that this is all for now folks! It is clear that I expect Yarden and some other Internals people to dig deeper and explain what I missed here 😊.

See you in the next blog post!

AaLl86


REFERENCES

https://www.andrea-allievi.com/?p=676
Extensions
Debugging the undebuggable – Part 1
Uncategorized
A lot of people nowadays ask me how, as part of my job, I debug UEFI firmware images, initial boot code and boot transitions. This happened in particular actual after the release of the excellent analysis by ESET of a new powerful UEFI bootkits, BlackLotus, able to extract the Bitlocker master key and bypass Secure […]
Show full content

A lot of people nowadays ask me how, as part of my job, I debug UEFI firmware images, initial boot code and boot transitions. This happened in particular actual after the release of the excellent analysis by ESET of a new powerful UEFI bootkits, BlackLotus, able to extract the Bitlocker master key and bypass Secure Boot.

Internally in my company, we have worked a lot for improving the debugger experience (especially in the HV and SK world, with a lot of new cool features). Last week, my colleague Alexis (who is the “debugger” guy 😊), told me that one of those amazing feature that we built was release publicly: WindbgExdi (which has the source code available here).

Before explaining what WindbgExdi is, let’s do an introduction on how, in the year 2023, companies approach (or at least they should approach) the debugging “problem” for Firmware and super-low-level code:

  1. Using a JTAG probe, which interfaces directly to the CPU. A JTAG Debugger is usually very expensive and is directly tied to the hardware that you are debugging. Examples of JTAG probe are here and here. Due to the complexity and cost of these solutions, this kind of debugging is not very diffused.
  2. Using EXDI (Extended Debugging Interface) over DCI (Direct Connect Interface). This is a technology designed by Intel (I have no idea if AMD has a similar one) to allow developers to debug the whole system without depending on a software provided debugging mechanism.
  3. Using a Software emulator or an Hypervisor with integrated hardware debugger.

You can think of DCI as a technology that forward trace and debug data coming from a specialized debugging interface integrated in the CPU (the Trace Hub) to a DCI transport. The DCI transport can be out-of-band, or OoB, independent of the USB protocol; or in-band, referred to as USB Debug Class. The in-band DCI uses the USB protocol to communicate with a debug endpoint in the USB controller. Both methods communicate with various different debug agents in the SoC to perform debug communication, run control, DMA, and trace. While OoB DCI requires still specialized hardware (but way more generalized and cheaper than JTAG), in-band DCI requires only a “special” USB cable. My friend Satoshi, 2 years ago, released an excellent guide on how to debug over DCI. I suggest interested readers to read it.

EXDI-over-DCI is very powerful, but does not work in production environments (unless hacked, as Satoshi stated in his guide. DCI is so powerful that having it enabled in production would have been a big security vulnerability indeed). So how an amateur or a Reverse Engineer can debug those sort of things without loosing hours with dummy “println-style” debug?

The answer arrived with the software emulators and certain Hypervisor solutions. Both QEMU and WMware for example supports a GDB debugger integrated directly into the virtual processor. I will not talk about VMware in this article, being a competitor to the Company that I am currently working on (otherwise Alex’s crew would probably kick my ass 😊😂😂), but I will talk about QEMU, which is open source and available to everyone (unfortunately I can *not* take a look in any way to its source code due to some legal stuff in its license that I do not want to deal with).

QEMU, when it works (it is pretty hard to configure and, furthermore, it has some bugs that the developers behind that do not seem to care), has a powerful GDB debugger stub which work quickly and very effective, integrated directly in the VM Virtual processors engine. You can debug everything with it, from the CPU reset vector up to the long-mode OS. QEMU is also multi-platform, allowing different architectures to be debugged on a different host (cross-platform, for example running a ARM64 VM on a AMD64 host). The problem with the GDB debugger was that Windbg implements another proprietary standard (DbgEng), meaning that Windbg was not able to work with GDB packets. And here is where WindbgExdi comes to rescue.

WindbgExdi implements the translation layer between GDB packets and DbgEng (the Windbg engine), allowing QEMU, VMware and all the systems that implement the GDB protocol, to talk with Windbg.

So, let’s make an experiment: let’s build a fully fledged VM in QEMU, and attach it to WindbgExdi

Step 1 – Download and install QEMU and WindbgExdi

First of all, for this experiment you need a working copy of QEMU and WindbgExdi.

QEMU is very powerful because it is able to work with different “accelerators”. An accelerator is the entity that execute the virtualized code. The default accelerator is called TCG and is not a real accelerator. It is just a pure software emulator, able to execute the target architecture code. It has the huge advantage to be totally platform-independent (and TCG supports a myriad of acrhitectures, at least 60 at the time of this post), but has the drawback to be pretty slow for emulating an entire OS. For this experiment, I suggest to run QEMU on a Intel physical machine running the latest Ubuntu Linux, which provides the KVM accelerator, speeding up around 20x the emulation speed (which supports also nested virtualization scenarios, meaning that your AMD64 VM would be able to run and debug Hyper-V hypervisor).

In this guide, I will provide Linux configuration scripts, but I will show how to use the Windows version of QEMU to debug the Windows 11 UEFI boot loader (if you need help in configuring the Linux version just drop me a mail or a Twitter message 😊). So, let’s first download and install the latest version of QEMU for Windows from https://qemu.weilnetz.de/w64/ (this post assumes that you have installed QEMU in C:\QEMU).

Next, install Windbg or WindbgX from the Platform SKD or from the Store, as explained here: https://learn.microsoft.com/en-us/windows-hardware/drivers/debugger/debugger-download-tools.

Now is time to download and compile WindbgExdi, from its repository: https://github.com/microsoft/WinDbg-Samples/tree/master/Exdi/exdigdbsrv. You will need Visual Studio 2019 or 2022 to be able to compile it. Just open the ExdiGdbSrv solution from the “\WinDbg-Samples\Exdi\exdigdbsrv” folder and compile it in Release (CTRL+SHIFT+B should work directly without any problem, drop me a mail if not.) You should get the following files in the “\Release\x64” subfolder (assuming that you are compiling for AMD64):

  • ExdiGdbSrv.dll
  • exdiConfigData.xml
  • systemregisters.xml
  • Other not-important files, like the symbols and the static lib

Those three files should be copied into the Windbg folder (which is usually “C:\Program Files (x86)\Windows Kits\10\Debuggers” or “C:\Program Files\Debugging Tools for Windows” depending on the version of the Debugger package). Now you should modify the “exdiConfigData.xml” to instruct Windbg to connect to GDB in the target. In this guide we will use a local QEMU VM, but if you are going to use Linux in another physical machine, you should set its IP address accordingly… Here is how: locate following section of the XML configuration file, and modify the highlighted part if needed:

<!-- QEMU SW simulator GDB server configuration -->
  <ExdiTarget Name = "QEMU">
      <ExdiGdbServerConfigData ... qSupportedPacket="qSupported:xmlRegisters=aarch64,i386">
      <ExdiGdbServerTargetData targetArchitecture = "ARM64" ... heuristicScanSize = "0xffe" targetDescriptionFile = "target.xml" />
      <GdbServerConnectionParameters MultiCoreGdbServerSessions = "no" ... ReceivePacketTimeout = "3000">
        <Value HostNameAndPort="LocalHost:1234" />
      </GdbServerConnectionParameters>
Step 2 – Set up the VM and configure QEMU

My first advise when dealing with QEMU is to set up the VM using native speed via the Windows Hyper-V (remember to use a UEFI Generation 2 VM).

In this experiment we are trying to debug the undebuggable code, so you need to use the GDB server integrated in QEMU and interface it with the WinDbgEXDI plugin. There is a problem that we need to face before starting. How do you know when you can intercept the code execution? The answer is … you DO NOT! This is why my colleague and friend Alexis from the debugger team had the idea of the “enablejtagbreak” BCD element, which allows you to break before the Windows loader starts.

Before transferring the VM into QEMU, you should enable the BCD element mentioned above. I suggest you to create another Boot Option (since the “enablejtagbreak” can be very dangerous), and also to enable the regular debuggers through the QEMU VirtIo network interface (in that way you can compare EXDI vs Regular. For curious readers, my team designed the VirtIo KDNET extensibility module, so you will be able to use regular KDNET in QEMU). Since this is a lot of work, I created a script able to do it for you:

www.andrea-allievi.com/files/SetupNtDebugger_QEMU.cmd

Just download the script, change the DEBUG_IP, DEBUG_PORT and DEBUG_KEY accordingly (targeting the IP address of your host system) and execute it in the VM. When the script asks if you would like to enable the JTAG Break on the new Boot Entry, simple confirm by pressing the “Y” key.

Now that you are done with the initial VM set up, simply shut it down in HyperV and mount the VHDX. Next step is to inject the QEMU drivers needed for running the VM under QEMU. Open a administrative command prompt and use the following command:

dism.exe /Image:<VHDX_Root> /Add-Driver /Driver:"<QEMU_Drivers_Root>" /recurse

Where:

  • “<VHDX_Root>” is the root volume where your VHDX has been mounted… for example “H:\”
  • “<QEMU_Drivers_Root>” is the root folder of your QEMU drivers. The latest pre-compiled QEMU drivers for Windows are available here (compiled from their GIT source code repo). Keep in mind that new driver packages are released pretty often. For DISM to work you need to copy all files of the “AMD64” (or the target architecture of your interest) folder of each driver located in the ISO into a separate Root folder of your hard drive. Otherwise DISM will be confused and will not be able to inject the drivers into the VHD

Since creating a QEMU Drivers root folder can be a little a pain, I am providing the correct ones here for you, based on version 0.1.229 of the QEMU package (Feb 2023):

When you finished, you need to just unmount the VHDX. Now you have to convert the VHDX in the native QEMU version, called QCOW2. A lot of guides on internet state that this step is not needed, since QEMU supports also the VHDX file format…. but guess what? The VHDX support in QEMU has bugs that randomly corrupt the VHDX, so I advise you to convert the VHDX:

qemu-img convert -c -p -O qcow2 <Source_VHDX_file> <Target_QCOW2_file>

Note that the process will actually take some time…

Configuring the VM is one of the big weakness of QEMU, since it use a pretty complicated command line. If you launch the correct QEMU executable (based on the target architecture, usually “qemu-system-aarch64.exe” for ARM64 and “qemu-system-x86_64.exe” for classical AMD64) with the “-help” parameter you will probably get lost in the myriad of parameters that QEMU accept. The idea (coming from Linux) is that the user specifies in detail the target VM configuration (from the motherboard, CPU, graphics card, buses and so on…) entirely on the command line (QEMU supports a lot of combination). Luckily enough, I am providing here handy scripts that can be used to easily launch a ARM64 or AMD64 machine using the TCG accelerator. Similar scripts (suspiciously similar ahahahah 😂) are available also in the official MSDN website on EXDI (https://learn.microsoft.com/en-us/windows-hardware/drivers/debugger/setting-up-qemu-kernel-mode-debugging-using-exdi):

You just need to copy the script in the root folder of QEMU and replace the “<Full_path_of_the_HD_ Image.qcow2>” block with your full path of the virtual hard disk file (QCOW2 or VHDX if you are brave enough.

Note that for this experiment, you can use also a public-available ARM64 VM, which you can freely download from here: https://www.microsoft.com/en-us/software-download/windowsinsiderpreviewARM64. If you are brave enough to change completely the target architecture I suggest you to download the latest “Canary” VHDX. At the time of this blog post, the latest available version is 25324, and, … guess what, …, without this patch it will not even boot because it has a bug preventing Winload to run correctly in QEMU.

Step 3 – Start the VM

If you launch the compiled script a QEMU Windows magically appears and the VM starts to work in TCG, or emulation mode. Note that if you are using the AMD64 version of Windows, the VM will probably get stuck in user-mode, simply because the TCG emulator is not able to correctly emulate the IRET instruction. This is not the point though (if you want to understand how to fix this, continue to read until the Conclusions), user-mode is already too late. We want to debug the transition code or something undebuggable.

So, let choose the second boot entry: “Debug Windows 11 QEMU” if you used my script. The VM will seem to be dead, showing just a black screen. We need to attach the hardware debugger via WindbgExdi. Press the key combination CTRL+ALT+2 (or choose the “compatmonitor0” item from the View menu) to interact with the QEMU monitor. Then type the “gdbserver” command and press enter. If all goes well QEMU should reply by showing the message: “Waiting for gdb connection on device ‘tcp::1234′”.

It is now time to connect WindbgEXDI. Open a command prompt window, go to the Windbg installation path and launch it with the following command (which tells to Windbg to load the ExdiGdbSrv in-proc COM class):

windbg.exe /noredirect -v -kx exdi:CLSID={29f9906e-9dbe-4d4b-b0fb-6acf7fb6d014},Kd=NtBaseAddr,Inproc=ExdiGdbSrv.dll,DataBreaks=Exdi

If all goes fine (and you configured correctly the exdiConfigData.xml), the Debugger will open a black dialog box, called ExdiGdbServer, and you will see a lot of unreadable commands in it. The Windbg main window will magically appears, but still pretty confused:

WindbgEXDI
Part 1 – Conclusions

It is 11 PM of Sunday night (today was Easter), and I am pretty tired. If you have reached this point it means that you succeeded in the initial configuration of your WindbgEXDI interface. This, together with QEMU, is super-powerful and allows you to debug like a PRO. In the next part of the blog post we will analyze super-fancy tricks to debug a lot of undebuggable code. Stay tuned! … And of course let me know what do you think about this in the comment section below 😊….

https://www.andrea-allievi.com/?p=640
Extensions
Windows Internals Special Edition is Online
NewsCharitygiveOSWindowsInternals
Hello all! Finding a space between work and personal life is pretty hard nowadays… This post is just to let you all know that the bid for the special “signed” edition of the “Windows Internals – 7th Edition Part 2” book is online and has been published at the following address: https://www.ebay.com/itm/394268814675 This release of […]
Show full content

Hello all!

Finding a space between work and personal life is pretty hard nowadays…

This post is just to let you all know that the bid for the special “signed” edition of the “Windows Internals – 7th Edition Part 2” book is online and has been published at the following address: https://www.ebay.com/itm/394268814675

This release of the hardcover book contains the signature of myself, Alex, Mark and of more than other 20 Engineers that collaborated in the design and development of the OS features described in the book. It is a super-unique item (nothing similar exists ever).

The interesting stuff is that me and my colleagues designed the bid for the Microsoft Giving campaign, where our company will match any charity donation. The idea is that we will use the money that we collect with the bid (except the fees that Ebay wants) to donate to Charity organizations.

Due to family motivations, I would prefer that some part of the income will go to the Cancer research, but, if the bid will end up to be a decent amount of money, the winner can choose which other Charity to donate to (the options will be given later the next week).

Unfortunately the bid will last just for 10 days (as per Ebay rules), but please put an offer on it 😁😁😁.

You can’t lose an opportunity like this!

https://www.andrea-allievi.com/?p=625
Extensions
Alder Lake and the new Intel Features
NewsAlderLakeHLATNtKernelUserInterrupts
3rd January 2022 Since I returned back home in Italy, aside for dealing with the crazy Covid situation, I had some time off to read some documents and deepen some concepts that were in my personal list since some time ago… Indeed, multiple side projects have accumulated during the writing of the new Windows Internals […]
Show full content

3rd January 2022

Since I returned back home in Italy, aside for dealing with the crazy Covid situation, I had some time off to read some documents and deepen some concepts that were in my personal list since some time ago…

Indeed, multiple side projects have accumulated during the writing of the new Windows Internals book (like learning Rust, Spanish, and so on…). The book is now available, so I finally ended up having some free time (after three long years). One of the interesting project that I had was to deepen the new CPU technologies present in the new Alder Lake processors (which, kindly enough, Intel provided me a sample).

It seems that Intel had published a long and detailed paper describing all the new instructions and features of the Alder Lake and Sapphire Rapids processors. The document is available here: https://www.intel.com/content/www/us/en/develop/download/intel-architecture-instruction-set-extensions-programming-reference.html. So in the endless flight from Seattle to Italy I was able to read it entirely 😁.

Let’s start by saying that a lot of new features have been brought by the new architecture (which, in my tests, is super fast), like the Advanced Matrix Extensions (AMX), Process Address space identifiers (PASIDs), Architectural Last Branch Records (LBRs), Enhanced Hardware Feedback Interface and so on… I will skip a lot of them (readers should refer to the above document for gathering all the needed information), but I want to describe two features that in my opinion are really cool and useful: “Virtualization Technology Redirect Protection”, also known in the field as HLAT, and “User Interrupts”.

Let’s start with the Virtualization Technology Redirect Protection (from now on abbreviated as VT-rp)…

Intel VT-rp

After the introduction of the Shadow Stack in the 11th generation CPUs (Tiger Lake), there was still just a weak point that needed enhanced hardware protection, the possibility of an attacker to be able to remap one or more protected memory pages, simply by writing in the kernel page tables. The system has no way to prevent an exploiter to write in the page tables, and even Hyperguard (as described in the good article that Yarden recently publishes) is not totally able to non-deterministically protect against this kind of remapping (I will leave the details to her, I am not allowed to talk about PG/HG).

Furthermore, protecting the page tables through the EPT in the Hypervisor is not possible either, simply because the CPU always write to those pages (when performing the page table walking). In case the EPTs describing the guest page tables is mapped with read-only access, every CPU access would cause a VMEXIT. This simply mean that the performances would have been catastrophic (VMEXIT is a slow operation)….

So, here is where the VT-rp technology comes to rescue 👌😯🍕….

In Intel VT-rp indeed, the Hypervisor (VMX root) supports new tertiary processor-based VM-execution controls, which can be used to enable the HLAT (Hypervisor-managed Linear Address Translation), Paging Write (PW) and Verify Paging-Write (VP) bits in the Extended Page Tables (EPT). VT-rp is so implemented in two pieces:

  • In the EPT tables, used by the Hypervisor to translates Guest Physical Addresses (GPAs) to System Physical Addresses (SPAs). This procedure is normally referred as Stage-2 translation. Remember, while EPTs controls the physical translation, regular page table controls the virtual translation (GVA to GPA).

The leaf EPT pages can now have the Paging Write (PW) bit (58) set to 1 to allow the processor page walker to write the A/D (Accessed / Dirty) bits even though the physical page is mapped without Write permission (in the EPT).

Note that the PW bit can be used to enforce that a GVA is forced to be bound to a specific GPA, but can’t do anything to prevent the same GPA to be remapped by another guest linear address. So, another bit in the leaf EPTs have been designed: when the Verify Paging-Write (VP, to not be confused with PW) bit (57) is set to 1, the processor page walker verifies that all the physical page tables used for translating the GVA have all the PW bit set to 1 in the EPT.

  • A new HLAT table is mapped in both the Normal and the Secure Kernel, which will assist the processor for translating privileged memory pages. A new 64-bit control field, “Hypervisor-managed Linear Address Translation Pointer” is defined in the VMCS data structure managed by the Hypervisor. This field point to the GPA of the HLAT table.

An HLAT table is identical to the standard 4 (or 5) level paging structure used in VMX non-root mode to translate virtual addresses to physical addresses, except for a little differences. There is a new “Restart” bit (#11) that allow the page walker to stop the walk and restart from the regular (CR3-rooted) ordinary paging structure managed by the guest OS.

Note that the entire HLAT table is physically mapped through the EPT in the Normal kernel with read-only privileges, but with the PW bit set to 1. In that way the CPU is able to update the A/D bits of its entries, but no software entity would be ever able to modify its content. Only the Secure Kernel will be able to modify its content, because the HV usually uses another EPT to physically map the HLAT in the Secure Kernel. In this case the EPT will have full RW access rights.


Putting together all the pieces of the puzzle – How this black magic works

In the new configuration, when the “Enable HLAT” VM execution control is set to 1, the processor translates a guest virtual address in a different way: in case it is instructed to do so by some new Protected Linear Range (PLR) registers (which stores the number of most significant bits that should be set to 1 in the address for being translated by HLAT), the CPU start the GVA to GPA translation using the HLAT (and not the CR3 register).

The HLAT manages the final translation. It can contain all the page table hierarchy needed to return the final guest physical address (in that case no regular page tables are ever consulted) *or* it can happen that a entry in any hierarchy can set the “Restart” bit to 1. This obliges the processor to restart the translation from the regular guest paging table structure, addressed by the CR3 register in the guest.

This allow a fine-grained protection of the VA translation, and will prevent the possibility of attackers to remap the VA to another physical address (a feature very useful for KDP for example, as explained in my previous article). Note that the EPT still controls the physical translation: a discussed, an attacker can not even remap the GPA to another VA thanks to the VP bit applied into the EPT, because the page walker in that case will verify that the GVA is translated only by HLAT entries (which have PW bit set to 1), preventing any other possible remapping.

I know that is confusing at the first glance, so here is an amazing picture taken from the Intel manual and enhanced by my amazing Excel drawing skills™:

Curious readers would ask if Windows already implements HLAT. The answer is “we are working on it”… How? Of course I can not say a lot but, if you are a Windows Internals enthusiast, we are trying to replace the NTEs in the Secure Kernel with a new format that the hardware (HLAT table) will understand…

This will definitively raise the bar of the overall system security. So as usual, Stay tuned! 😲


Update of 1/10/2022

User Interrupts

Another cool feature of Alder Lake in my opinion is certainly User Interrupts. As the feature’s name explicitly says, it is the capacity of the CPU to deliver a interrupt to user-mode software executed in CPL 3, without any change to the segmentation state.

User-mode interrupts are enabled only if a new bit in the CR4 register, the UINTR bit (25), is set to 1. There are 64 possible different user-interrupts vectors, which are mapped by a single bit in a new UIRR (User-Interrupt Request Register, which is actionable thanks to the IA32_UINTR_RR MSR – 0x985). In Intel nomenclature, the UIRRV is the position of the most significant bit in the UIRR, which means that is the current User-Interrupt Vector.

It should be clear to the reader that each bit in the UIRR corresponds to a User-Interrupt vector (which is a very different concept in respect to regular interrupt vectors) There are multiple way in which a CPU or software can deliver a user-interrupt, which happens only when the CPU is executing user-mode code:

  1. Kernel software writes in the CPU UIRR, or perform an XRSTORS that store new bits in it. In this case, when the processor returns to user-mode (via standard means, like a trap return or service call return), and if CR4.UINTR = 1, it performs the User-Interrupt Delivery and the CPL 3 code execution is diverted to the User Interrupt Handler, defined in the IA32_UINTR_HANDLER (0x986) MSR. There are multiple rules regarding how the stack is prepared by the hardware, which are similar to kernel interrupt dispatching, and I am not going to deepen here (the Intel manual is very clear and detailed about that.

  2. A software operating in kernel mode on another CPU can perform User-interrupt posting by sending an ordinary interrupt (via local APIC) to a target processor on a vector described by the UINV register (User-Interrupt notification vector), which is accessible via the bits [39:32] of the IA32_UINTR_MISC (0x988) MSR. At this point the processor executes a procedure called “User interrupt notification” (this part is a bit tricky to understand from the Intel manual). The procedure’s goal is to set the relative bits in the target processor’s UIRR starting from the User-posted-interrupt descriptor (UPID), that the kernel software sets before sending the ordinary interrupt. The UPID is indeed accessible via the IA32_UINTR_PD (0x989) MSR and is also heavily used by the SENDUIPI new instruction (see below). In bits [127:64] it contains the Posted-interrupt request (PIR), which is the 64-bit mask that will be copied in the target processor’s UIRR. The delivery of the interrupt then follows the same pattern as the previous case.

  3. A software executing in user mode can send a user-interrupt to another CPU by using the new SENDUIPI instruction (the only one that can be executed in CPL 3. Even this part of the Intel manual is a little messy in my opinion). A user-interrupt target table (UITT) must be previously set by the kernel by interacting with the A32_UINTR_TT (0x98A) MSR. The table is made of 16-bytes (128 bit) entries, where an entry is composed of: a valid bit, the ordinary notification interrupt vector (0 to 255) (this is similar to the UINV) and the address of a UPID, similar as the previous case. So callers of the SENDUIPI instruction in user-mode should just specify a register containing the ID in the user-interrupt target table. The instruction then identifies the correct entry in the table, and, if the entry is valid (note that otherwise a #GP fault is generated), the CPU writes the relative bit in the posted-interrupt request bitmask of the UPID and send an ordinary interrupt using the vector described by the “Notification vector” field of the UITT entry. The latter will be dispatched as the previous case.

As the reader can see, the architecture is a little complex. Luckily enough, the Intel manual explains all the little details. When a user-interrupt fires, a particular ISR routine in the target process address space is executed, with the stack ad-hoc prepared by the machine (as for regular interrupt). The User ISR will be executed by the machine with the User Interrupt Flag (UIF) clear (set to 0). This flag, which is not mapped in any MSR (but strangely enough is saved or restored by XSAVE / XRSTOR), can be set or clear by user-mode software using the new STUI and CLUI instructions. Furthermore, when the user-interrupt ISR returns via the new UIRET instruction, the machine automatically set the UIF back to 1 (no User interrupts are delivered when UIF is 0).

This has the important implication that User Interrupts, similar to the ordinary ones, follow some nesting rules (a little different from regular interrupt though, where the IF is set / clear depending on the type of the gate descriptor in the IDT). This is definitively something that the application developer should keep in mind.

Potential usage in Windows or Other OSs

One thing that I still have not fully understood is the usage model that Intel had in mind when developing the User Interrupts feature. As careful readers may have noticed, the underlying OS should heavily implement support for User Interrupts to make them work, especially in the scheduler, which should at least save / restore all the involved MSRs when switching between threads of different processes (they may have different supports for user-interrupts). Not counting the fact that the OS kernel should provide facilities to manage user-interrupts vectors per process.

As Windows Internals enthusiasts (who have read my book 😁) know, Windows already support a software technology which achieves more or less the same: Asynchronous Procedure Call (APC). APCs can be dispatched while the target thread is already executing Kernel mode code (via an APC interrupt, which dispatches a Special Kernel-mode APC), or while the target thread has been pre-empted (via a Normal kernel-mode APC). More important, the OS supports also User APCs (Special and Normal), which are dispatched before the OS is returning to User mode and fully executed in CPL 3 (malware analysts know this a lot… right? XD).

So, to me it is not fully clear the scenario by which User Interrupts can be useful here. Maybe just in highly contended and high priority threads, where the round-trip to kernel mode can be very expensive (remember, User Interrupt dispatching is executed entirely by the machine, which means that when thread A want to send a User IPI to thread B, it should not go to Kernel mode, unless thread B is not being executed of course). Furthemore, user Interrupts are fully compatible with Virtualization, so I think that in this scenario they can be useful (maybe it would be a good idea to empower User APCs???).

Again, if a reader knows more please let me know 😊….


Conclusions

It is very nice to see a lot of new features coming in this new generation of Intel processors, which will help a lot also in maintaining a new level of Security. I am not an exploiter, but I am wondering how with CET + HLAT an attacker will be able to exploit the system (probably with Data-driven attacks, but if you know more please send me a private message). We will see how other CPU manufacturers will respond with their own technologies. Furthermore, I have also no idea how and when Linux-based OS would be able to use the new technologies….

That is all for now folks!

Now it is time for me to return to Seattle 😁….

https://www.andrea-allievi.com/?p=532
Extensions
Windows Internals Part 2 is here
News3YearsBookMicrosoftNtKernelWindowsInternals
Hello there!It has been a very long time since I last updated this blog (at least 3 years or more). Since my last post a lot of things have happened, which I summarize here: On January 2018 I moved to Seattle (WA), from Italy, with the idea to work in the Windows Kernel Core team. […]
Show full content

Hello there!
It has been a very long time since I last updated this blog (at least 3 years or more). Since my last post a lot of things have happened, which I summarize here:

  • On January 2018 I moved to Seattle (WA), from Italy, with the idea to work in the Windows Kernel Core team. Furthermore, I officially started a very ambitious project with Alex Ionescu: being one of the main author of the new Windows Internals book. A part of the huge cultural difference between Seattle and Milano (and, trust in me, adapting to the new culture was really hard for me), my life was proceding well, split between the 2 places (I miss home a lot)…
  • Around June 2019, my team split and I got promoted to Senior Core OS Engineer on the brand-new ™ Security Core Team, where I got the main responsibility on a component of Windows called Secure Kernel (a lot of my readers know what it is XD).
  • In the meantime, the work on the book was proceeding pretty slow, due to some problems not directly related to me (which I do not want to talk about here). Furthermore, multiple articles, and, before Covid, a couple of conferences talks have been release by myself, especially on Retpoline, Import Optimization, HotPatch and KDP….

Well, after three (reeeallyy 3) long years of work (in such a lot of looong nights) we are super excited to announce that in a non-precise day between the 15th and 21st of September 2021, the new Windows Internals book (7th Edition Part 2) will be finally available in its paper copy.

Never in my life I have been part of such-an-ambitious project: a lot of sections have been rewritten, others have been fully updated, and a brand-new chapter has been designed, all targeting Windows 10 21H1 and the new incoming Windows 11 kernel. I am so proud that we were able to include the following important new content:

  • Hardware side-channel vulnerabilities (which, some of them I took forever to fully understand), a completely brand-new WoW64 (including x86 on ARM64), WNF and Packaged applications, all part of Chapter 8
  • A new chapter about the Hypervisor, Virtualization stack and Virtualization-based security (VBS). I’ve personally written this chapter. It includes nitty-gritty details (never discussed before) on how the Hypervisor and Secure Kernel internally work.
  • The Windows registry and Windows services sections have been fully updated to include new concepts directly related to Windows 10, like the registry hive reorganization, virtualization, user and packaged services and so on. Chapter 10 includes also a rewritten section on UBPM, ETW (rewritten from scratch) and, last but not least, DTrace (which has been proven to be a super-powerful tool for tracing).
  • Chapter 11 includes a brand-new section on the resilient file system (ReFS). Furthermore the new features of NTFS (since Windows 7) have been all introduced and described in details (like the online check-disk). Not to mention an introduction on the next generation low-level storage solution, Spaces.
  • Lastly, also Chapter 12 has been completely rewritten. In the year 2021 there was no way that we would have release a section regarding the old BIOS systems. Melancholy readers should still read the old edition :-).

You can order your copy on the official Microsoft Press website (link), or, of course, on Amazon (link) 🙂

I want to say a big “Thank you” to all the people that helped me in this big journey, internal to Microsoft and even external. Thanks also to Mark Russinovich for having written the Foreward. And, of course, thanks also to Alex for including me in this big project. I hope that you guys enjoy it!

On a side note, the next month my company created the Giving Month, a month where all people are encouraged to give something to charity. Microsoft will match the donation, with the goal to help people that are less fortunate than us. I was thinking to collect all the signatures of the Windows’ developers, put them in a copy of the book, and sell it on Ebay as a unique and original piece. Finally, donate the earns coming from the sell to Cancer research. I am asking to the readers…. is this something that caught your interest? Which, rephrased, mean… would you like to put an offer on it if the idea goes through? (I still need to discuss it)

ps. I still need to buy a certificate for the website and pass some time to find a decent theme for it. If someone is willing to help please contact me 🙂

ps2. Quick update: I have installed a new SSL certificate and set another theme for the blog. Hope that you liked it. In the meantime the official publication date is 21st September 2021. Have Fun! 😊

https://www.andrea-allievi.com/?p=512
Extensions
Trusted Boot and BSides
News
Hello folks! Long time no updating my blog. The work, book, and a minimum of social life are killing my free time 🙂 So, here we go… … on last 17th June 2018 I gave a talk at the BSides Conference in my own city, Milano. It was really nice to return back home, see […]
Show full content

Hello folks!

Long time no updating my blog.
The work, book, and a minimum of social life are killing my free time 🙂

So, here we go…
… on last 17th June 2018 I gave a talk at the BSides Conference in my own city, Milano.
It was really nice to return back home, see my family and friends, even if for a small amount of time.

The talk was about Intel TXT, aka Trusted Execution Technology, that Intel has implemented in his own CPUs.
Windows uses Intel TXT for 3 reasons:

  • Providing the auto-unlocking of the encrypted Bitlocker boot drive
  • Measured Boot
  • Windows Defender System Guard (aka the Trusted Boot implementation in Windows)

The entire presentation is available here:
https://www.andrea-allievi.com/files/Intel_Txt_Windows_BSides_2018.ppsx

The presentation is for a technical audience, so I was expecting some basic knowledge about OSs. After the conference, I have received some advises (of course well accepted) saying that I’ve put too many details in the slides. I would love to hear from the readers what they think about…
In the meantime I am restarting with a new Book’s Chapter, and preparing an interesting presentation for the new BlueHat edition.

So, as usually, stay tuned! 🙂

Andrea

https://www.andrea-allievi.com/?p=503
Extensions
Recon 2017 Montreal, and some News…
News
Hi All!   It has been a long time since I have not updated this blog. As usual a lot of things are going on, and the free time is always very tight 🙂 Today I just want to share with my readers the results of my reverse engineering work that I did on HyperV […]
Show full content

Hi All!
 
It has been a long time since I have not updated this blog.
As usual a lot of things are going on, and the free time is always very tight 🙂
Today I just want to share with my readers the results of my reverse engineering work that I did on HyperV and I have presented in the last edition of the Recon Conference in Montreal.
This edition (May 2017) was quite good, with some interesting talks. We had some good time there, and I have even learnt something.

AaLl86 presenting at Recon

I presented a talk named “The HyperV Architecture and its Memory Manager”. Apart of my damn English accent, I think that I had some good feedback about the technical level of the talk. I would like to share here the slides:

www.andrea-allievi.com/files/Recon_2017_Montreal_HyperV_public.pptx

I take the occasion even to say that our Intel Processor Driver has been improved. Now it fully supports HyperV Root partitions (this was my demo in the Conference) and runs quite good.
I do not know if I can publish the new source code (I need an approval before), but at the time of this writing I have published the compiled code into our GitHub repository.

https://github.com/intelpt/WindowsIntelPT/tree/master/Compiled_IntelPt

Richard has pinpointed to me some bugs of the IDA plugin and on the driver. I have even improved those.

Few days ago, our friend Alex (@aionescu), has suggested me an interesting reading:
www.cyberark.com/threat-research-blog/ghosthook-bypassing-patchguard-processor-trace-based-hooking/

Basically these guys have done a smart hack with Intel PT, filling a Topa table almost entirely, and setting the Trace by IP…
I am still trying this technique, but potentially it should work. I have only some concern about the timing in which the PMI interrupt will be delivered (this is why it is not considered a threat).
According to the Intel Manual indeed: “This interrupt is not precise, and it is thus likely that writes to the next region will occur by the time the interrupt is taken”

Long story short: Some other tests are needed.

Like a bonus content I would like to show a funny fact:

Am I perhaps saying that someone is copying something from someone else? Of course not. This method have been idealized by Cyberark, and uses a “side effect” of the PT PMI Interrupt. The method is original and belongs to them, … but at least THERE IS SOMETHING that is common.

Stay tuned!
Cheers,
Andrea

ps. Again I say that this is my personal blog. I would like to precise that all the impressions, thoughts and information contained here are mine, and not official company statements.

http://www.andrea-allievi.com/?p=484
Extensions
BlueHat, Airplanes and Intel Pt
News
In this week I have flew home, after spending few weeks in Seattle for the Blue Hat and some meeting with the team (and even for some fun in the night, I admit 😉 ). For whoever doesn’t know, starting from the September 2016 I am a Security Researcher of the Threat Intelligence Center of […]
Show full content

In this week I have flew home, after spending few weeks in Seattle for the Blue Hat and some meeting with the team (and even for some fun in the night, I admit 😉 ). For whoever doesn’t know, starting from the September 2016 I am a Security Researcher of the Threat Intelligence Center of Microsoft Ltd (MSTIC).

BlueHat was great. Me and my friend Richard Johnson (@richinseattle) have presented a talk regarding our last research work about the Intel Processor Trace. I have idealized, tested and developed the first Windows PT driver, and he has researched the way to use the driver in his high-speed fuzzer project (FuzzFlow).

At the time of this writing, the driver is stable and works well (much more than I expected). You can find it in the Repository built by Rich:

https://github.com/talos-vulndev/TalosIntelPtDriver

 We have received tons of comments and questions regarding our work. Here I would like to clarify some of these.
 

 Question 1. Is the technology ready to trace Kernel Mode code?

The answer is Yes, even though at the time of the presentation I have not inserted this feature directly in the driver’s code, with some simple modifications you could be able to trace Kernel Mode code, Hypervisor and even SMM.

Last week I had passed something like 17 hours in 2 flights from Seattle to Milano (my native city) and, due to the fact that I didn’t know how to stay calm, I have decided to start the implementation of a new version of the driver with a complete support for kernel mode tracing.

The usage is quite simple:

  1. Import the “TalosIntelPtDriver.lib” and “KernelTracing.h” files in your kernel mode driver project (I have not any kind of wish to explain how)
  2. Allocate the needed buffer descriptor using IntelPtAllocBuffer function:

NTSTATUS IntelPtAllocBuffer(PPT_BUFFER_DESCRIPTOR * pBuffDesc, QWORD qwSize, BOOLEAN bUseTopa, BOOLEAN bSetStdPmi = TRUE);

  1. Allocate and fill a PT_TRACE_DESC structure with the needed parameters for tracing
  2. Start the tracing in the current execution processor using the IntelPtStartTracing routine:

NTSTATUS IntelPtStartTracing(PT_TRACE_DESC traceDesc, PT_BUFFER_DESCRIPTOR * pBuffDesc);

  1. Run the kernel code that you prefer (always in the same processor that has called the IntelPtStartTracing routine) and when finished, call IntelPtStopTrace function
  2. Free any allocated buffer using IntelPtFreeBuffer

 
Using these 6 steps, and a trick, I was able to do 2 cool things:

  1. Get a full trace of a test driver.

How? It was not easy. Using the proper Structure Exception Handlers, I was able to insert a special “bad-opcode” byte in the beginning of the target driver’s entry point. I caught the exception from the monitoring driver, started the Processor Trace, modified the bad opcode and resumed the execution. In this way, I succeeded in tracing a full-blown driver initialization and unload functions.

Of course, you have to design some simple kernel code to dump the PT binary buffer in a file, but this is a very-easy task 🙂

  1. Get a full trace of an “already-loaded” kernel module.

Easier than the previous case but much more time-consuming. Indeed, I passed the following few days in Cheltenham implementing the Kernel tracing support from User-mode. After succeeded in modifying the driver architecture (very long task), I simply created a big buffer, grabbed the target module start and end address, and started PT using the “tracing by IP” modality and the new Kernel Tracing feature.

Feeding the buffer to my IDA plugin yields interesting and cool results (My IDA plugin is doing his job greatly, even if I still continue to hate Python 🙂 ) :

Figure 1. The trace of a very bugged Kernel mode driver load routine
Figure 1. The trace of a very-bugged Kernel mode driver load routine


The trace of a Kernel-Mode IRP Handler Code
Figure 2. The trace of a very-bugged Kernel-Mode IRP Handler Code

As said, I have even inserted in the user-mode code, the possibility to trace kernel mode software, even if I think that it could be a security flaw. Someone has tried to convince me that, if the user is an Administrator, it could be allowed to trace kernel-mode code. What do you think? I will appreciate if the readers could tell me what do they think.
 

Question 2. Does Microsoft plan to implement Intel PT in Windows 10?

I really have no idea. I am still too new and usually I can’t reveal this kind of information without an explicit permission. The only thing that I know is that I will love to work with Skywing, Skape or some Kernel guys to implement this inside the Windows OS.
 

Question 3. Do you guys plan to release the Slides and the IDA plugin?

While the driver code is already online (still not the one with Kernel Mode support, I was working on the sanitization of this code), after speaking with my current manager (Cristian), he allowed me to release the IDA plugin and the Test user application.

You can find the IDA plugin here:
https://github.com/intelpt/IntelPt_Compiled/tree/master/plugin

You can find even the latest beta compiled version of the Kernel driver and test application here:
https://github.com/intelpt/IntelPt_Compiled/

(It still requires the Test Signing Mode enabled)

Keep an eye opened on this repository. More things will arrive soon 🙂

For the recording and the slides of the talk, it depends on the BlueHat organizers. I have no plan to publish it for the global public. If you are interested send me an email to info@andrea-allievi.com or ask to the conference organizers (bluehat@microsoft.com) for all the information.
 

Question 4: Why don’t I publish the signed driver used in the demo?

I have bought a personal digital signature but I still don’t want to risk to publish a vulnerable driver that could be used for disable the OS protections or similar. If Rich, Zer0mem, Nicolas or some great hacker will try to exploit the code, I will be sure that it won’t contain any vulnerability. At that time I will publish the signed one.


Question 5: Ok, all this stuff is great, but what about real usage in multi-processor environment?

This is not an easy task. We are currently working on implementing this. But I would like to invite the interested reader to the next Recon Conference (if Hugo will accept us of course). In that talk I will explain how we have overcame this problem, how I have used the new features to analyse some Malware, and Rich will introduce the new features of his FuzzFlow. We’ll wait some smart security researcher! 🙂

In conclusion, this is definitively a damn interesting technology, with a lot of useful real case usage. Mixed with a Hypervisor (my implementation is still private, check the Satoshi or Alex Ionescu Hypervisor for example), we can definitively create even an off-line post execution engine used for tracing step-by-step whatever software we would like.

I wait some tips by the readers for the future improvements other than the Multi-Processor support. In the next European Recon conference (if we will be accepted of course), we would like to show the multi-processor execution and some real cases of its usage (fuzzing for example) with Intel PT.

I am even working on a quick video movie that shows how to use this.


11/26/2016 Update:
As some of you have allow me to notice this (thanks @long123king and @hacksysteam), at the time of this writing, no Type-1 (bare-metal) hypervisors are compatible with the Intel PT driver. This is because the CPUID (leaf 7 and 20) instruction is trapped by the Hypervisor and the PT bits are stripped down. Furthermore, based on our test, even the VM-Exit caused by the acquiring/modification of the PT-related Model Specific Register (MSR) are caught and invalidated.

To proper work with the Windows Intel PT Driver, you need to disable vSphere ESXi, HyperV (and even Device Guard, that deeply rely on it) or any Type-1 hypervisor (not VmWare Workstation, that is a Type-2 Hypervisor).

For HyperV you can use the procedure described here:

https://kb.vmware.com/selfservice/microsites/search.do?language=en_US&cmd=displayKC&externalId=2146361

Keep in mind that this will lower the overall security of your system if Device Guard will be disabled.

As usual, stay tuned!

Cheers,
Andrea

http://www.andrea-allievi.com/?p=454
Extensions