Show full content
- Introduction
- fetchLater API
- Why Deferred Fetches
- Evolution from Pending Beacon
- What I Got Wrong Last Time
- fetchLater Experiments
- Follow-Ups
- How We’re Going to Use it
- TL;DR
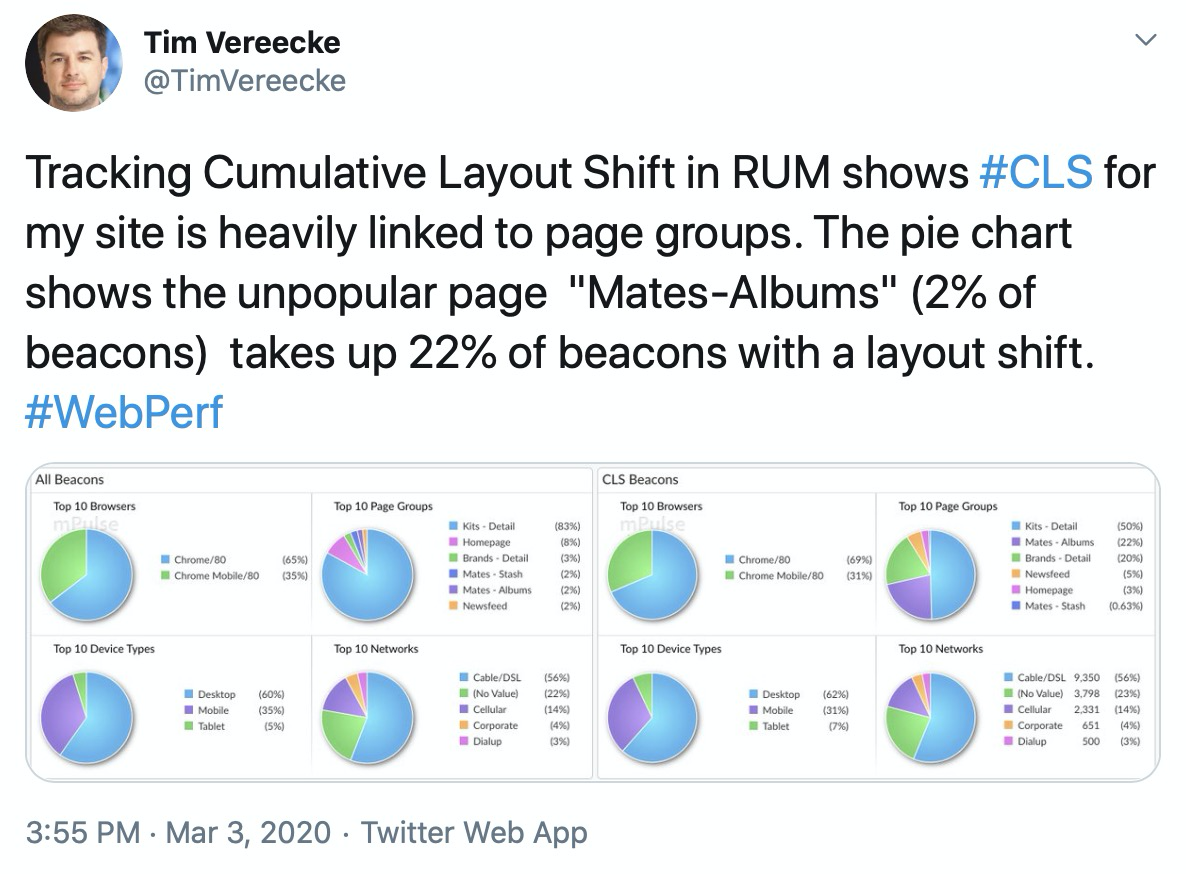
This is a follow-up to the post Beaconing in Practice: An Update on Reliability and the Pending Beacon API, which itself is a follow-up to an article titled Beaconing In Practice. These articles cover all aspects of sending telemetry from your web app to a back-end server for analysis (aka "beaconing").
In the past year, the Pending Beacon API has evolved like a Pokémon and is now called the fetchLater() API. I think the new API shape is more ergonomic, more reliable, and a good step forward.
In this article, I will review the updated API and see how it stacks up to its predecessor, the Pending Beacon API, as well as the standard way of beaconing on the web via XMLHttpRequest (XHR) and sendBeacon(). Some of the content of this article will look similar to the last one, with some additional content for how the API has evolved, and newer findings from experimentation.
A summary of where we left off last time:
- The Pending Beacon API was showing great promise, giving developers better ergonomics for sending data, and a more reliable way to send beacons at the end of the page lifetime
- There were a few scenarios that Pending Beacon seemed less reliable than using
sendBeacon():- During
onloadPending Beacon (withtimeout:0) was about 1.2% less reliable thansendBeacon() - During
pagehideandvisibilitychangePending Beacon (withtimeout:0), on Mobile, was about 17.9% less reliable thansendBeacon() - After reviewing my methodology with Chrome engineers, they pointed out I had forgotten to use
.sendNow()in scenarios that it should be used; details on that suggestion below.
- During
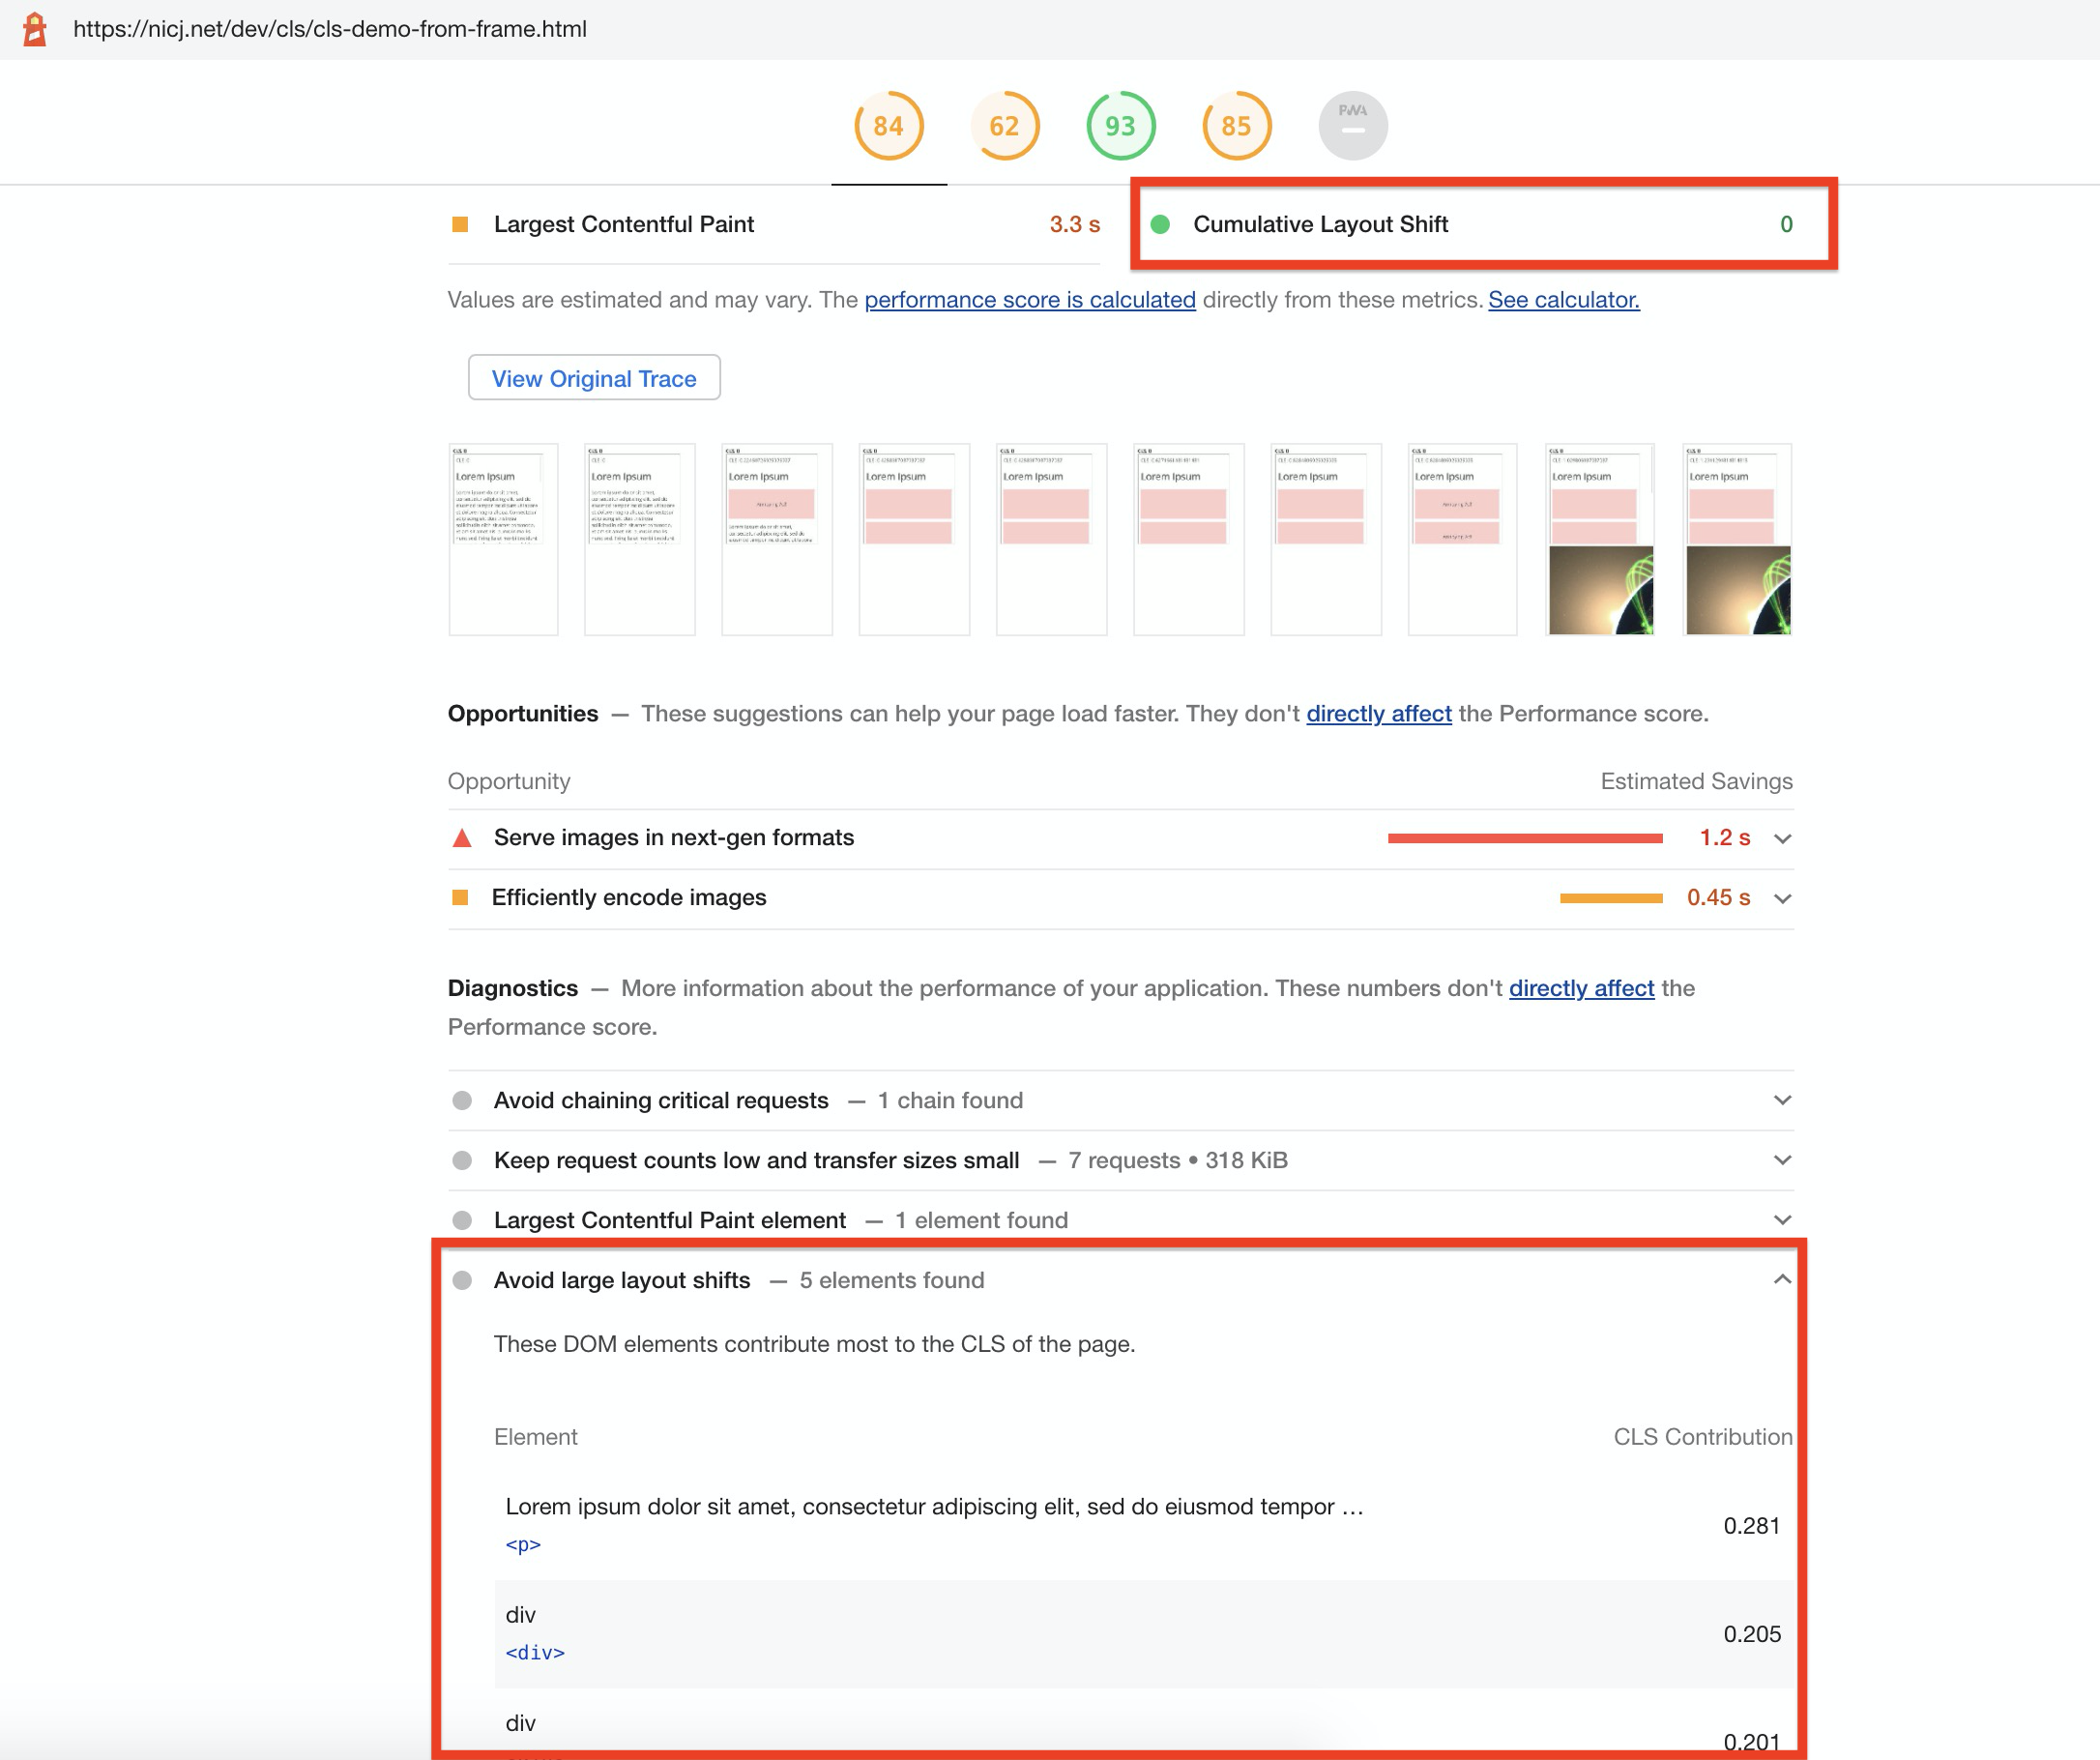
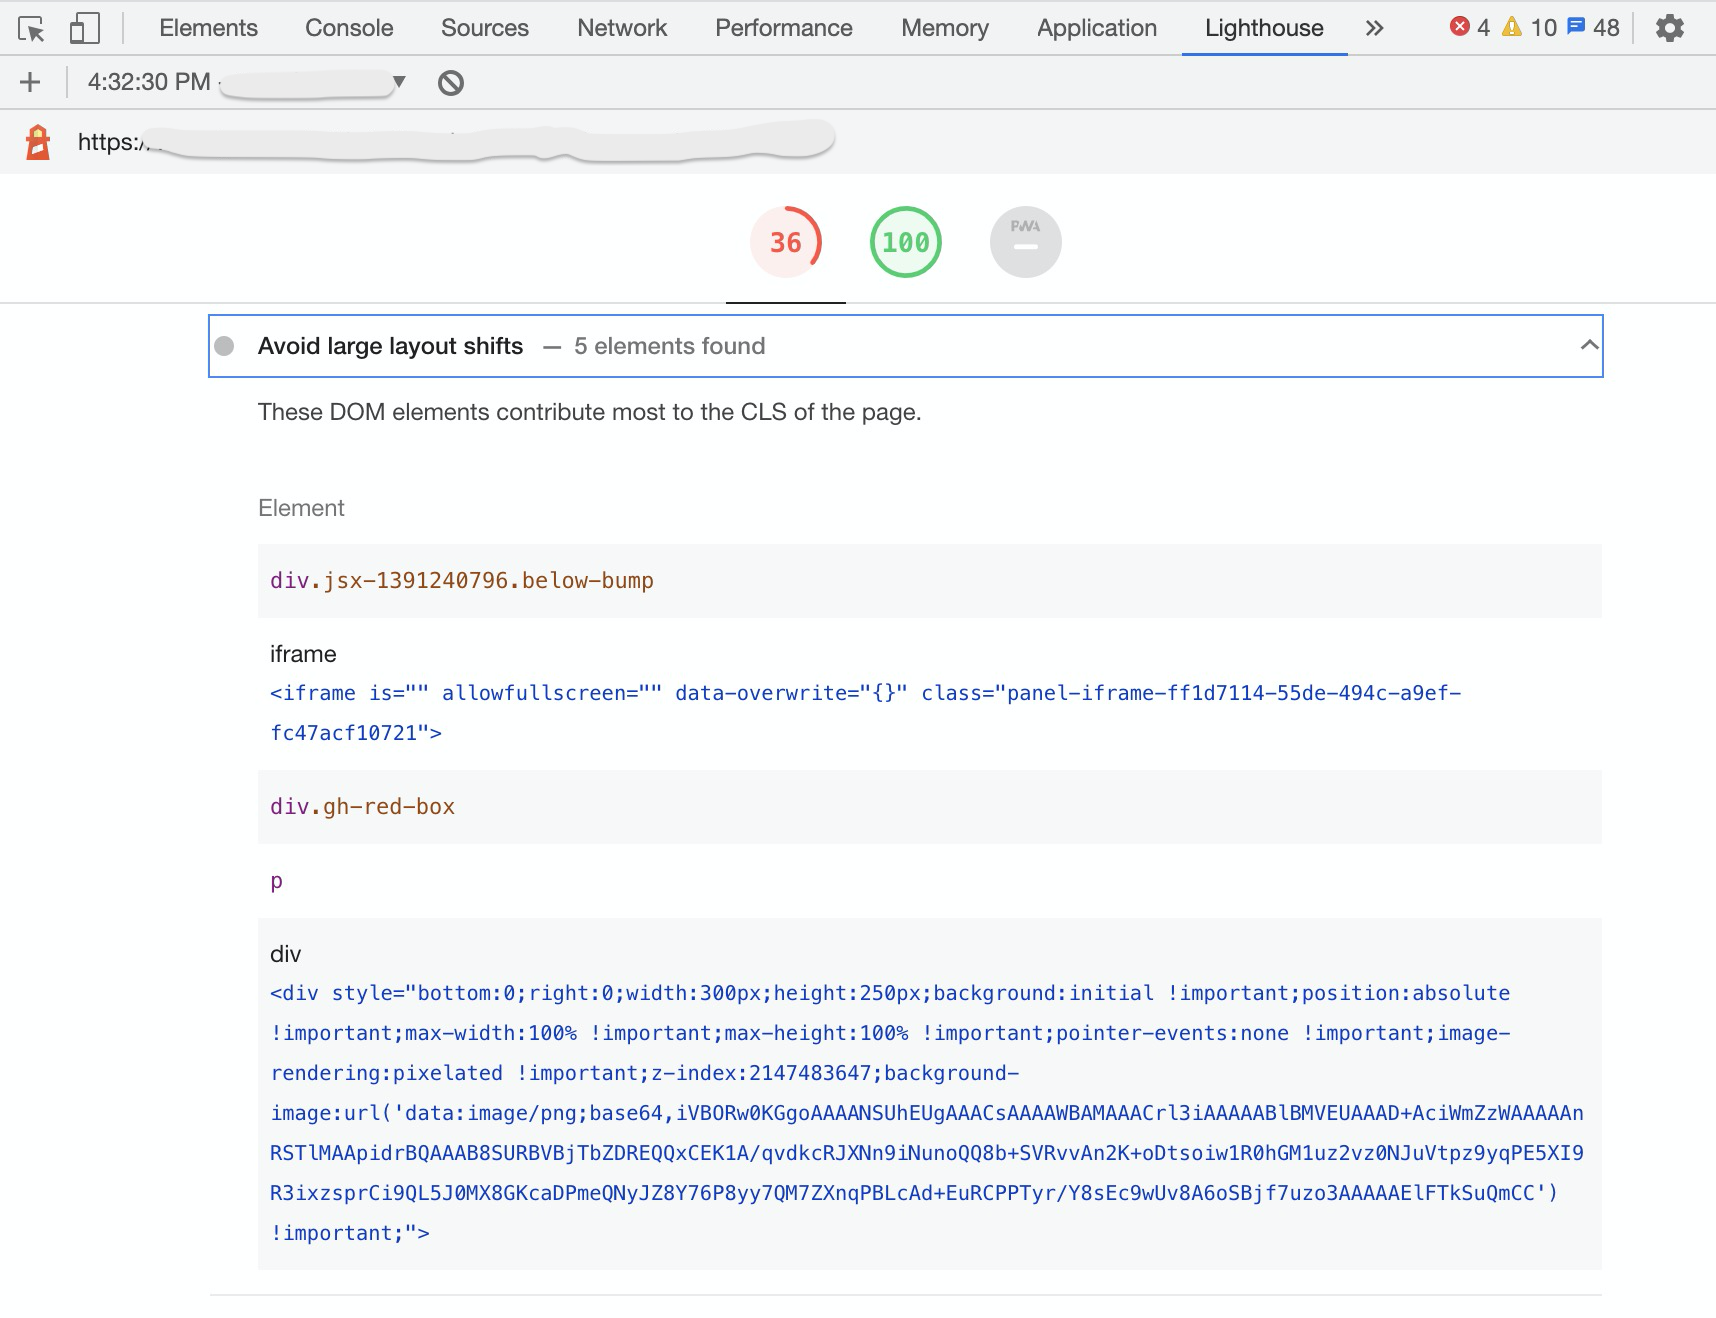
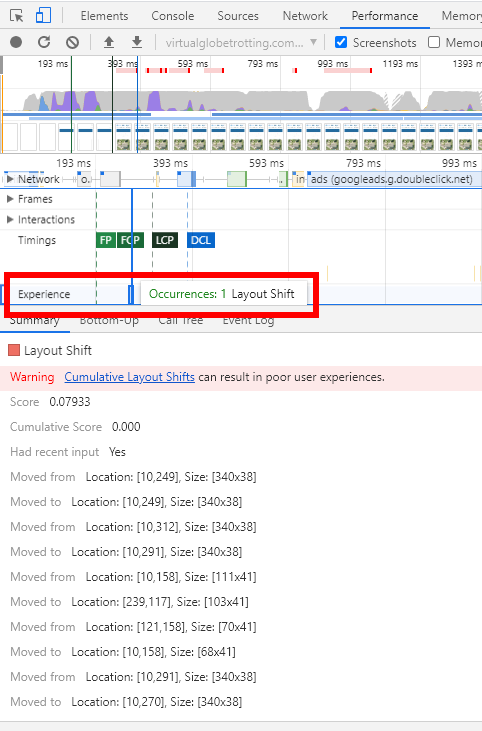
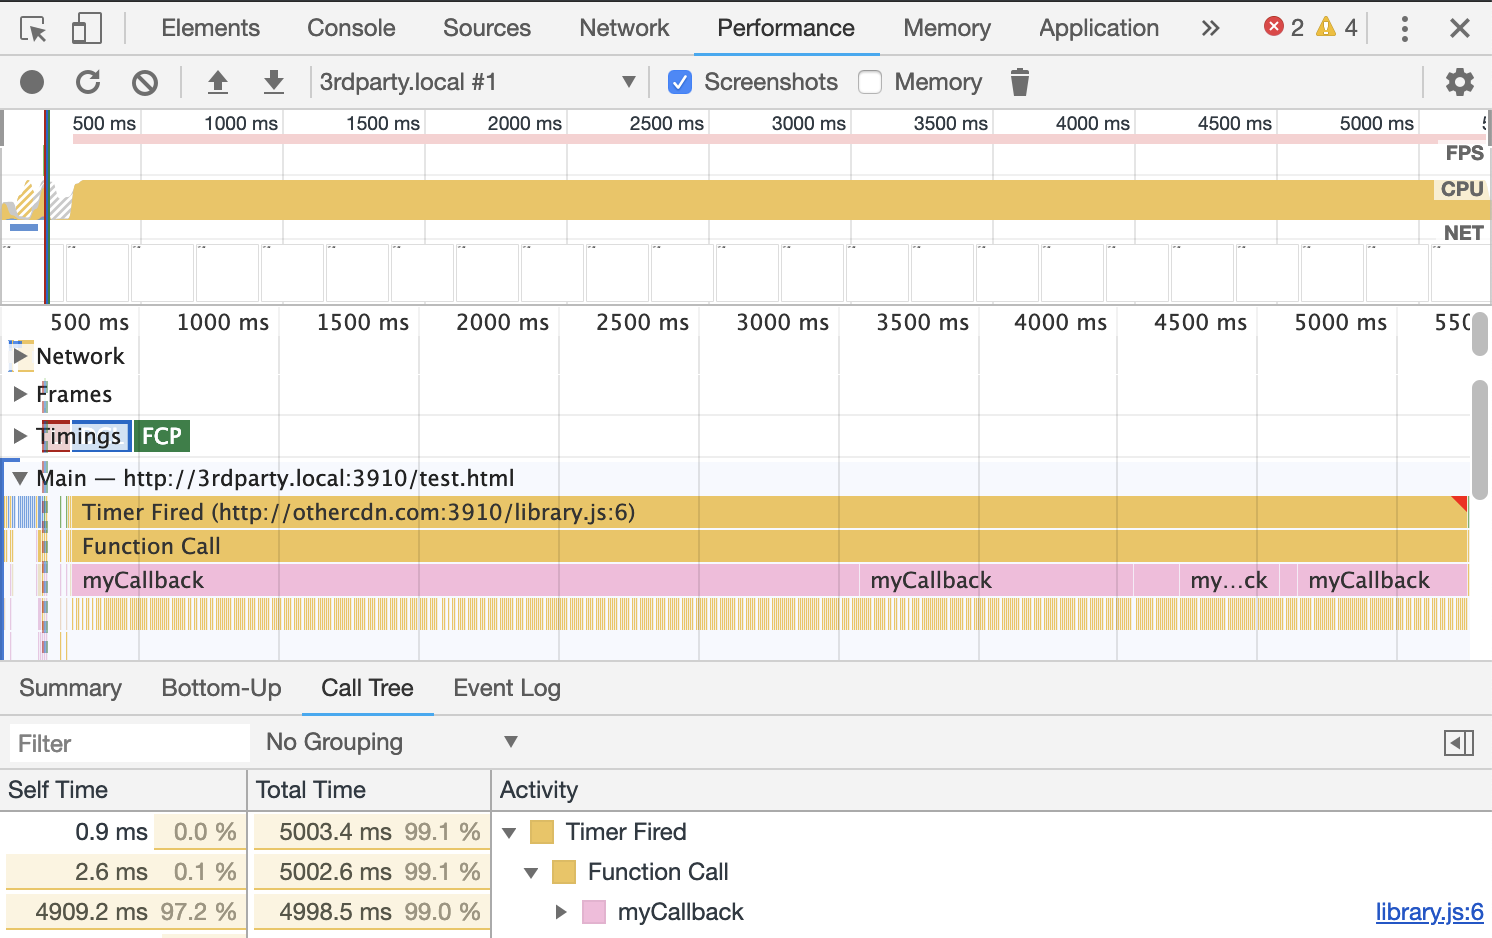
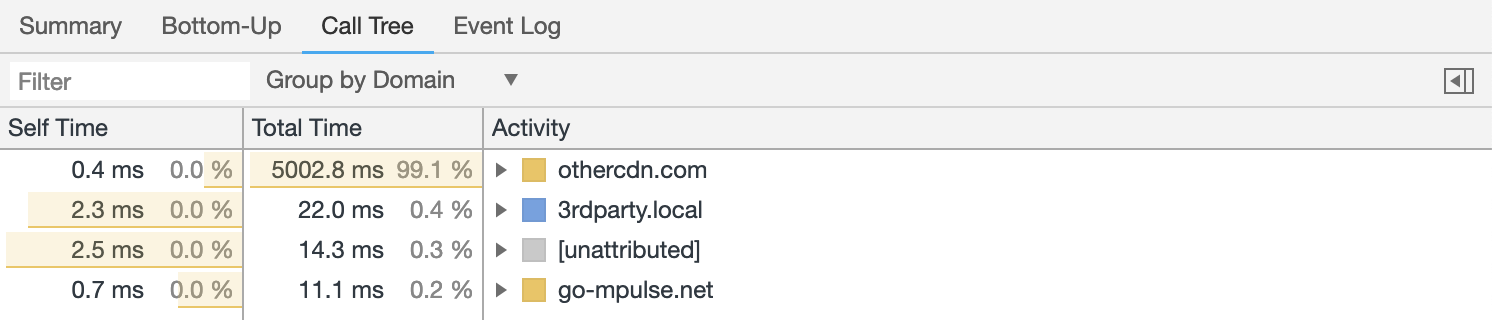
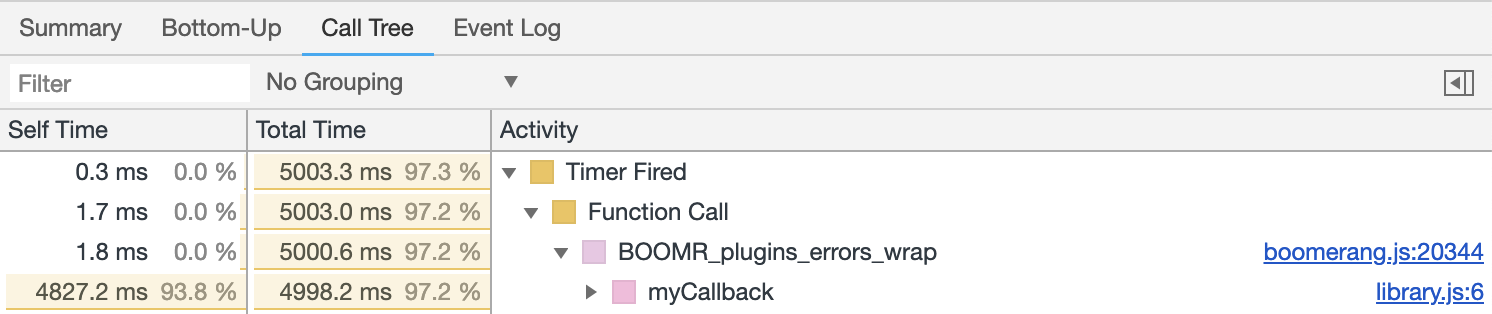
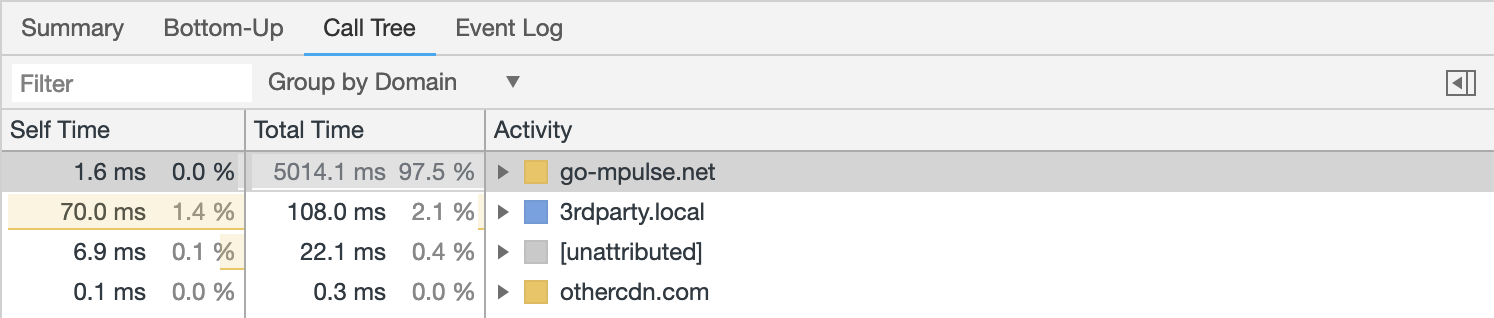
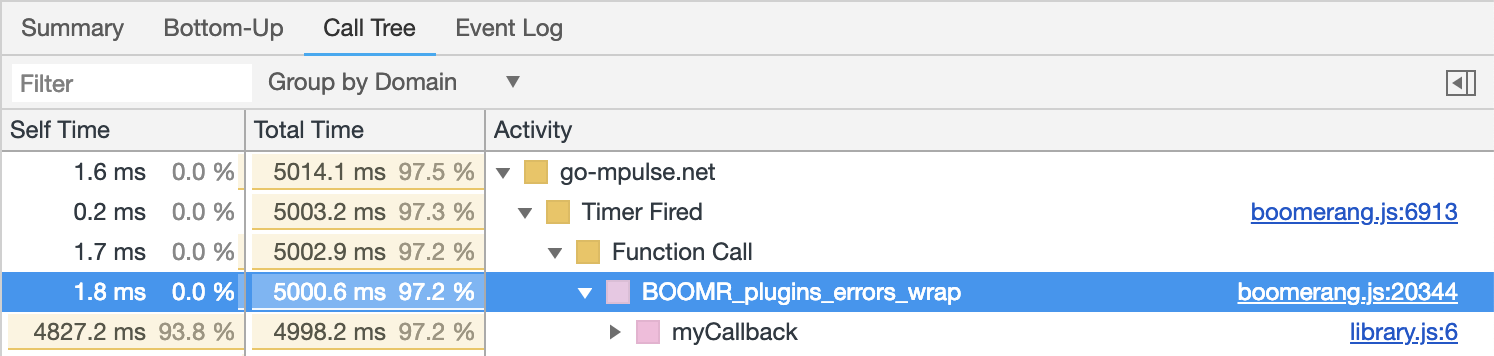
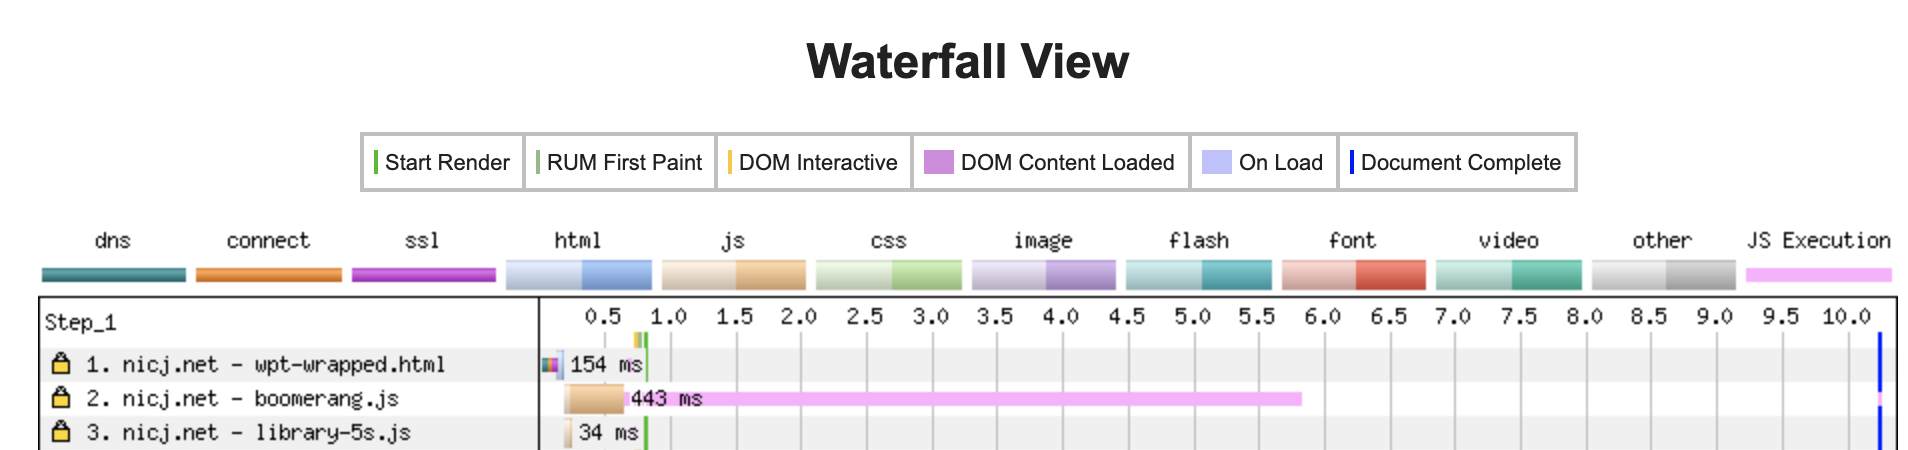
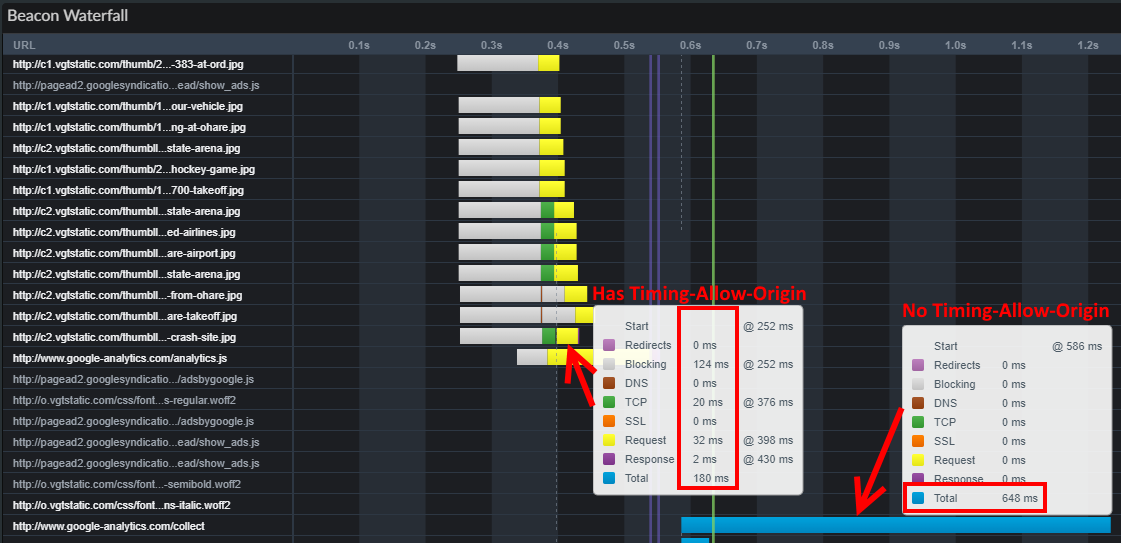
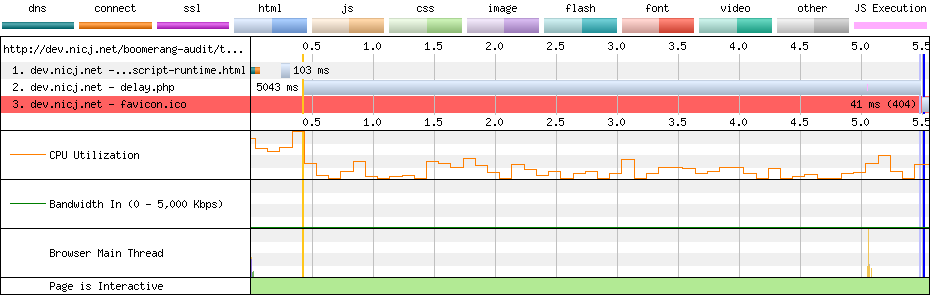
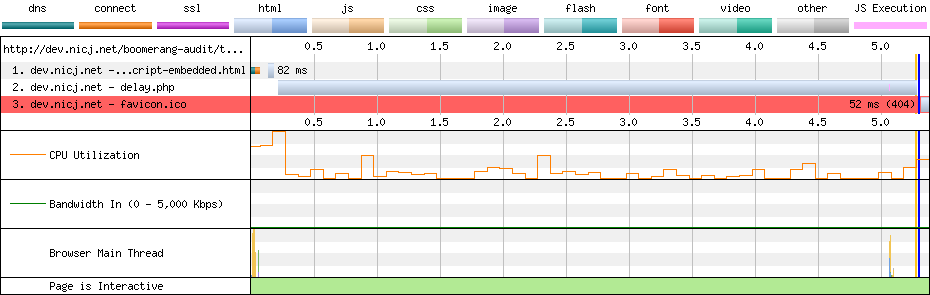
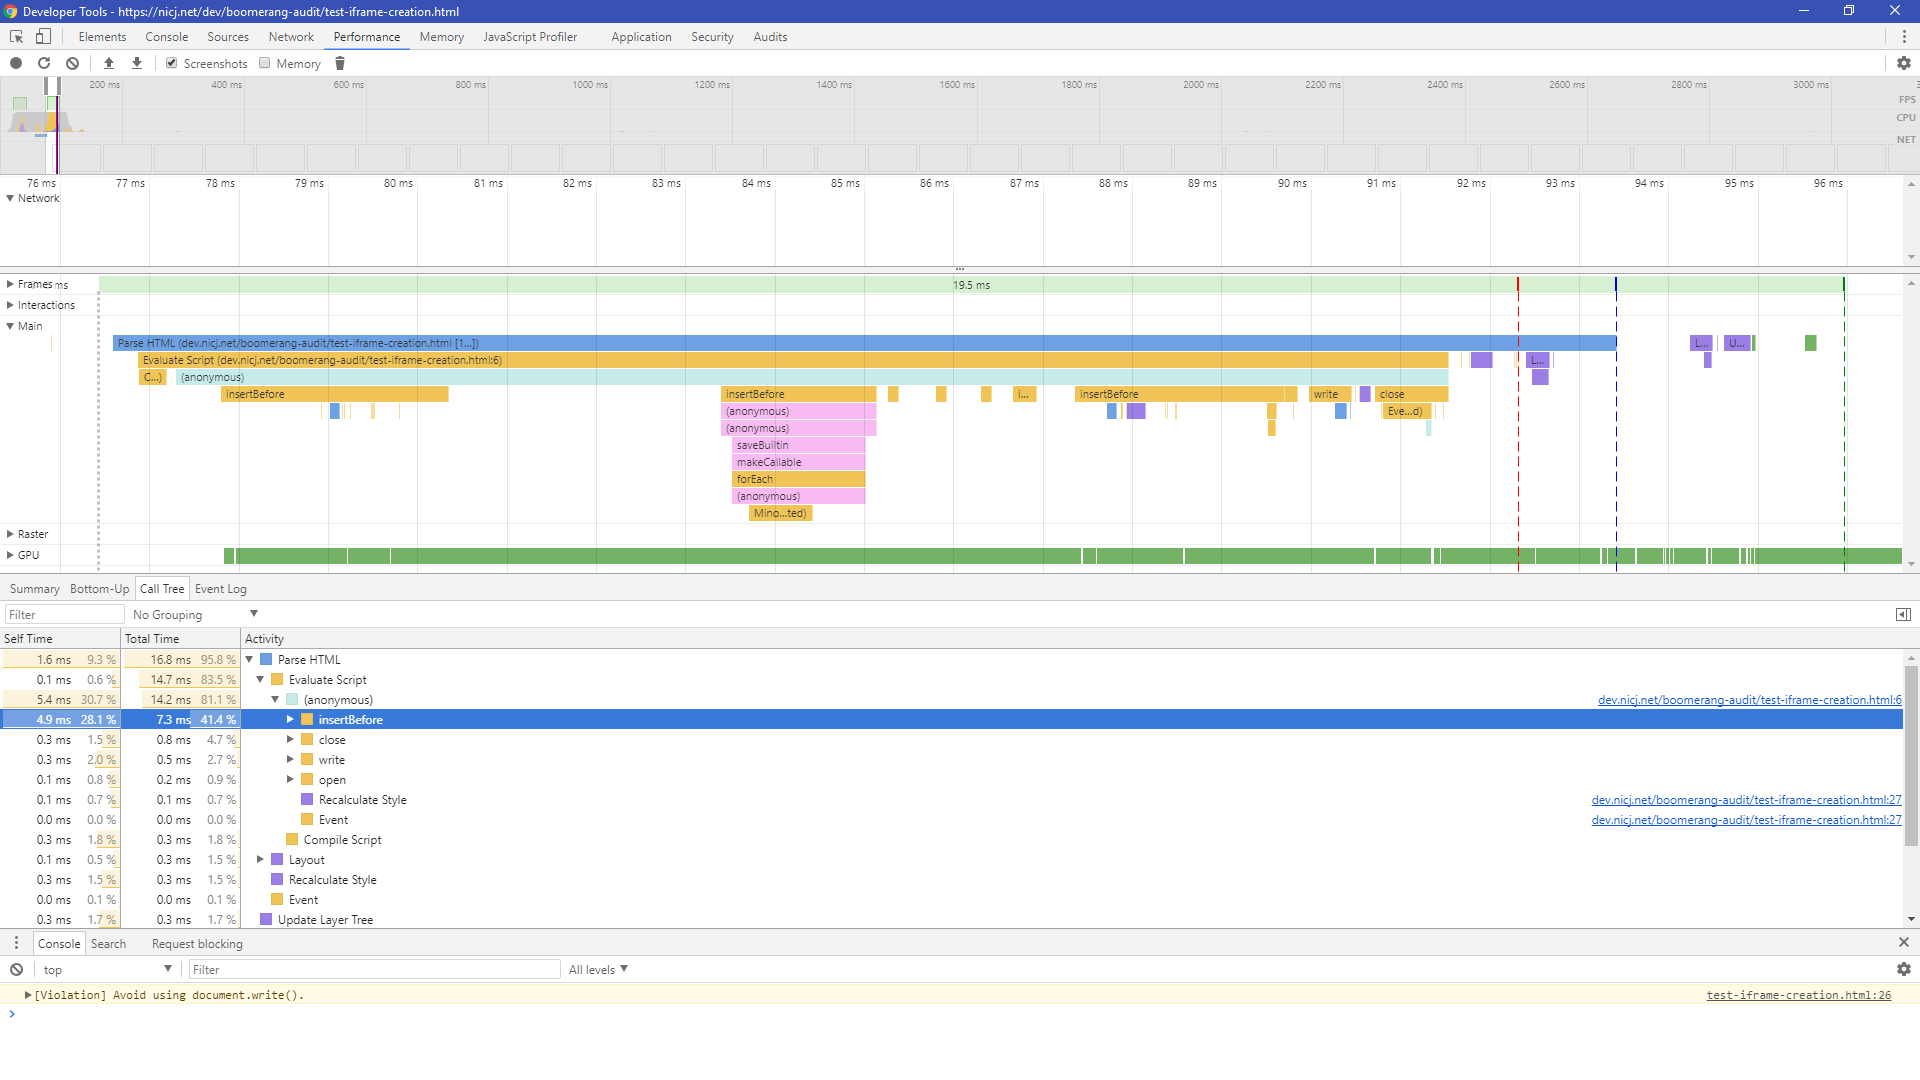
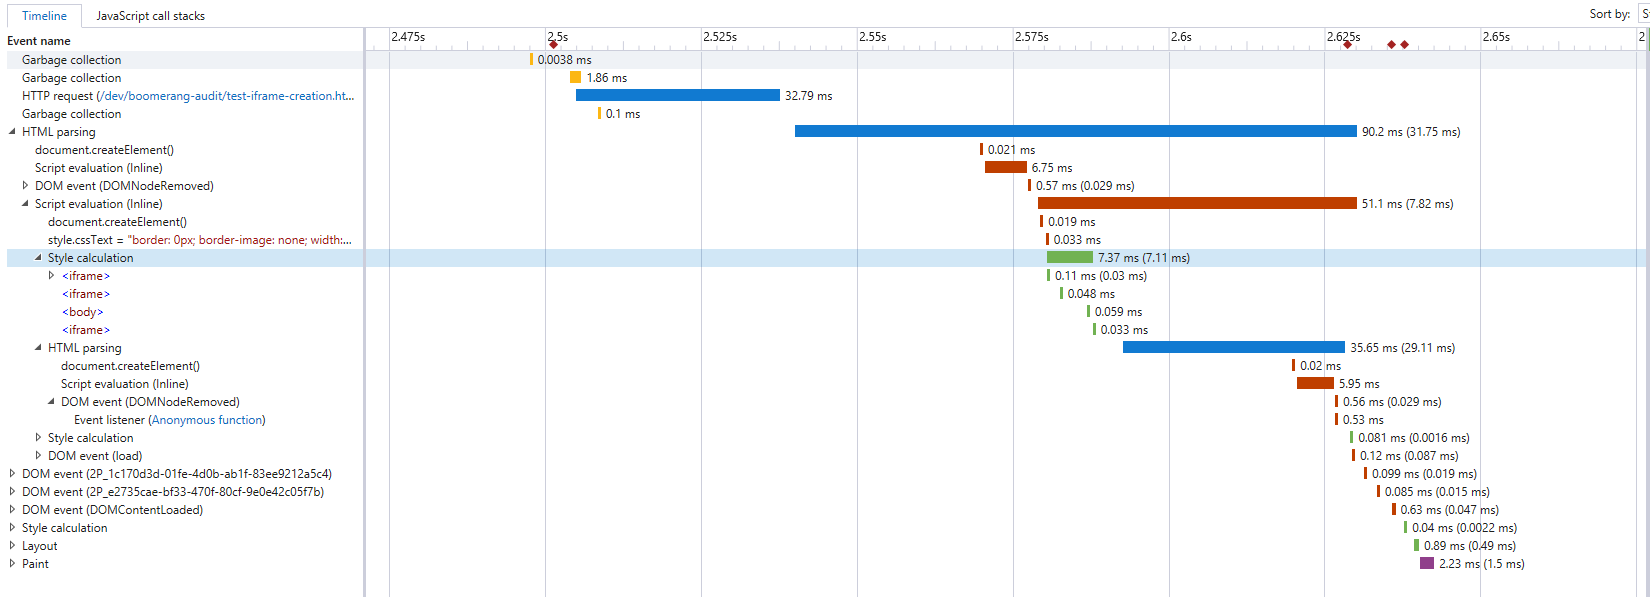
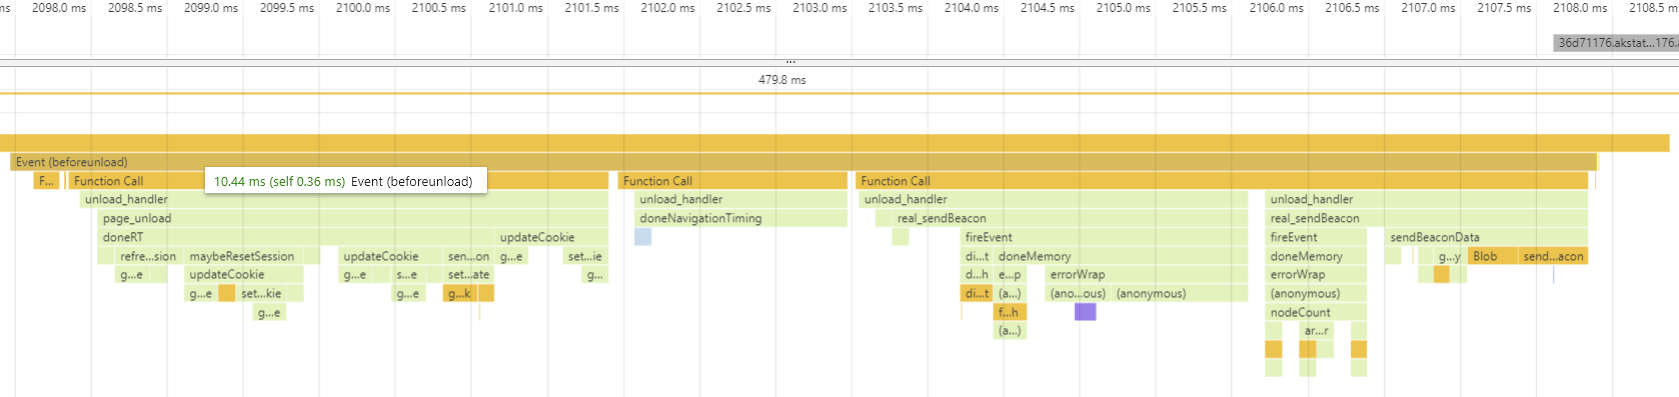
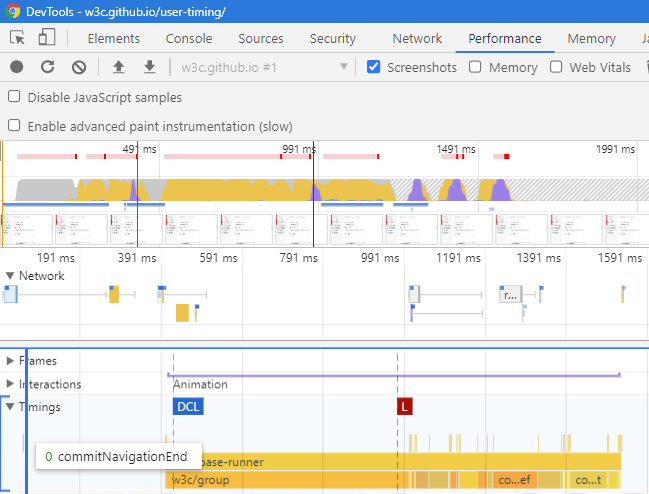
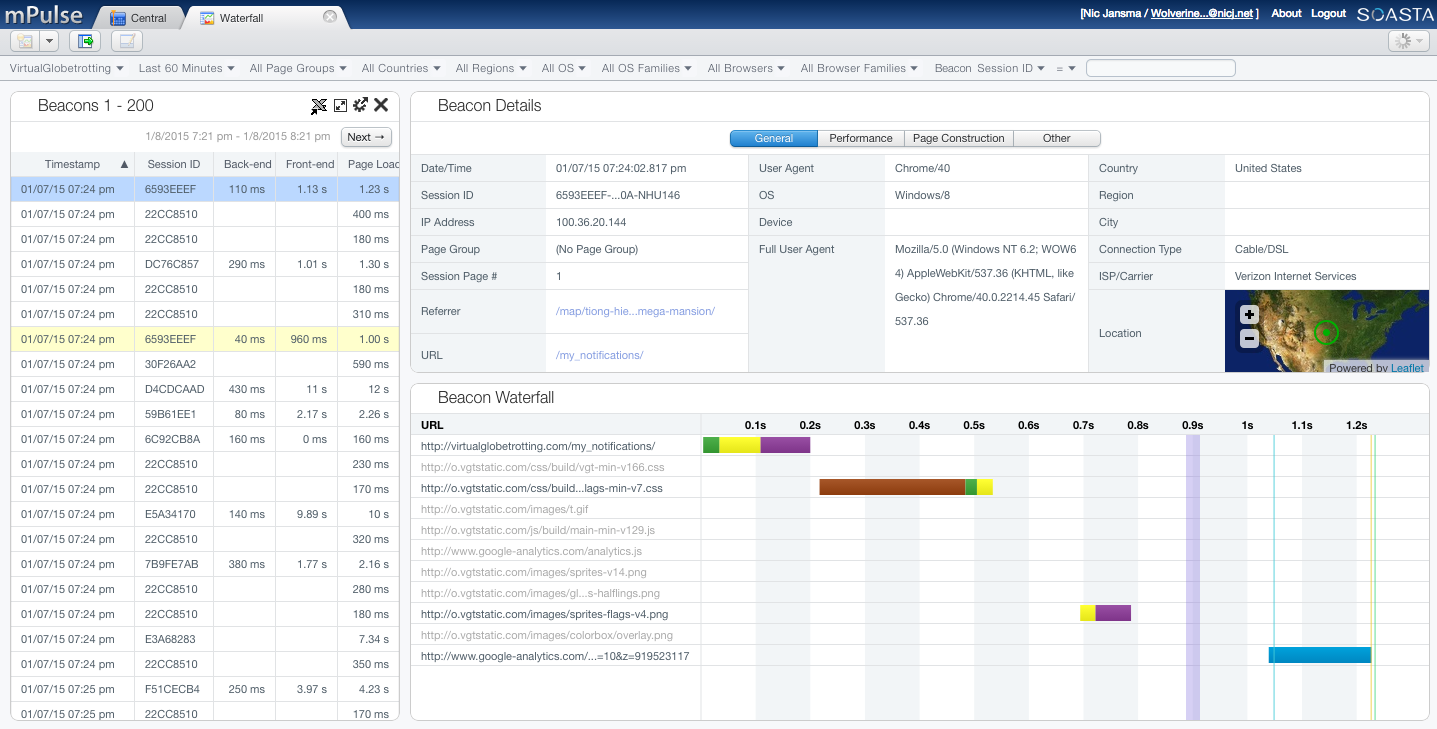
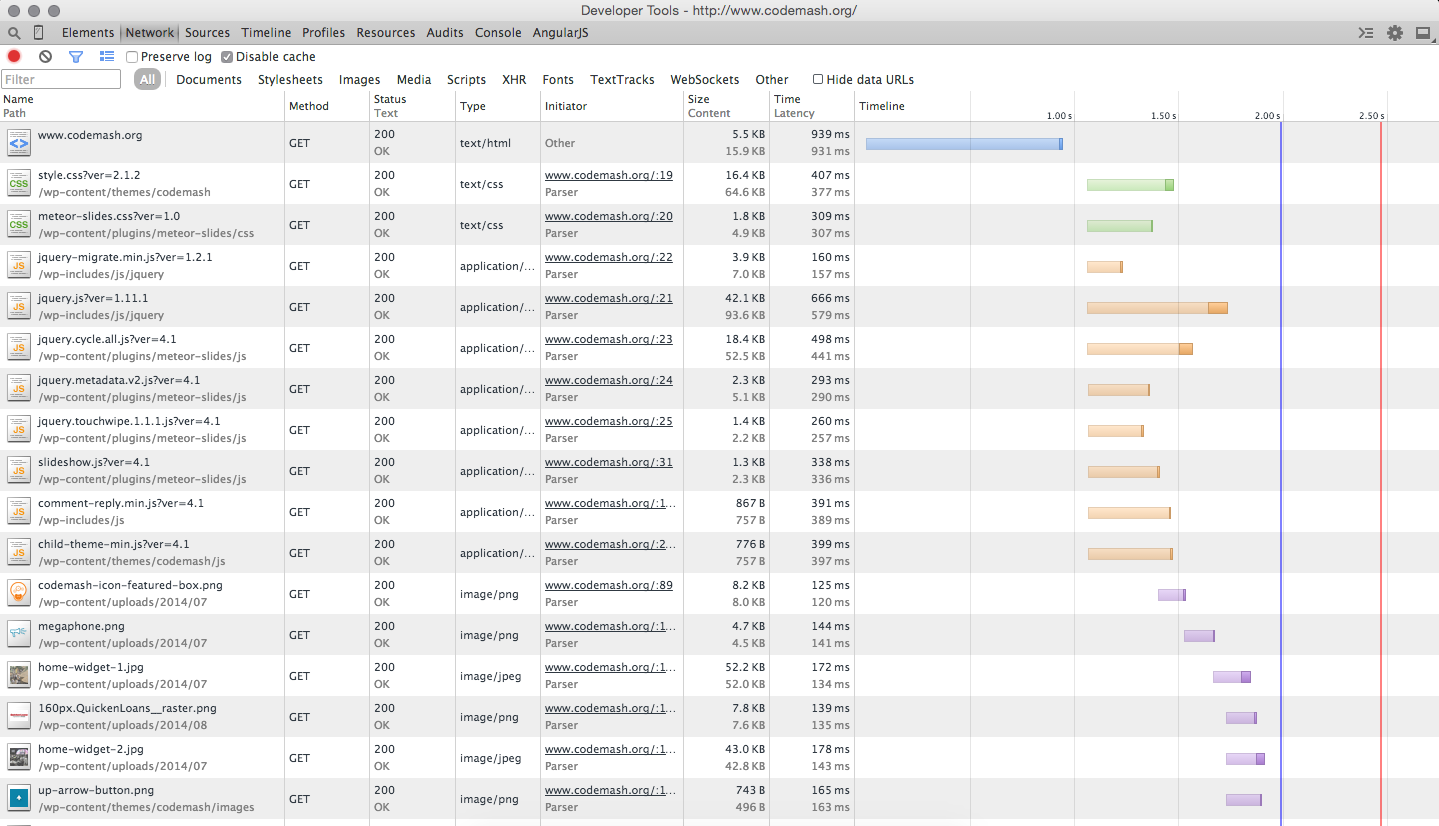
- Pending Beacon requests were hard to debug due to the beacons not showing up in Chrome Developer Tools.
- Since the API is now
fetch()-based, this has been resolved and they now show up. Great!
- Since the API is now
fetchLater() API
The fetchLater() API is an evolution of the Pending Beacon API (based on feedback from the community and the other browser vendors), and it aims to allow developers to send a "deferred" fetch().
Why would you want to defer your fetches? A primary use-case is for beaconing data from a web app for analysis/analytics purposes. Deferred fetches can be useful when exfiltrating telemetry, i.e. when that beacon contains a payload that is not required for building the webpage or presenting anything to the visitor.
The goal of fetchLater() is to provide an API to developers where they can "queue" data to be sent at a later date — either after a timeout, or, at the point the page is about to be unloaded.
This helps developers avoid having to explicitly send beacons themselves in events like pagehide or visibilitychange (which don’t always fire reliably).
The API looks similar to a regular fetch(), which developers should be familiar with.
Here’s an example of using the fetchLater() API to send a beacon when the page is being unloaded (or a maximum of 60 seconds after "now"):
// queue a beacon for the unloading or +60s
fetchLater(beaconUrl, {
  activateAfter: 60000
});
The API is still being discussed, and is actively evolving based on community and browser vendor feedback.
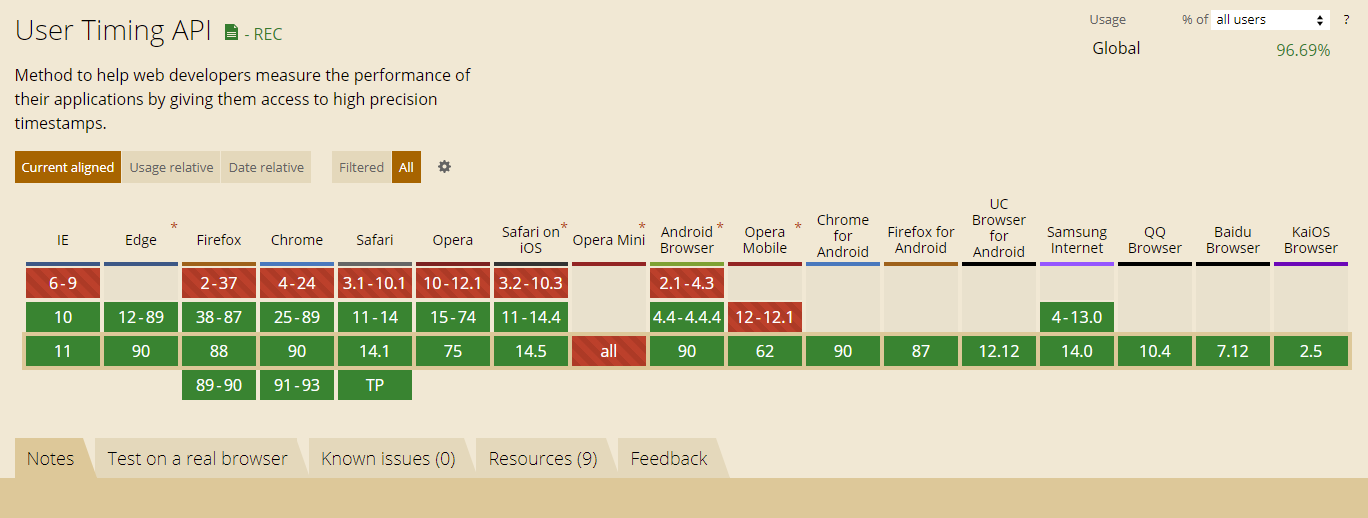
If you want to experiment with fetchLater() in Chrome today, you can register for an Origin Trial for Chrome 121-126.
One of the challenges highlighted in the Beaconing In Practice article is how to reliably send data once it’s been gathered in a web app.
Developers frequently use events such as beforeunload/unload or pagehide/visibilitychange as a trigger for beaconing their data, but these events are not reliably fired on all platforms. If the events don’t fire, the beacons don’t get sent.
For example, if you want to gather all of your data and only send it once as the page is unloading, registering for all 4 of those events will only give you ~82.9% reliability in ensuring the data arrives at your server, even when using the sendBeacon() API.
So, wouldn’t it be lovely if developers had a more reliable way of "queuing" data to be sent, and have the browser automagically send it once the page starts to unload? That’s where fetchLater() comes in.
The fetchLater() API gives developers a way to build a "deferred" beacon. That deferred beacon will then be sent at the timeout, or, as the page is unloading. It can also be aborted before then, if desired. As a result, developers no longer need to listen to the beforeunload/unload/pagehide/visibilitychange events to send data.
Ideally, fetchLater() will be a mechanism that can replace usage of sendBeacon() in browsers that support it, giving more reliable delivery of beacon data and better developer ergonomics (by not having to listen for, and send data during, unload-ish events).
fetchLater() evolved from the Pending Beacon API, based on feedback from other browser vendors and the web performance community.
Pending Beacon was a brand new API that allowed you to configure a few timeouts, send/update the payload, and force the beacon out immediately:
var pb = new window.PendingGetBeacon(beaconUrl, {
    timeout: 0,
    backgroundTimeout: -1
});
pb.setData(1);
pb.sendNow();
// or
pb.deactivate();
Rather than creating an entirely new PendingGetBeacon() interface, fetchLater() is merely a mirror of fetch() with one additional optional parameter (activateAfter). The deferred fetch can still be aborted (via an AbortController) like a normal fetch().
fetchLater(beaconUrl, {
    activateAfter: 0
});

// can't be updated, but you can use an AbortController to create a new one
// no need for .sendNow()
// can be deactivated with an AbortController
One other difference with PendingBeacon was that it had a backgroundTimeout option, which would send a beacon after the specified number of milliseconds when the page entered the next hidden visibility state (or was abandoned):
var pb = new window.PendingGetBeacon(beaconUrl, {
    backgroundTimeout: 1000
});
This behavior is not available in fetchLater(), though you could replicate it manually:
fetchLater(beaconUrl);

document.addEventListener("visibilitychange", () => {
  if (document.hidden) {
    setTimeout(function() {
      if (document.hidden) {
        fetchLater(beaconUrl);
      }
    }, 1000);
  }
});
This feels more straightforward to use, and avoids one of the traps I fell into when experimenting with Pending Beacon last time (see next section).
What I Got Wrong Last TimeWhen I was experimenting with Pending Beacon last year, there were two big issues I found with regards to reliability:
- During
onloadPending Beacon (withtimeout:0) was about 1.2% less reliable thansendBeacon() - During
pagehideandvisibilitychangePending Beacon (withtimeout:0), on Mobile, was about 17.9% less reliable thansendBeacon()
Both of these scenarios utilized Pending Beacon with a { timeout: 0 } option, meaning I was asking the browser to send the beacon right away.
Here’s example code for what it looked like:
new window.PendingGetBeacon(beaconUrl, {
    timeout: 0,
    backgroundTimeout: -1
});
What I missed, however, was that the Pending Beacon interface had a method .sendNow() that would tell the browser to actually send it immediately.
Here’s what I should have done:
let b = new window.PendingGetBeacon(beaconUrl, {
    timeout: 0,
    backgroundTimeout: -1
});
b.sendNow(); // <-- forgot to do this last time
In talking with the Chrome engineers, we think that excluding the .sendNow() may have caused the drop in reliability — timeout: 0 alone wasn’t enough to force the beacon to send right away.
This was especially important in the page-is-unloading scenario (in pagehide and visibilitychange listeners) as not forcing with .sendNow() meant the browser didn’t prioritize sending the payload prior to exiting the page/app.
fetchLater() Experiments
Given those goals, I was curious to see how reliable fetchLater() would be compared to existing APIs like XMLHttpRequest (XHRs) or the sendBeacon() API. I performed several experiments comparing how reliably data arrived after using one of those APIs in different scenarios.
Let’s explore these questions:
- Can we swap
fetchLater()in for usage of XHR and/orsendBeacon()in unload event handlers? - How reliable is using only
fetchLater()‘sactivateAfter, rather than listening to event handlers?
Where possible, I will also mention how fetchLater() compares with the previous API shape (Pending Beacon).
Over the course of 3 months, on a site that I control (with approx 2.5 million samples), I ran an experiment gathering data from browsers using the following three APIs:
An A/B/C experiment was run distributing the test across those APIs, which all sent a small GET request (~100 bytes) back to the same domain / origin.
For all of the data below, I am only looking at Chrome and Chrome Mobile v121-126 (per the User-Agent string) with support for window.fetchLater(), to ensure a level playing field. The data in Beaconing In Practice looks at reliability across all User-Agents, but the experiments below will focus solely on browsers supporting the fetchLater() API.
(It appears Edge, Opera and Samsung Internet Browser participate in Origin Trials and are sending data as well. I excluded those UAs to keep the results consistent)
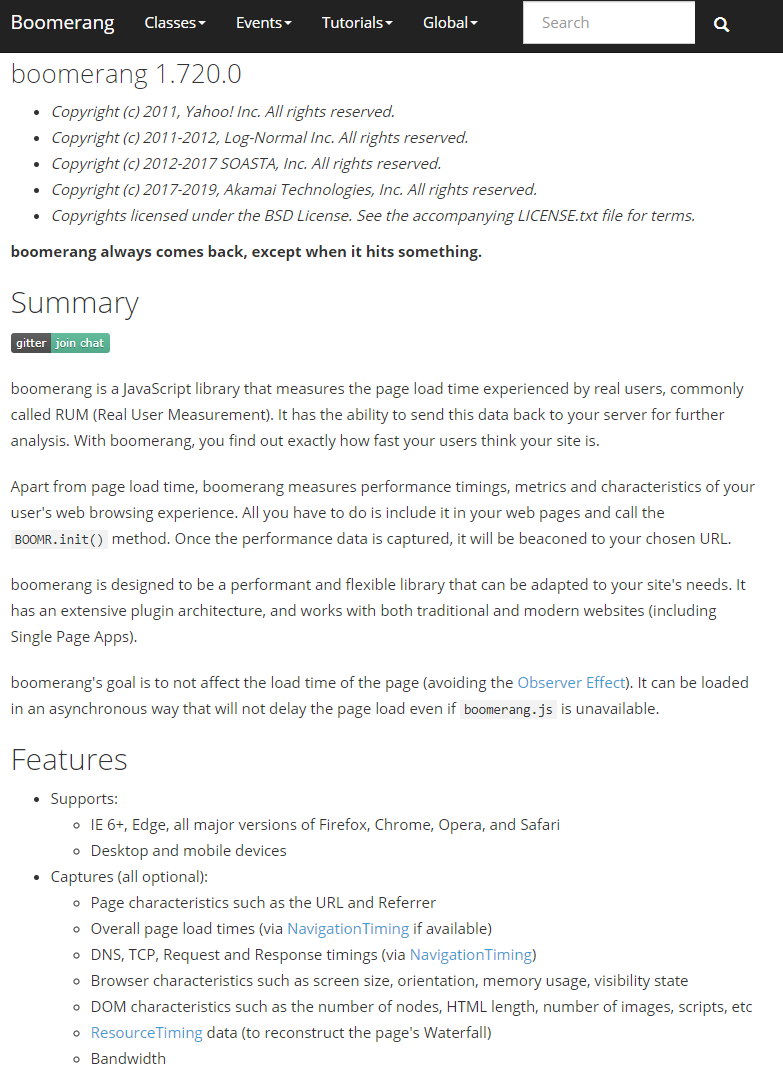
Reliability ofXMLHttpRequest vs. sendBeacon() vs. fetchLater() in Event Handlers
The first question I wanted to know was: Can fetchLater() be easily swapped into existing analytics libraries (like boomerang.js) to replace sendBeacon() and XMLHttpRequest (XHR) usage, and retain the same (or better) reliability (beacon received rate)?
In boomerang for example, we listen to beforeunload and pagehide to send our final "unload" beacon. Can we just use fetchLater() with { activateAfter: 0 } in those events instead?
For this experiment, I segmented visitors into 3 equally-distributed A/B/C groups (given fetchLater() support):
- A: Force
fetchLater()(with{ activateAfter: 0 }so it was sent immediately) - B: Force
navigator.sendBeacon() - C: Force
XMLHttpRequest
Each group then attempted to send 6 beacons per page load:
- Immediately in the
<head>of the HTML - In the page
onloadevent - In the page
beforeunloadevent - In the page
unloadevent - In the page
pagehideevent - In the page
visibilitychangeevent (forhidden)
By seeing how often each of those beacons arrived, we can consider the reliability of each API, during different page lifecycle events. I’m only including results for page loads where the first step (sending data immediately in the <head>) occurred.
Let’s break the experimental data down by event first:
onload
The onload event is probably the most common event for an analytics library to fire a beacon. Marketing and performance analytics tools will often send their main payload at that point in time.
Here’s example code you could use to send data at onload:
function sendTheBeacon() {
    // XHR
    var xhr = new XMLHttpRequest();
    xhr.open('GET', beaconUrl, true);
    xhr.send();

    // sendBeacon
    navigator.sendBeacon(beaconUrl);

    // fetchLater
    fetchLater(beaconUrl, { activateAfter: 0 });
}

window.addEventListener("load", sendTheBeacon, false);
Based on our experimentation, when firing a beacon just at the onload event, fetchLater() appears to be slightly more reliable than sendBeacon() and XHR:

The numbers are very close though, with approximately a half-million samples in each bucket, there is less than a 1% difference between the three APIs.
This result is different than the Pending Beacon experimentation last year, which showed Pending Beacons coming in less reliably than sendBeacon() — likely due to not using .sendNow() in that experiment.
Broken down by Desktop and Mobile:


The results are ordered the same across desktop and mobile — all within less than 1 percent reliability difference of each other.
Note: that the above results are for only measuring a beacon sent immediately during the page’s onload event, without accounting for any abandons that happen prior to onload. That is why these numbers are so low — if a user abandoned the page prior to the onload event, they would not be counted in the above chart. See the additional breakdowns below for how these numbers change if you use the suggested abandonment strategy of listening to onload, pagehide and visibilitychange.
Great news that fetchLater() seems to be just as reliable (if not more) than sendBeacon() and XHRs during the onload event!
pagehide or visibilitychange
If the intent is to measure events that occur in the page beyond the onload event, i.e. additional performance or reliability metrics (such as Core Web Vitals or JavaScript errors), tools can send a beacon during one of the page’s unload events, such as beforeunload, unload, pagehide or visibilitychange.
Our recommended strategy is to listen to just pagehide and visibilitychange (for hidden), and not listen to the beforeunload or unload events (which are less reliable and can break BFCache navigations).
Example code:
window.addEventListener("pagehide", sendTheBeacon, false);
window.addEventListener("visibilitychange", function() {
    if (document.visibilityState === 'hidden') {
        sendTheBeacon();
    }
}, false);
So let’s look at the result of sending a beacon immediately during a pagehide or visibilitychange event (if a beacon was received for either event):

Here we see that sendBeacon() has a slight edge over fetchLater() — about 0.5% more reliable.
XHR trails much farther behind at only 83.% reliable. This is because XHRs can be aborted as the page is abandoned, or the user navigates away.
Let’s break it down by platform:

fetchLater() is nearly identical to sendBeacon() reliability on Desktop, with XHR trailing behind.
On Mobile:

fetchLater() trails a bit further behind sendBeacon() (1.1% less reliable).
I was hoping these pagehide and visibilitychange[hidden] numbers would mirror what we saw for onload, where fetchLater() would be slightly better than sendBeacon even. However, sendBeacon() appears to have a slight edge in reliability, most notably on mobile platforms when the page is unloading.
I will follow-up with the Chrome team to determine if there’s anything that could be contributing to this.
onload or pagehide or visibilitychange
Finally, let’s combine the above three events per the suggested abandonment strategy, and see how reliable each API is if we’re listening for all 3 events (and sending data once in any of them).
Of course, this increases the reliability of receiving beacons to the maximum possible, with sendBeacon() and fetchLater() able to get a beacon to the server over 98% of the time:

Broken down by Desktop vs. Mobile, we see that Desktop is has an extremely high rate of receiving beacons, 99% ore more:

While Mobile shows a bit less reliably results, but still over 97% for sendBeacon() and fetchLater():

From experimenting with using fetchLater() in event handlers, it seems to me that fetchLater() is nearly identical to sendBeacon() in reliability (and both are improvements over XHR).
If sending data during onload, fetchLater() is slightly more reliable than sendBeacon().
If sending data during pagehide or visibilitychange[hidden], sendBeacon() is slightly more reliable than fetchLater() (more pronounced on mobile). It’s probably worthwhile to look into this a bit further why.
NOTE: I measured the reliability of sending beacons during beforeunload and unload as well, but since those events are deprecated / not-recommended / unreliable / break BFCache events, I’ll skip those results in this post.
Here’s an interesting experiment: Let’s say you want to send a beacon to your analytics service, but you don’t have a strong opinion on when that data should be sent.
You don’t necessarily want to send it at startup, as that network request could conflict with the page’s important assets.
As long as it’s sent by the time the page is unloading, that’s good enough!
One naive way you could do this is just use a setTimeout(, n) and call sendBeacon() much later, after the page has fully loaded:
window.addEventListener("load", function() {
setTimeout(function() {
navigator.sendBeacon(beaconUrl);
}, 1000);
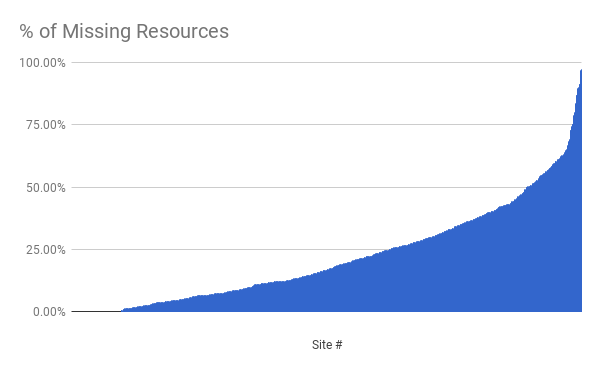
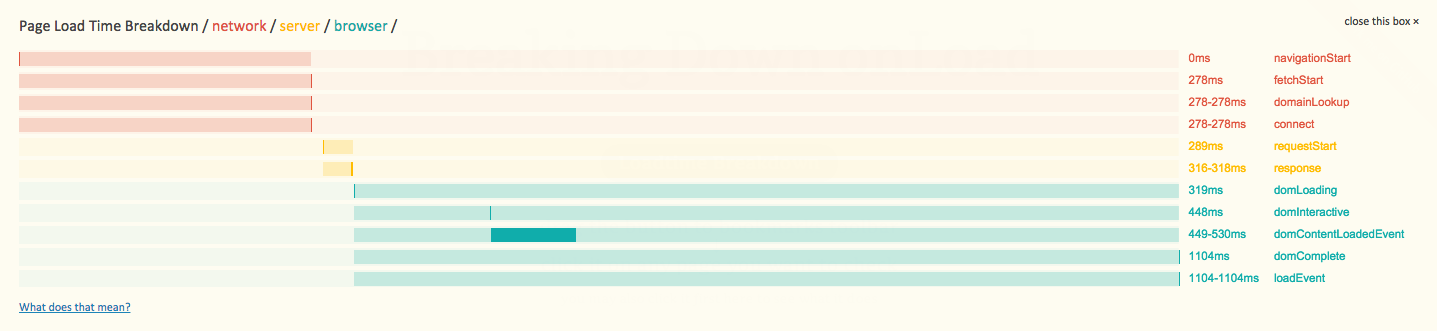
}, false);If you didn’t take into account an abandonment strategy, and you tried different values of N milliseconds, your reliability rate might look like this:
![]()
i.e. waiting 1 second after Page Load you’d only see 96.6% of beacons, while waiting for 60 seconds (and hoping they stick around on your page for 60 seconds) results in only 24.1% of beacons arriving (on this example site).
Of course, you wouldn’t do this in real-life: you’d listen for pagehide and visibilitychange, but this shows a worst-case example.
Here’s where fetchLater() comes in: you can actually use it blindly like this, and have much more positive results! Just specify a { activateAfter: n } value for your preferred delay:
fetchLater(beaconUrl, { activateAfter: 1000 });The fetchLater() results in doing this are pretty impressive:

Using a value of 1 second only results in 0.2% of beacons being lost, while a value of 600 seconds still gives you 93.7% of all beacons.
Setting activateAfter to a nearly-unlimited value (say 999999999999999), i.e. you’re asking fetchLater() to do all the heavy-lifting to send a beacon whenever the page is abandoned, we still see those beacons arrive 92.3% of the time.
While that isn’t 100% of the time, it’s a lot better and more ergonomic than having to listen to onload, pagehide, visibilitychange, etc.
Our previous experimentation showed that if you want to "hold" your data for unload, listening to all 4 unload-ish events (beforeunload, unload, pagehide, visibilitychange), sending a beacon in those events only resulted in ~82.9% reliability! So fetchLater() is 9.4% (in real terms) more reliable here.
And in the meantime, the draft fetchLater() could be aborted and replaced with additional data up until the page unloads (at which point you could let the "last" values go out, or even replace it again with any at-unload data you want to update).
This reliability varies by platform. If we zoom into using { activateAfter: 60000 } (60s), we can see that Desktop (99.0%) is a lot more reliable than Mobile (90.4%):

Regardless, fetchLater() offers some unique benefits for sending data.
As last time, I want to be open in saying that:
- Some of my methodology may be flawed.
- Last time I wasn’t using
.sendNow()with Pending Beacon, and that affected the reliability in page-unloading scenarios. - Luckily,
fetchLater()reduces the complexity a bit, and we now see reliability as-good-as or even better-thansendBeacon()most of the time
- Last time I wasn’t using
- These results were captured in a A/B/C test on one of my personal websites.
- Your results will vary!
- I also have noticed that over time the numbers for all results shift slightly. My A/B/C experimentation was happening simultaneously though, so shouldn’t be affected by changes in time.
- I’m open to review and criticism or feedback on other things to check.
Given that, there is one follow-up for fetchLater() that I would like to review:
- Why is
fetchLater()inpagehideandvisibilitychange[hidden]slightly less reliable thansendBeacon()?- I only saw ~0.2% less beacons, but I was hoping it would be equal or better!
Given the cool possibilities of fetchLater(), how do I envision taking advantage of it?
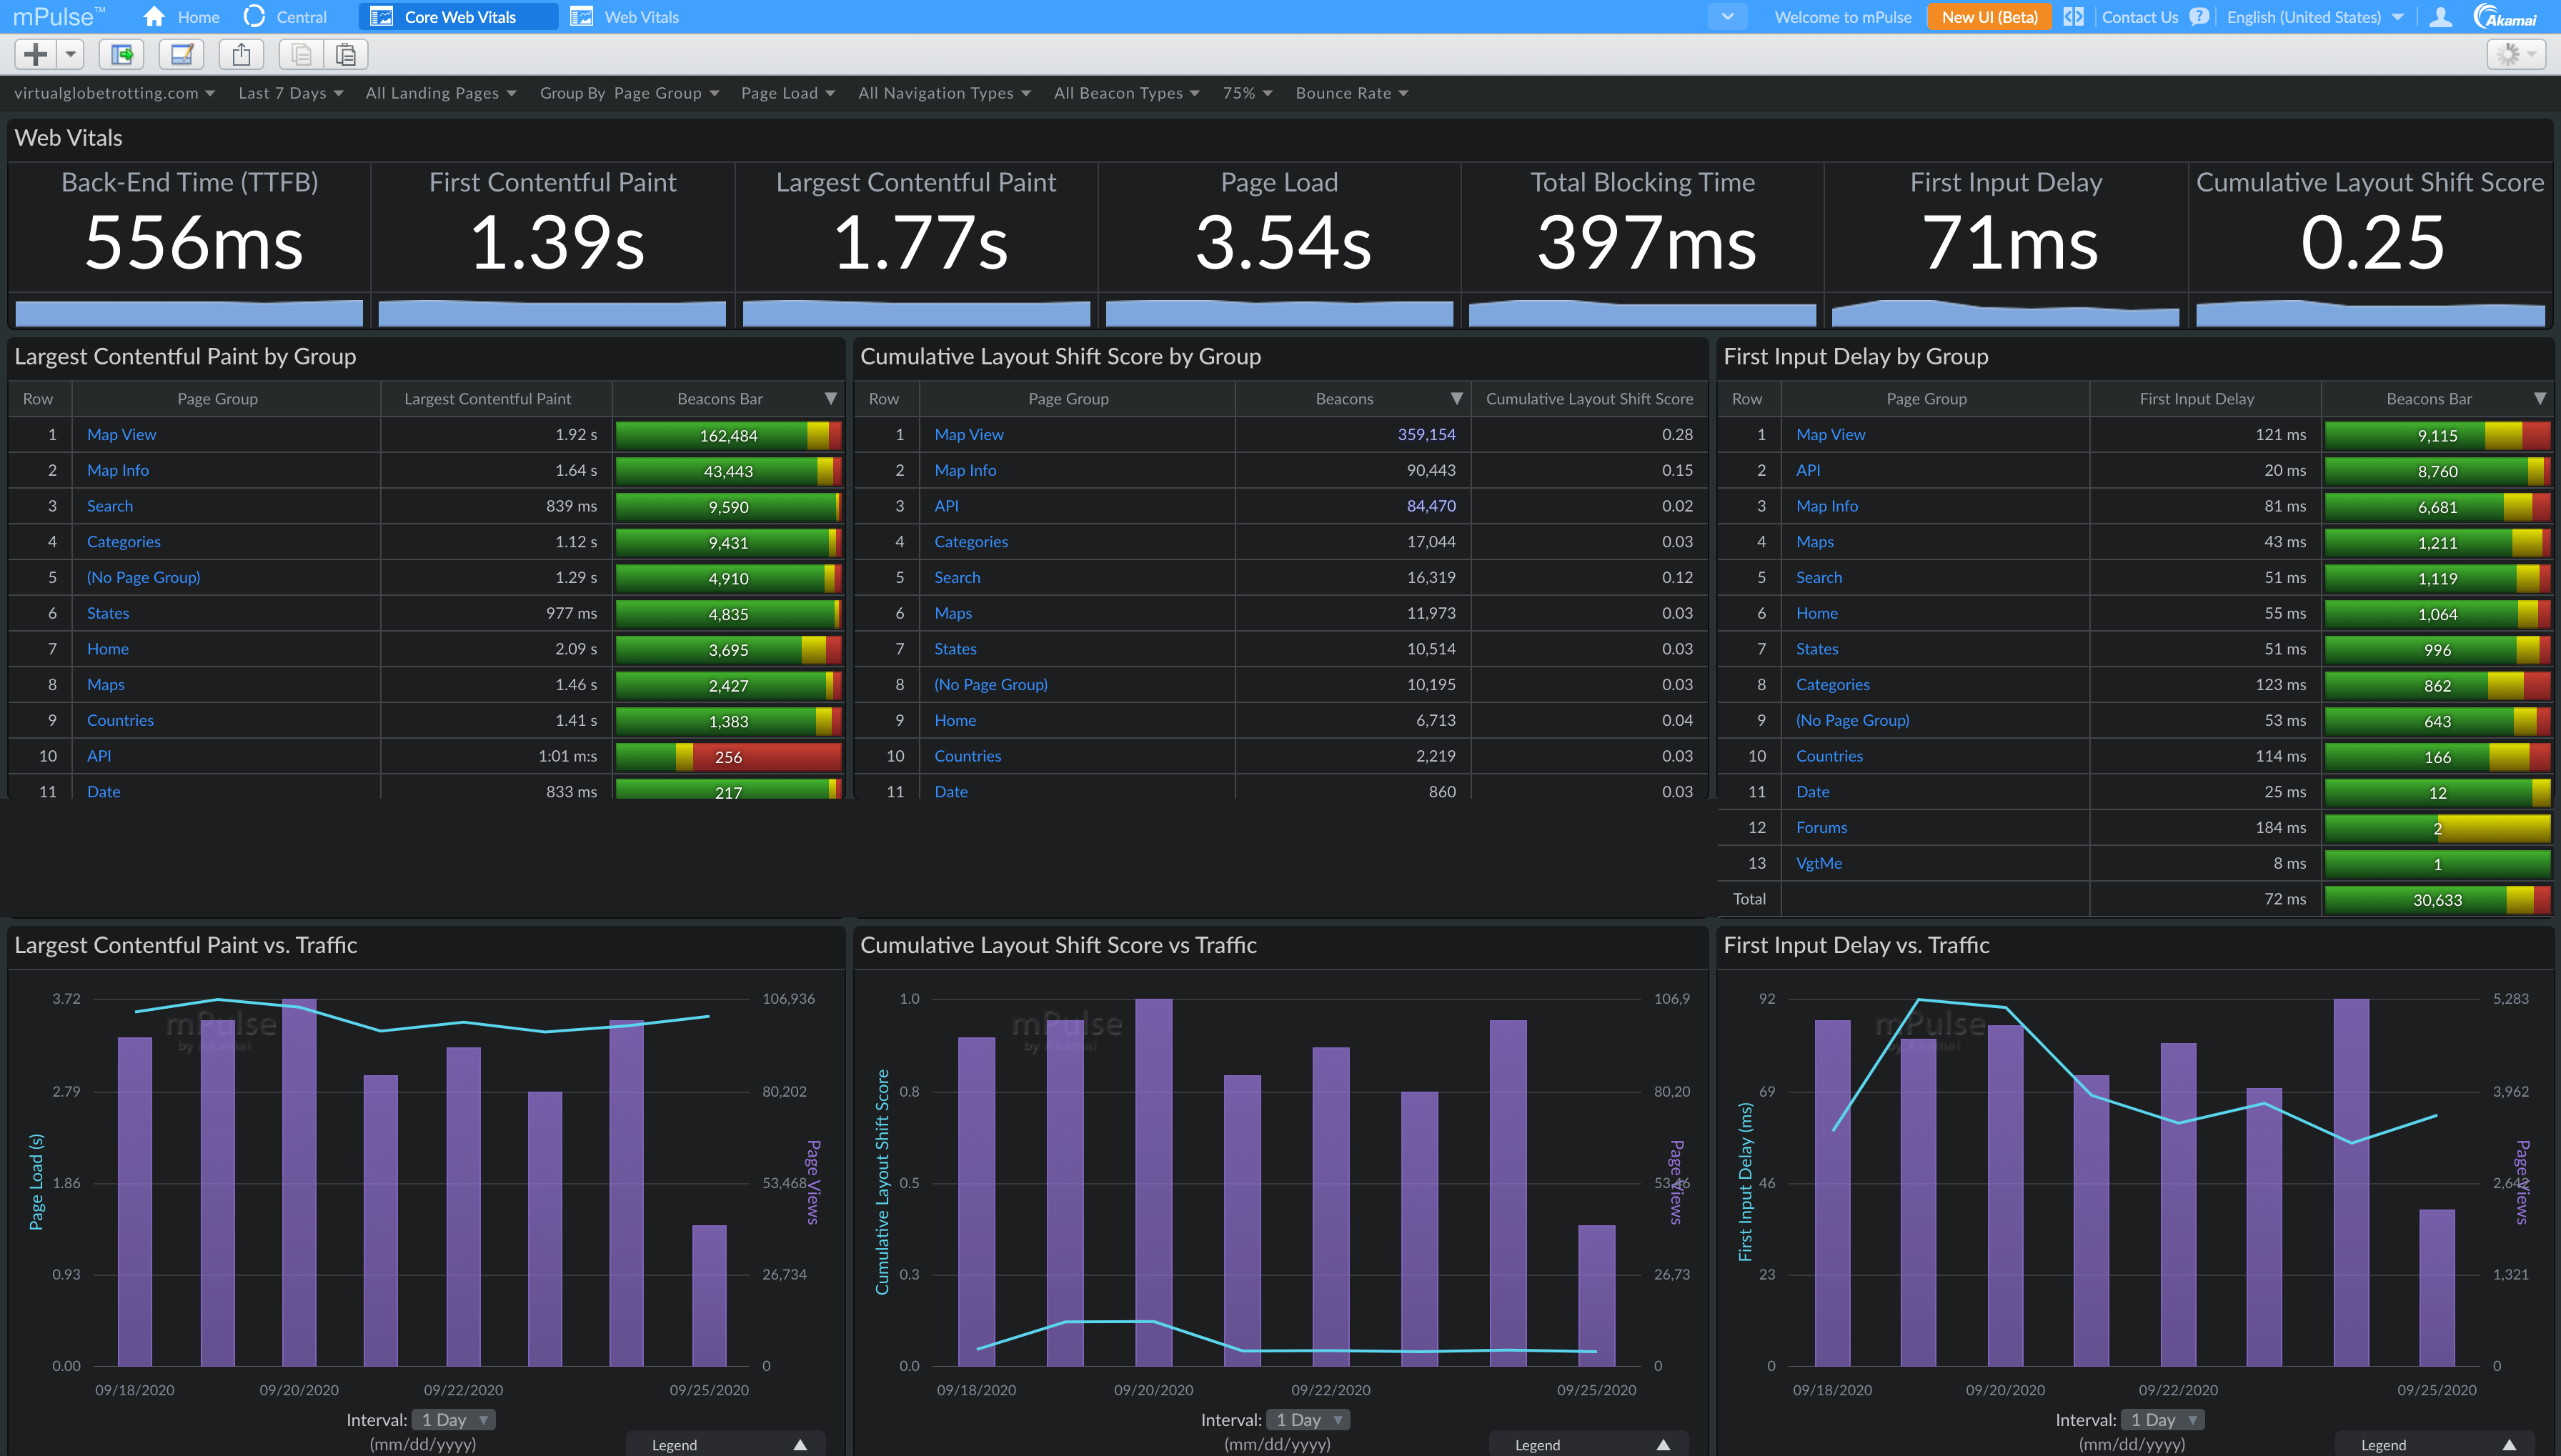
For boomerang.js (our RUM measurment tool we use at Akamai mPulse), we have a few different types of beacons we send:
- Our load beacon at the
onloadevent. This contains all of the performance information from the page. - An unload beacon at
pagehideandbeforeunload. This lets us know how long the user was reading the page. - Some websites have enabled an early beacon that gets sent immediately at page initialization, so we avoid any data loss from page abandonment (the user leaves before
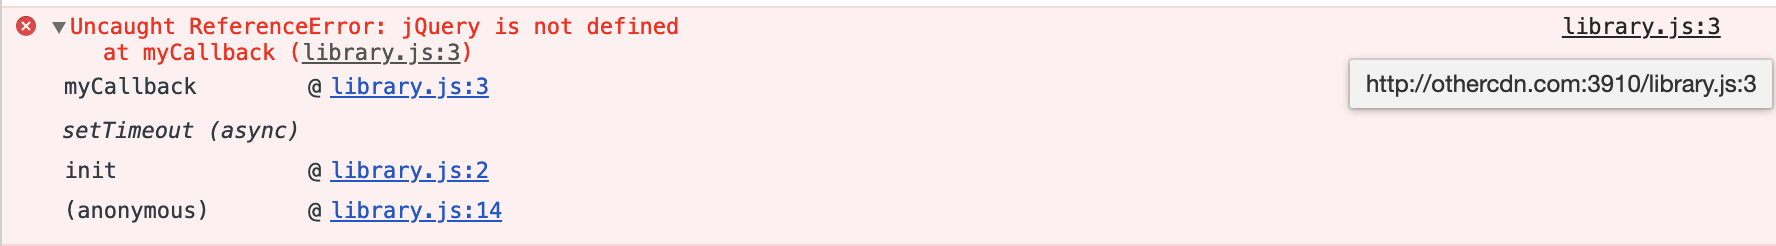
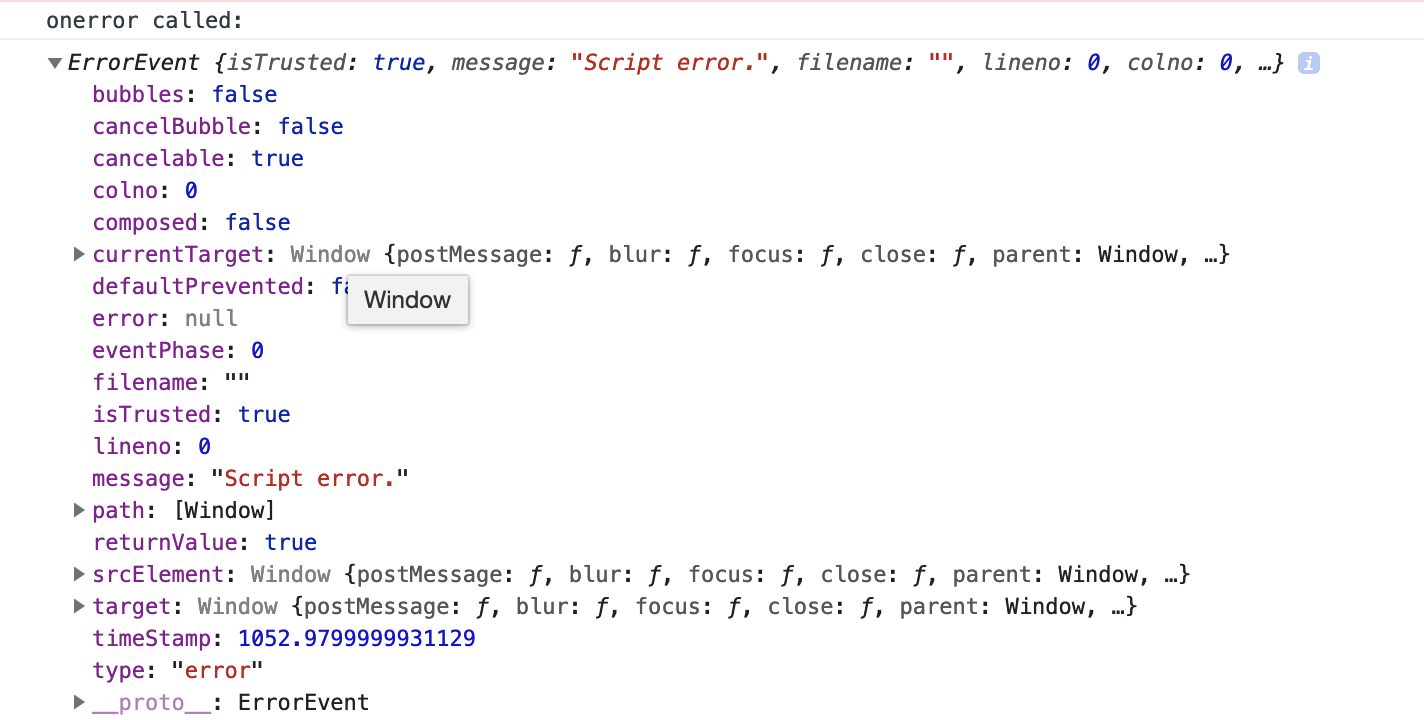
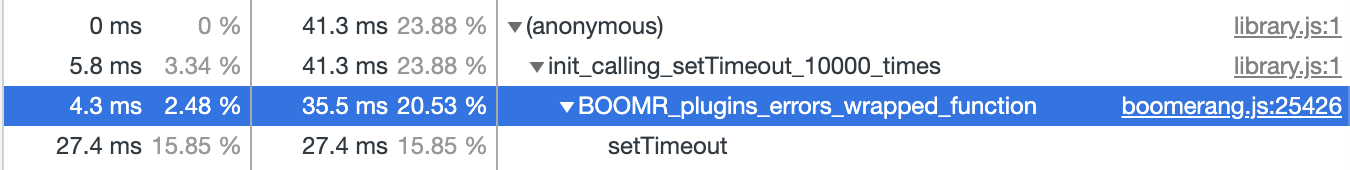
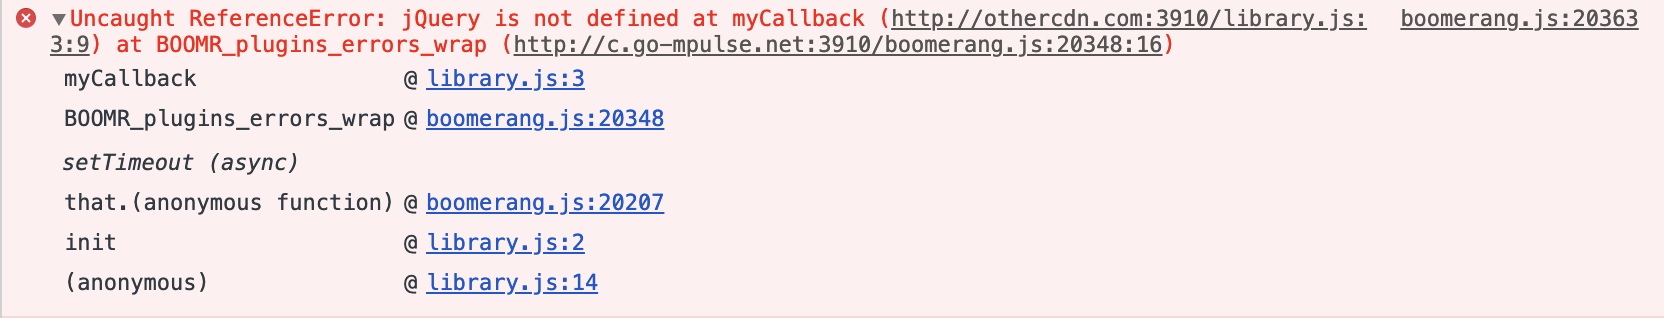
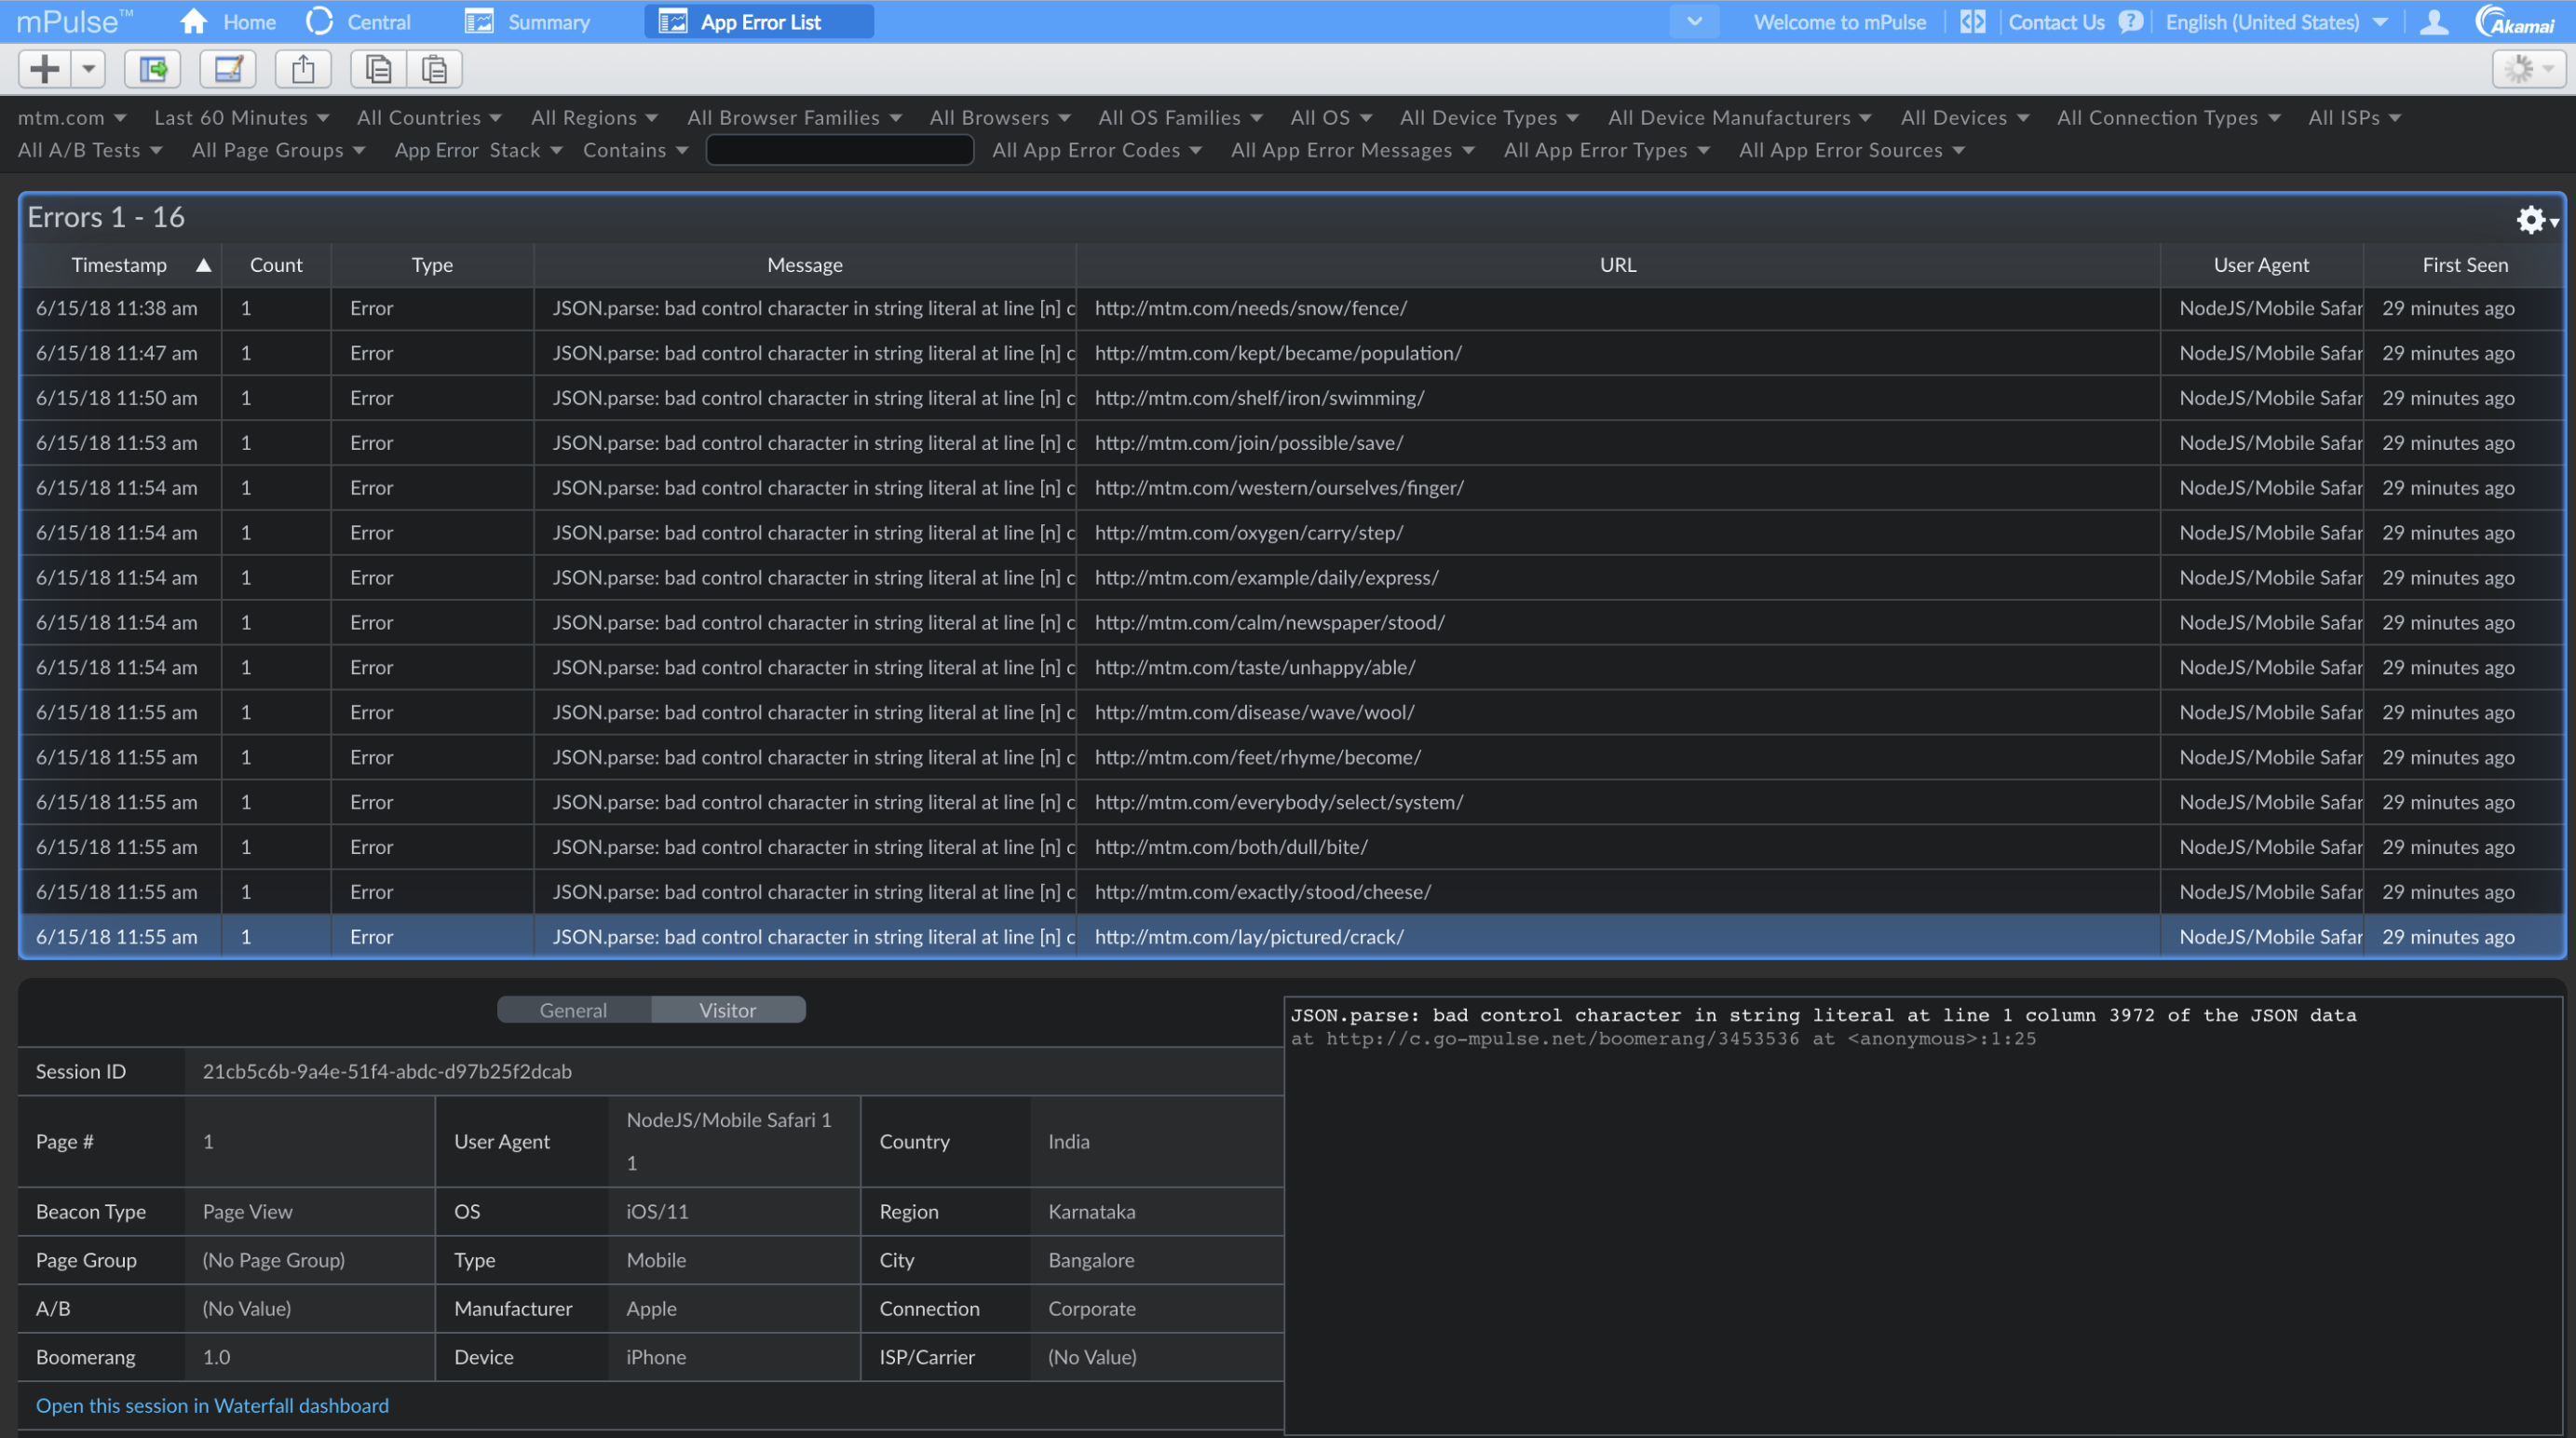
onloadand when event handlers aren’t reliable). If the main beacon doesn’t come in, the early beacon data is used. - error beacons contain information about any JavaScript errors that occur during user interactions after the main beacon was sent.
- spa beacons for Single Page App Soft Navigations.
- (… and a few more obscure ones)
fetchLater() can help us get data more reliably in a few of these scenarios!
- early beacons may no longer be necessary: we can queue up a
fetchLater()with the same data, and abort it if we reachonloadand send our regular data. This will reduce the amount of beacons we send (and that we have to keep in memory in our infrastructure). - error beacons could be sent less often: right now our customers often choose to send batches of error beacons every 1 to 5 seconds, to ensure they arrive reliably. We could batch new errors into a
fetchLater()beacon that only get sent after 60 seconds, trusting the browser to deliver it (and appending new errors if they occur in the meantime). - It would take a bit of engineering to make such a drastic change to our library, but
fetchLater()could allow us to combine our load and unload beacons into a single beacon that just gets sent as the page is unloading. (the downside of this is that data may not be as "real time" into our dashboards as it is today, which shows beacons withing 5-10 seconds of the Page Load happening).
We’re hoping to experiment with some of these ideas soon!
TL;DR- Last time I experimented with Pending Beacon, I had concerns with ergonomics (lack of Developer Tools Support) and reliability (less beacons arriving than
sendBeacon()). Both of these are resolved! - I’m really excited for the
fetchLater()API. It’s giving developers better ergonomics for sending data, and a more reliable way to send beacons at the end of the page lifetime. - The new
fetchLater()API is in active development and going through a feedback and Origin Trial cycle. - I would suggest analytics libraries seriously consider utilizing the API if available (after the Origin Trial concludes).
Thanks for reading and your support! Please contact me with any feedback, questions, etc.
The post Beaconing In Practice: fetchLater() first appeared on NicJ.net.