There are 3,142 counties in the United States of America.
County Name Frequencies
The most popular names for counties are past US presidents and founding fathers. 31 states have a “Washington” county, 26 states have a “Jefferson” county, and 24 four states have Franklin, Jackson, and Lincoln counties. Here is the full list:
The largest counties are in Alaska. The largest county in the continental US is San Bernadino county in California. The smallest county is Falls Church county in Virginia, just east of Washington DC.
Some counties are named for the largest city within them. Here’s a map of the largest cities in the USA. Green circles indicate that the county shares its name with the city. Zoom in to see the details:
Joplin is note-taking software that I appreciate and use a lot.
I use it to take all kinds of notes at home and work.
I have one specific workflow where I copy/paste some lines of text into a
Joplin note, and I need to make all the lines (that are not headers) into bulleted lines.
The default bullet tool doesn’t work because it makes anything that is highlighted into bullets.
So I created a custom Joplin plugin called “Joplin Bulletify”.
It’s a very simple plugin - it adds a button to the toolbar.
When that button is clicked, the plugin adds a bullet to any line that is not already a header.
That’s it.
If you’d like to use it, go to Joplin Options > Plugins and search for Bulletify.
Since this is a modern Joplin plugin, for the plugin to work you must also go into Joplin’s General Options and check on Opt-in to the Editor Beta. In the future once the new Editor becomes the default this extra step will not be required.
Just for fun, I thought it might be interesting to bring some of the ideas of the old game show Press your Luck
… over into an interactive web map:
There is no “whammy” in mine - it’s more of just a random item chooser.
From the homepage you can select which “type” of geography you want to use (world countries, USA states, etc.) or you use your own layer by passing in any URL to an ArcGIS Feature Service.
Just include your URL in the URL in this format:
One of the core ideas in mapping is the difference between vector and raster layers.
For vector layers, the actual geometry data is stored and passed around - for example a point might store the latitude and longitude.
For tiled raster layers, the data is stored as images on the server, and those images are displayed as the layer.
In the past, the visualization of tiled raster layers could not be filtered based on geometry.
Using layer blending in recent versions of the ArcGIS Maps SDK for JavaScript, this is now possible.
The documentation has a very flashy example of a use case for blending, but what I’m talking about here is a bit simpler: visually filtering the tiled layer based on a vector layer.
For example, filtering your layer based on currently selected states:
This might seem basic, and for vector layers it is - we could do this kind of visual filtering for many years.
But for tiled layers this is new.
You can get creative with this functionality. Like what if you allow the user to draw on the map to “cut out” their imagery visually:
Or what if we hook this functionality up to a mouse hover:
Filtering tiled layers opens up more options for maps and geoviz web applications.
Give it a try next time you need to do some map filtering.
Web Mercator is the standard for online interactive maps.
It has been the standard since Google Maps first used it in 2005.
In the ArcGIS Maps SDK for JavaScript, Web Mercator basemaps are built-in and can be referenced by name.
The data for the built-in basemaps can be found in Basemap.js.
Here’s a JavaScript demo showing that raw data:
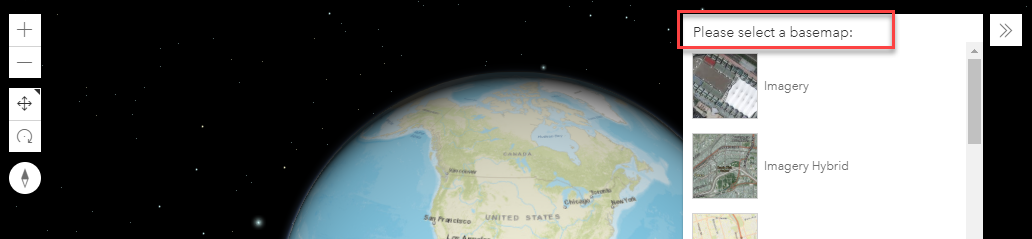
And here are those basemaps in a Basemap Gallery:
But what if we want to use the EPSG 4326 spatial reference, using latitude/longitude.
Basemaps in that spatial reference are not built-in to the SDK.
We’ll first need some basemaps in that spatial reference.
Esri maintains an ArcGIS Online group that contains EPSG 4326 (WGS 84) vector tile basemaps.
To create a Basemap instance in the SDK, all we need is the Web Map item ID.
So we’ll query the group, get the IDs, build the Basemap instances, and pass the array of Basemaps to the Basemap Gallery:
Can you see the difference between the two spatial references?
In EPSG 4326, the United States looks wider than when using Web Mercator.
Here’s an easier way to compare - swapping between the two:
With great power comes great responsibility!
Now that you know how to do it, should you?
Probably not.
Web Mercator is standard for interactive web mapping applications for many reasons.
It is not that great either, but it’s the best we have for the web.
Are you using EPSG 4326 (WGS 84) in your web apps? I’d love to hear about where you’ve found use for this pattern.
When collaborating on code with others using Git, keeping the overall list of code changes (the “diff”) in a pull request as small as possible - not including lots of unnecessary changes like quotes and tabbing - is an important and considerate thing to do.
Why lots of unrelated changes suck
A pull request (aka merge request) represents a request to merge a branch that has multiple outstanding commits, with each of those commits representing a variety of lines of code changes. These code changes are shown on the pull request summary and is one of the main things someone who reviews the pull request reviews.
For those reviewers, it takes time and mental energy to understand what code change you’re proposing: what it intends to do, what it actually does, and if there are any obvious bugs.
When you have many un-related changed lines in the diff, that forces the reviewer to also analyze which lines are “actual” changed lines and which are unnecessary and can be ignored.
A diff that’s hard to see what are the significant changes
It discourages (good) reviews
The review process is already difficult enough.
In many situations the reviewer is taking time out of his/her busy schedule to change contexts and review your code.
Switching gears to a new project and then fully understanding the changes to the code takes a lot of effort, and adding any additional challenge to this process makes it that much harder.
If a reviewer sees a large PR with a bunch of unnecessary code changes, it may influence him or her to just skip the review or perform a “low value review.”
Avoid it
So, create change requests that contain only the minimum necessary code changes to fix the bug or add the feature that your pull request is trying to do.
Any additional lines are detrimental to the software creation process.
You can do a lot with rasters and imagery in ArcGIS Pro, the most basic of which is adding an image to a map.
When adding an image to a map, if it does not have geographical metadata within the file, the image will be placed at (0, 0) - Null Island.
To place the image at the correct location, you must tell ArcGIS Pro where on the map to place it. This is called Georeferencing.
The way to georeference an image is to create “Control points,” which match the points on the image to points on the map.
If you do this at least 3 or 4 times, ArcGIS Pro can interpolate the rest of the image and get it to where it needs to go.
What if you have an image and you know its extent (that is, the coordinates of each of its sides - xmin, xmax, ymin, ymax)?
You should not need to create control points - you should be able to tell ArcGIS Pro “stretch this image between these 4 corners (the extent values)” and that’s all - no manual control points needed.
The solution is to create a world file.
The world file is a six-line plain text file that is designed for this purpose — to georeference an image.
This is the template to convert the extent values to a world file:
The convention is to name the world file the same file extension but with a “w” appended. So if you have a PNG, create a file with the same name as the image, but file extension “.pngw” instead of “.png”. Save this in the same directory as the image, then re-add the image to a map in ArcGIS Pro. Your image will be placed in the exactly correct spot!
In the ArcGIS Maps SDK for JavaScript, the popup widget displays the attributes for individual features on the map.
It appears when the user clicks on a feature on the map.
In certain cases, you may want the user to be able to move the popup by dragging the mouse cursor. But there’s no way to enable that in the API!
Allowing the user to move the popup is not common and probably not best practice in most cases.
The popup displays attributes about a feature, and the alignment of the popup near the feature tells the user the which feature’s attributes the popup is showing.
You might want to allow the user to move the popup because it “gets in the way”. This is usually not actually a problem because:
It’s quite easy to close the popup by clicking on the close button or clicking anywhere on the map, and
There’s the “docking” option which places the popup in one of the corners of the map.
If your use case overrides all of those considerations and you do want to allow dragging, here is a sample using the Interact.js JavaScript library.
Since the popup DOM node is created each time the popup opens, it sets up and destroys the Interact.js listeners when the popup opens and closes using the watch functionality of the ArcGIS Maps SDK for JavaScript.
Other than that, the code is straightforward Interact.js.
Click here for the full code and interactive sample:
When querying an ArcGIS Feature Service, there is typically a maximum number of features (records) that will be returned from any query – usually set to 1000. If you want to query for all the features in the service, ArcGIS REST JS does not currently do this (see this discussion) - you’ll need to make multiple REST calls to get them all. Use the package query-all-features to do this.
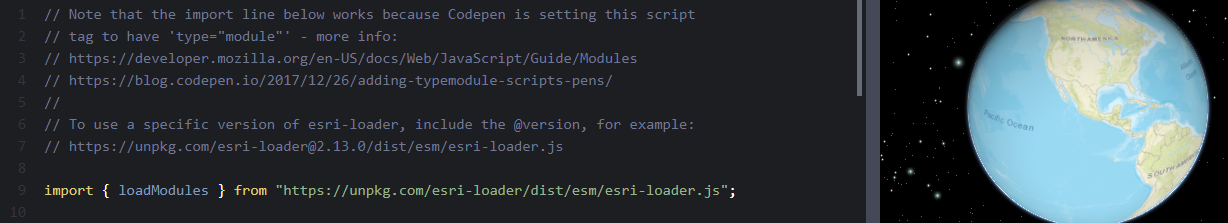
When adding functionality to a web page using JavaScript, you may rely on external libraries (like a mapping library) to provide that functionality so you do not need to write it yourself. There are many ways to use, or import, these libraries into the page. A new method is to use ES Modules to import third-party JavaScript libraries into your application from a URL. Using this method is easier because downloading or installing via NPM is not necessary.
For mapping applications with the ArcGIS Maps SDK for JavaScript, I’ve found that using this “ES Modules via CDN URL” pattern is great for quick samples or debugging. This pattern should not be used for production code - see notes in the documentation here.
To use this pattern, the key is to add type="module" to your <script> tag. For the ArcGIS Maps SDK for JavaScript, the URL pattern is to take whatever import string is shown in the API documentation (for example, @arcgis/core/views/MapView), and:
prependhttps://js.arcgis.com/X.XX/ (where X.XX is the version number, like 4.22), and
append.js to the end.
So if you want a plain HTML and JavaScript file solution, it would look like this:
<script type="module">
 import MapView from 'https://js.arcgis.com/4.22/@arcgis/core/views/MapView.js';
When using code-sharing websites like CodePen, you do not have control over the <script> tag, so you might think using this pattern will not work. Luckily, these websites have embraced ES Modules and have a solution.
CodePen
CodePen will automatically add the type="module" tag to your <script> tag if it detects that you’re using ES Modules. Details on that here.
For libraries like Leaflet or Esri Leaflet where ES Module builds are not provided (yet), you can use the Skypack CDN like this:
import * as L from "https://cdn.skypack.dev/leaflet@1.7.1";
import * as esriLeaflet from "https://cdn.skypack.dev/esri-leaflet@3";
import * as esriLeafletVector from "https://cdn.skypack.dev/esri-leaflet-vector@3";
Happy new year! It’s a great time to complete those yearly things that are easily forgotten during the rest of the year: backups, privcy opt-outs, and software updates.
Backups
If you don’t already have a daily backup system for your regularly-used files, set that up! Backblaze or SpiderOak are great options. If you already have this set up, now is a great time to make sure it’s working properly and that you could access your files if your computer died.
If the service that hosts your email or contacts goes down, how would you access that data? You couldn’t! So next, focus on data that is not stored on your computer. The list of places you should back up will be unique for each person, but here are some common places:
GMail, Google Contacts, YouTube, etc. - you can download your data from any Google service pretty easily from Google Takeout.
First go through sites like Simple Opt Out to update your privacy preferences for websites and services you use. If you use credit cards, don’t miss those opt-outs (Visa/Mastercard)
Next, on your mobile phone, review app settings and disable any access (for example, location access) that an app does not reasonably need. (on iPhone: Settings > Privacy)
Finally, if you don’t yet use the uBlock Origin browser extension, install it. If you already have it installed, make sure it’s getting updated with the latest blocking lists (also do this for any similar blocking system like Pi Hole or DNS blocks).
Make sure your Operating system (like Windows) has all security updates installed. Check your home router firmware and make sure you’re on the latest version. Bonus points if you check other IoT devices like cameras, etc.
Support what you use and enjoy. This is true in all aspects of life, including software. Especially open source software.
Here are a few simple ways to do that.
1. “Star” the project on GitHub (FREE)
Giving a project a “star” tells the developer that you appreciate their effort. It costs you nothing, but is quite encouraging to the developer when it appears in the feed.
This encouragement is important because open source projects generally do not get any feedback when the software works well – the developer only hears about problems and bugs.
2. Send a personal thank you message (FREE)
Find the developer’s email address via GitHub or their personal website, and send a quick note of thanks and appreciation. It need not be long or complex. Taking a small amount of time out of your day to do this is very meaningful and really encourages the developer.
This can be done using social media, but I encourage doing it via email because it’s more personal and feels more direct. If you’re big into social media, do via social media and email!
3. Send money
If you have the means, taking a small portion of your donation budget each year to send it to software developers who work on the software you enjoy is a great way of saying thanks. Sending a donation is easier than ever.
If the software has an Info or About page, it might mention ways to donate there.
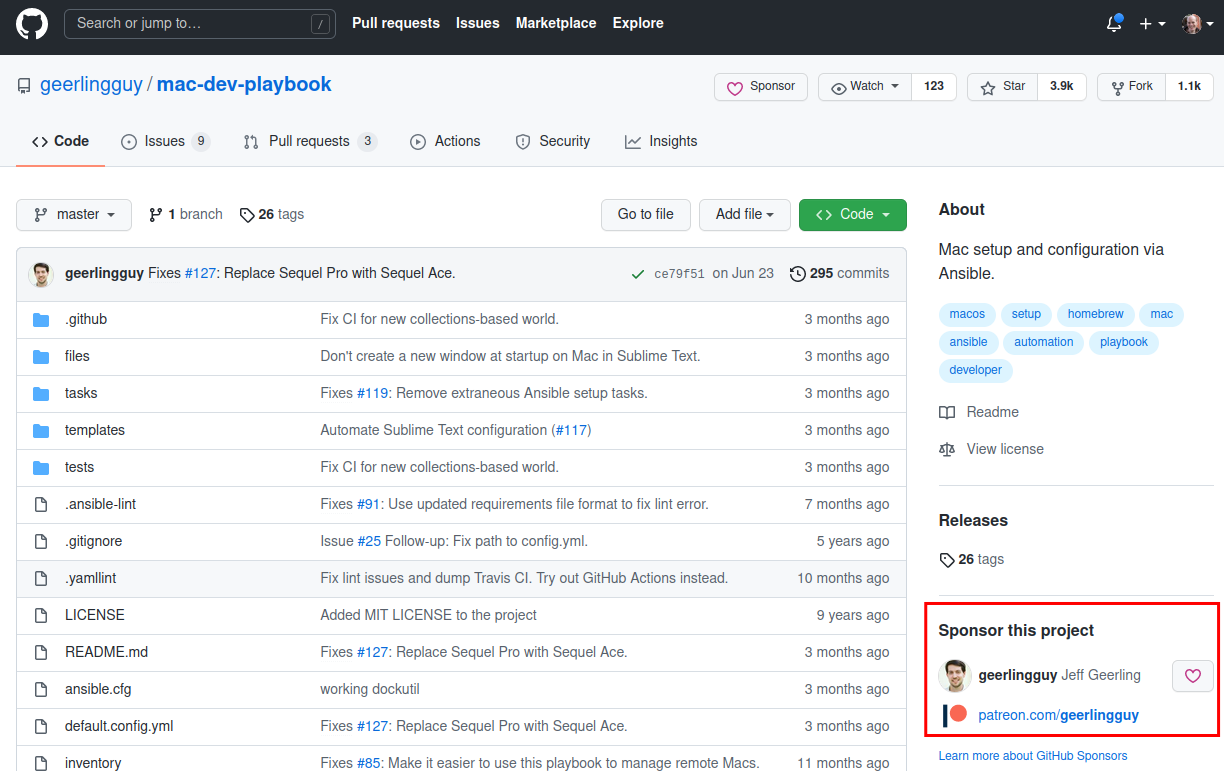
If the project has a GitHub page, check the “Sponsor this project” section.
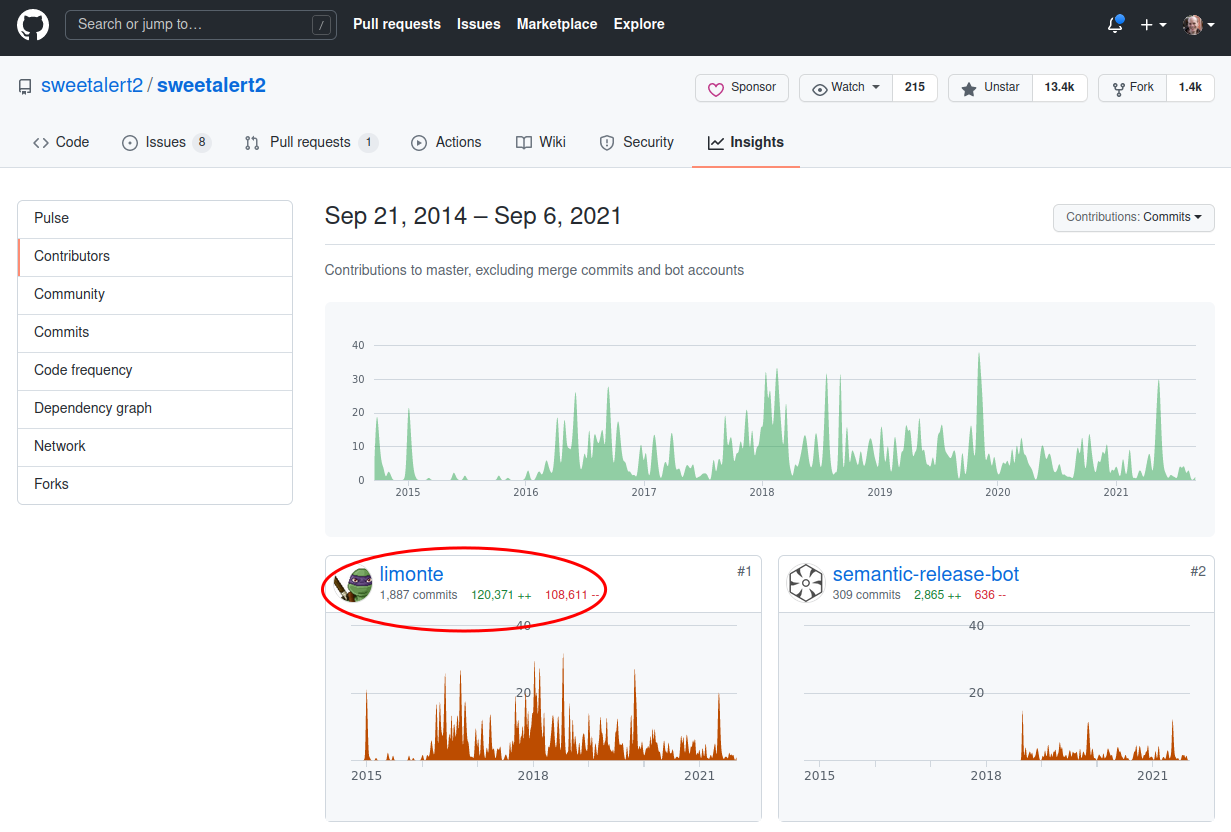
Find a contributor by going to the GitHub repository “Insights > Contributors” page and see if they have a GitHub Sponsors or other sponsorship link on their user page.
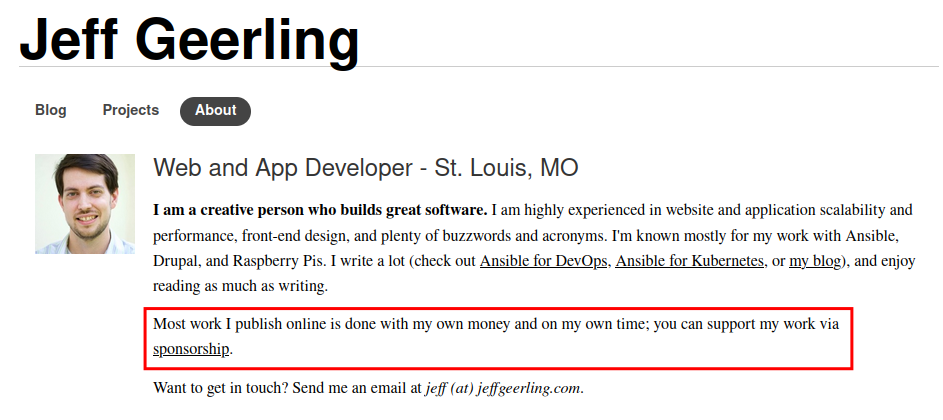
Find their personal homepage to see if they accept donations via an alternative method.
If none of these steps led you to a donation page, go back to option two above, and ask if they have a way to donate directly.
If you develop with ArcGIS Experience Builder, you know that getting started is a multi-step process. It would be nice to get started a little more quickly.
Here’s a simple Windows batch script that will do that. It installs the dependencies, if necessary, and then starts up the Experience Builder server.
Download the Experience Builder developer edition zip file.
Extract the Zip files. I use 7-zip and just use the “Extract here” button - this will create a folder called ArcGISExperienceBuilder at the same level as the zip file.
Create a file called LaunchExB.cmd.
Right-click the file and click Edit. Copy/paste the code above.
Double-click the file.
Note: make sure the .cmd file you create is that the same level (siblings) as the ArcGISExperienceBuilder folder.
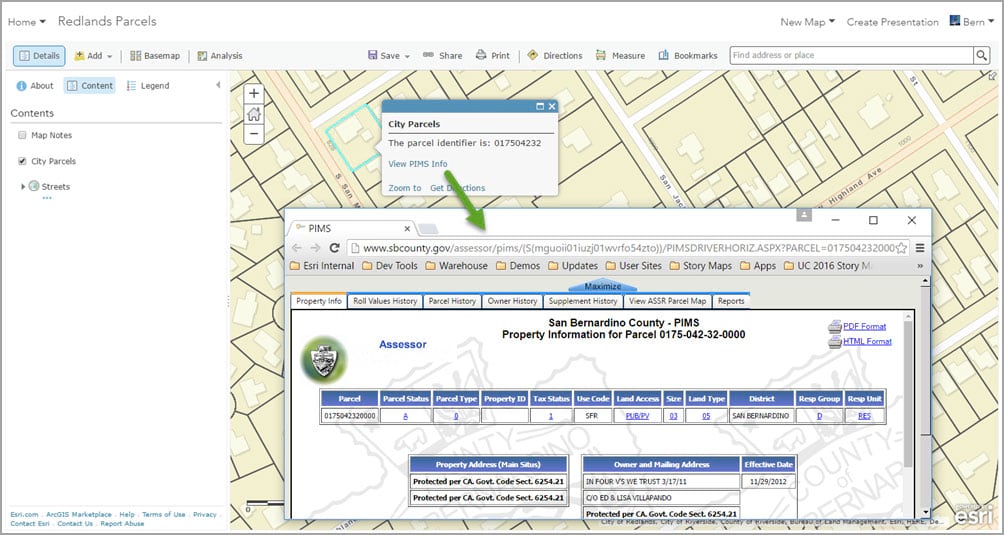
When adding a link to a popup in a map, using attribute-based URL parameters is a powerful ability. Bern Szukalski explains how to do this in this blog post.
He shows how to take the numeric ID from the a clicked feature (property parcel, in this case) and create a link with the ID so when the user clicks it will open the web page for that specific property ID.
What if you don’t have IDs and a specific URL pattern, but instead want to pass the name of your feature to enable the user to find some more information about it? You can use the same technique, using websites (like Google or Wikipedia) that take string searches as input.
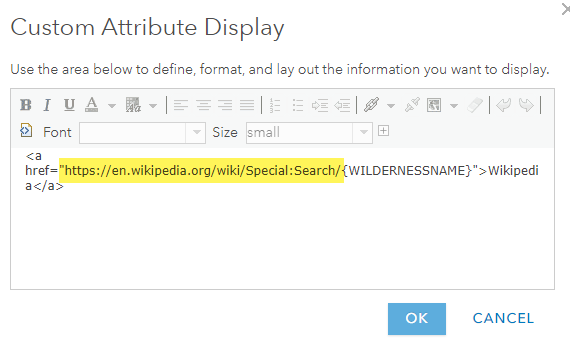
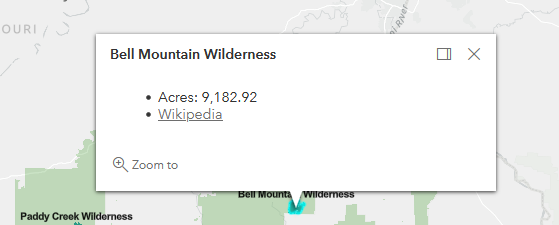
For example, you may have the names of US Forest Service Wilderness Areas as an attribute, and you want to have a link to each wilderness area’s Wikipedia Page. Follow the instructions in Bern’s blog post, and create a link tag (<a href="...) where the beginning of the URL is https://en.wikipedia.org/wiki/Special:Search/ then insert the dynamic value of the “name” attribute column of your features (for example, {my_name_field}). So it will look something like this:
This will create a clickable Wikipedia link in the popup that will open the proper page for each item.
When my friend Jake wakes up in the morning he immediately grabs his iPhone and checks Facebook. How common is that? Do you do it? Is waking up and checking Facebook healthy?
What is the ideal relationship between humans and technology? We are still figuring that out, but some things are clear:
Social media is the “junk food” of the internet.
We must take steps to ensure the security of our data and our online privacy.
The internet makes large-scale scams easier than ever before.
These are not widely known. Jake and his phone, social media addiction, and people getting fooled by internet scams are just some examples that show that a majority of Americans do not understand some of the basic tenets of a healthy digital life.
Health Class
Most US high schools require health class for graduation (some history). It teaches:
Systems of the body
Nutrition and fitness
Safe use or avoidance of alcohol, tobacco, and drugs
Reproductive health
CPR and first aid
These are core, foundational topics that any future adult must know. In a society where everyone uses smartphones and is always on the internet, are technology health topics not equally important?
DigitalHealth Class
I propose creating a new course, offered in parallel with the traditional health class. DigitalHealth Class wil teach basic skills and knowledge needed in a digital world. Basic modules would cover:
Security
Basic tenets of online security (like how HTTPS/SSL works)
Passwords and password managers
Common scams (phishing, etc) and how to avoid them
Build your own website with HTML, CSS, and JavaScript
Basic scripting (python)
Data formats (txt, markdown, XML, RSS, etc)
Since this is a new curriculum, most adults (especially those currently aged 50+) haven’t learned these valuable skills and lessons. So in addition to teaching this in high schools, this course could also be taught to a wider audience through libraries, senior centers, or even online.
My friend Jake has recently started exercising regularly and is looking physically great and healthy. After taking DigitalHealth Class, hopefully he’ll start making equally healthy choices in his digital life.
Finding the latitude and longitude coordinates of a particular location is not as easy as it should be. You can get it from Google Maps, but it requires 3 or 4 clicks. There are also a bunch of sites devoted to the task - most with ads and invasive spyware slowing down the page.
We need something better - that’s why I created Latitude Longitude Locate. Latitude Longitude Locate is a simple mapping app designed for geo developers. Click on a location where you want to get the coordinates, and click the “copy” icon. Those coordinates are now on your clipboard - two clicks.
There are also a few more features, like the ability to swap the order of latitude/longitude.
It’s meant to be simple and quick. I hope it helps you out. Let me know if you have any ideas or suggestions to make it even better.
When you’re querying a Feature Service in the ArcGIS Maps SDK for JavaScript, there’s typically a maximum number of features (records) that will be returned from any query – usually set to 1000. If you want to get all the features in the service, you’ll need to make multiple queries to the service. The best way to do this is with a recursive function that checks if the exceededTransferLimit property is true, and if so will continue making additional queries until complete.
One way to write that recursive function is like this
 const _getAllFeaturesRecursive = (layer, featuresSoFar) => {

 return layer
 .queryFeatures({
 start: featuresSoFar.length,
 num: layer.capabilities.query.maxRecordCount,
 outFields: ['*']
 })
 .then((results) => {
 // If "exceededTransferLimit" is true, then make another request (call
 // this same function) with a new "start" position. If not, return
 // with the concatenated results.
 if (
 results.exceededTransferLimit &&
 results.exceededTransferLimit === true
 ) {
 return _getAllFeaturesRecursive(layer, [
 ...featuresSoFar,
 ...results.features
 ]);
 } else {
 return Promise.resolve([...featuresSoFar, ...results.features]);
 }
 });
 };
Wrapping that code in a function to kick it off and running it yields this example:
Update 2022: I’ve wrapped this logic up into a small package that you can use in your own project, called Query All Features. Please try it out and let me know how it works for you: npm install query-all-features.
Here are some of my favorite code samples I’ve collected on my CodePen account over the past few years.
Centered Modal Geolocation Search
This CodePen shows a modal with the Search widget to allow a user to type in their location. When they search, the modal is hidden.
Live-Updating Protobuf Data on the Map
This CodePen gets current bus locations from a Protocol Buffer feed and shows them on the map using a client-side Feature Layer. I wrote more about this technique on a blog post.
3D Smooth Animated Zooming
This CodePen demonstrates the speed and easing options when moving between locations in the map.
When the mouse is hovering over a feature, this CodePen shows the Popup - debounced so that it only shows up when the mouse pauses.
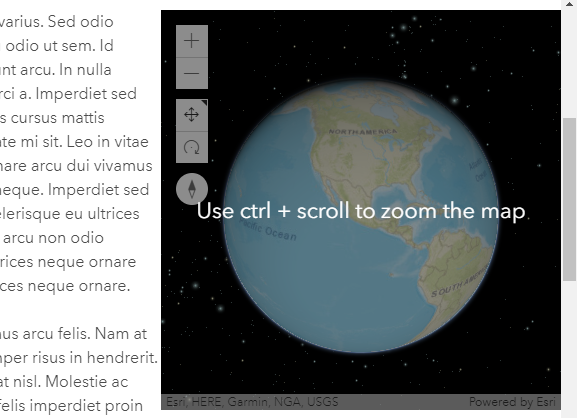
“Hold Ctrl to Zoom” When Scrolling Past the Map
Similar to Google Maps, in this CodePen if the user is scrolling past the map on the page it will not zoom, but will also show a message telling the user they can “Use Ctrl + scroll to zoom the map.”
Random Initial Location
This CodePen uses the JavaScript random function to calculate a random initial location for the map each time it loads.
Random Graphics
Using some similar logic from above, this CodePen allows the user to place a bunch of random point locations on the map every time a button is clicked.
Load the ArcGIS Maps SDK for JavaScript with Import (ES Modules)
This CodePenautomatically detects if you are loading an ESM (ES Modules) file on the page, so you can use Esri Loader’s ESM build to load a map into the page - no script tags required!
Add a Feature Layer via URL
This CodePen adds a simple form element where the user can copy/paste their own Feature Layer url and see it on the map.
Custom Widget Management
This CodePen shows how to use the “Container” property of ArcGIS Maps SDK for JavaScript widgets to place them into the DOM in a specific place.
Add a Header to the Expand Widget
This CodePen adds a header to the Expand Widget, which might be useful for situations in which you want to add instructions of explanatory text in the Expand widget.
Animate Go To Extent
This CodePen has a button to animate the zoom into a location on the map. It’s pretty simple, just call view.goTo(extent);