pprof
golang.orgPackage pprof writes runtime profiling data in the format expected by the pprof visualization tool.
GitHub - DataDog/go-profiler-notes: felixge's notes on the various go profiling methods that are available.
felixge's notes on the various go profiling methods that are available. - DataDog/go-profiler-notes
Heap optimization means speed optimization
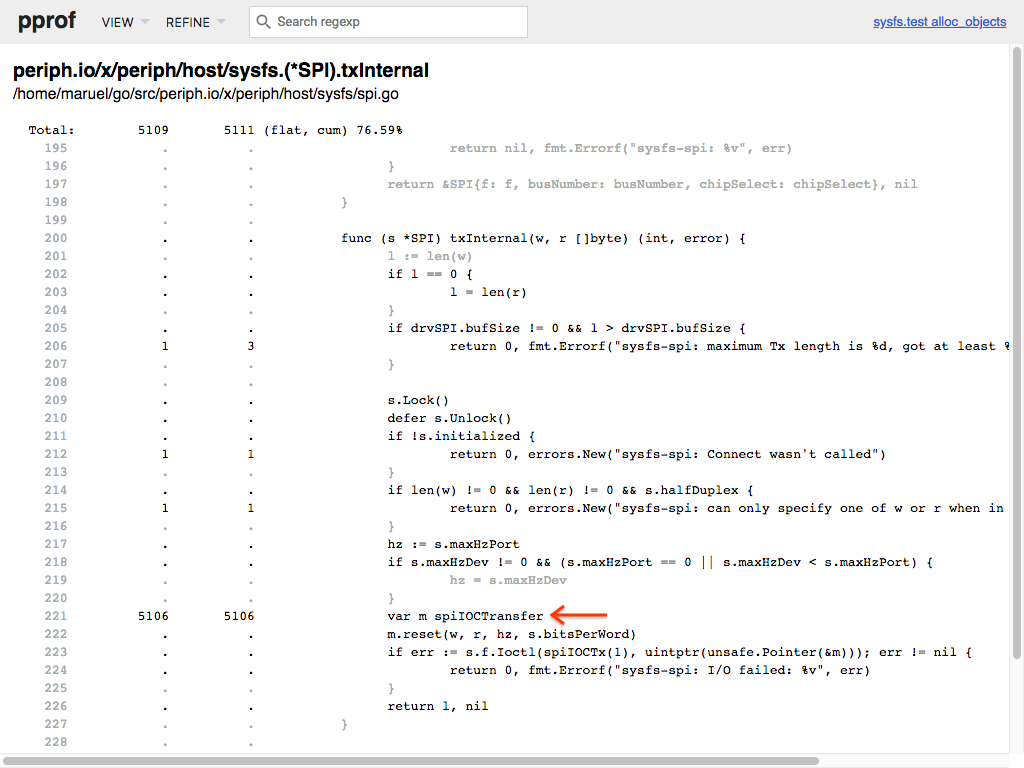
Find heap allocations and nail them down to save 0.67µs (37%) on a Raspberry Pi 3 in an inner loop

Profiling to Reduce Memory Allocations
Using pprof and go tool trace to find and fix a 100x memory allocation issue caused by compression middleware.
Creating custom Go profiles with pprof
Go’s pprof package is frequently used for heap and CPU profiles, but a little used feature of the package is being able to create custom profiles.
Profiling Go programs with pprof
Profiling Go programs with pprof