I do a lot of photo editing nowadays, mostly for my travel blog over at One Man, One Map. I’ve always had the impression that the PNG export in darktable might be slower than it has to be, but it had become a real issue since I've upgraded my desktop PC to a six-core Ryzen 7 1600X CPU and an NVIDIA GTX 950 GPU.
I spend most of my time digging through software-in-execution rather than software-at-rest (e.g. source code). Sometimes the subject of study is malware hissing like a snake and lashing out at the …
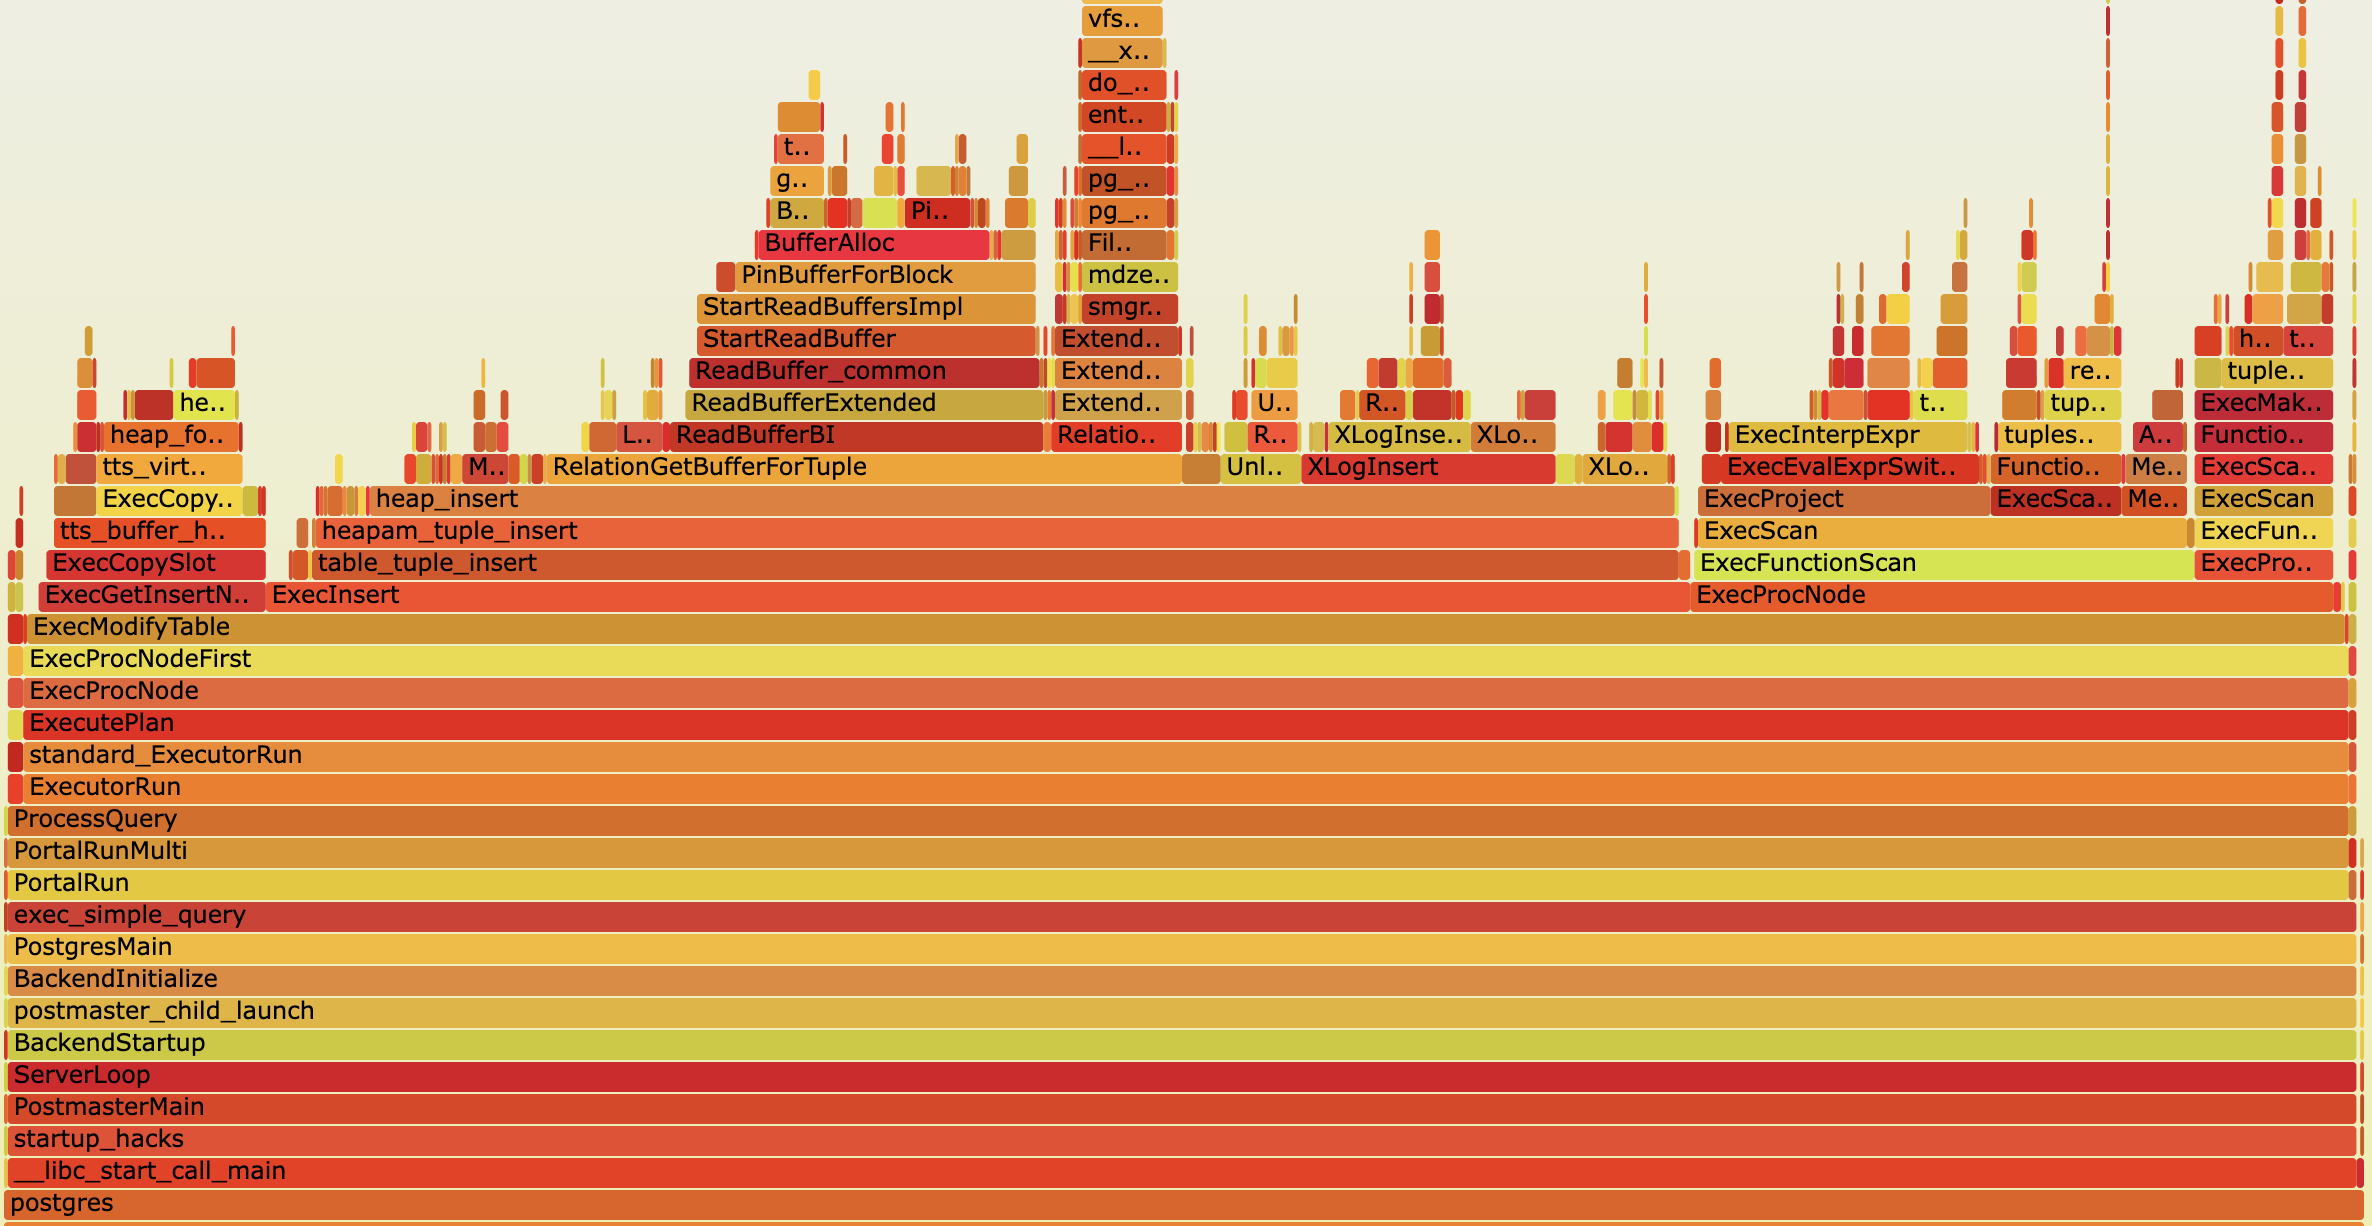
A flame graph is a graphical representation that helps to quickly understand where a program spends most of its processing time. These graphs are based on sampled information collected by a profiler while the observed software is running. At regular intervals, the profiler captures and stores the current call stack. A flame graph is then generated from this data to provide a visual representation of the functions in which the software spends most of its processing time. This is useful for understanding the characteristics of a program and for improving its performance. This blog post explores the fundamentals of flame graphs and offers a few practical tips on utilizing them to identify and debug performance bottlenecks in PostgreSQL.