
Instrumenting a Ruby on Rails application on Heroku with Datadog
Step-by-step guide to deploy and instrument a Ruby on Rails application on Heroku with Datadog to collect metrics, logs, traces, and integration data.
Log runtime metrics is a labs feature that logs load and memory usage on a per-dyno basis to an app's log stream.
Step-by-step guide to deploy and instrument a Ruby on Rails application on Heroku with Datadog to collect metrics, logs, traces, and integration data.

Heroku makes hosting simple, but most developers overlook its advanced capabilities. After years of running apps on the platform, I’ve found several underrated features that speed up your workflow and make your apps more reliable. Here are seven you shouldn’t miss. 1. Preboot Preboot spins up new dynos and starts routing traffic to them before the old ones are terminated. The result is seamless, zero-downtime deployments. The tricky part is knowing when the cutover is complete, since the Heroku dashboard doesn’t show it. Use this command to confirm when the new dynos are live:

Datadog, the leading service for cloud-scale monitoring.

software, programming, computers, technology
How to create a Sumo Logic overview performance dashboard for a Rails App with Postgres and Sidekiq on Heroku
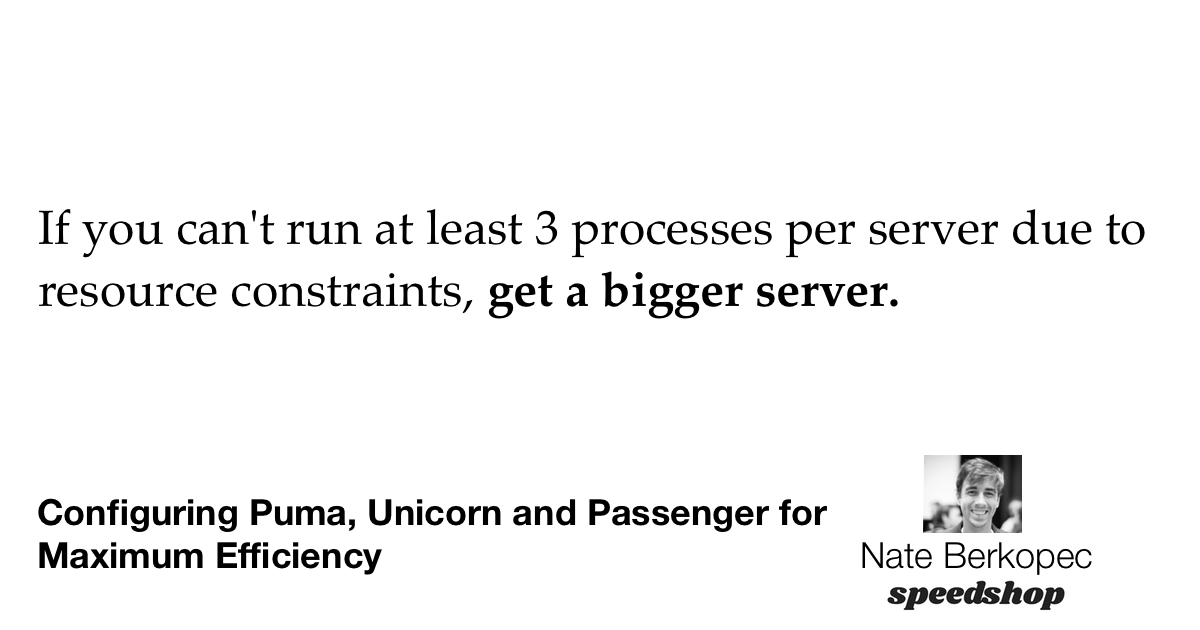
Application server configuration can make a major impact on the throughput and performance-per-dollar of your Ruby web application. Let's talk about the most...

Or why don’t free and top work in a Linux container? Lately at Heroku, we have been trying to find the best way to expose memory usage and limits inside Linux containers. It would be easy to …

For almost two years now, the Heroku Dashboard has provided a metrics page to display information about memory usage and CPU load for all of the dynos...