GeistHaus
log in · sign up

https://feeds.feedburner.com/RepeatableSystems

atom
10 posts
Polling state
Status active
Last polled May 19, 2026 02:20 UTC
Next poll May 20, 2026 04:57 UTC
Poll interval 86400s
Last-Modified Sun, 17 May 2026 11:21:49 GMT

Posts

A Mermaid Planning Tool for AI
articlesMermaidAIPlanning
Show full content

Header image

The practice of writing code has been changing fast. Really fast. I–and a large portion of the industry–write code in a completely different way from a year ago. And by that I mean that I largely manage a sophisticated coding machine that does the work. Writing code is now a process very similar to some of my previous experience as VP of Architecture at Community: I help co-design an architecture that will support the desired implementation, and then I help supervise the plan to do so. I review PRs, and suggest changes. I ensure docs and patterns are up to date. It’s a familiar role.

As I’ve become more adept at coding with AI, I’ve found that what worked well for teams of developers works well for AI. And, one of those things is that starting with a diagram-focused discussion is a lot easier. In person this often starts at a whiteboard. In remote teams it’s often some cobbled together combination of other tools. Some years ago now, thanks to Community.com being 100% remote, my brother Jeffrey Matthias introduced me to Mermaid and its implementation of sequence diagrams. I was (and remain) impressed by the simplicity of that diagram and how easily the most important interactions are made clear.

Leveling Up

Some months back, Tom Patterer and I started asking Claude Code to generate Mermaid diagrams for when exploring existing code, and when creating implementation plans. And, it turns out, as a fantastic tool in debugging.

This evolved into flipping the order around: on most projects we just start with the diagram. That diagram can codify an awful lot of thinking: it’s a really dense carrier of meaning. Once you have that, and if you have good rules in your AGENTS.md/CLAUDE.md file, you will get a very good plan, and likley a clean implementation. We learned to always include the diagram in the plan, so that it is not lost in the context of the planning session. When I get a plan from the agent, I usually clear the context and have it compare the plan to the diagram a second time to catch any errors or oversights. I rarely catch major issues in plans or implementation now.

Pain Point

But now you have another problem: collaborating on a diagram is somewhat painful. Certain IDEs enable collaboration on a file with auto-reloading, but that requires that you are editing in an IDE and it has the necessary plugins. The few of you reading this who know me may also know that I am a 35 year vi and vim user and not a fan of most IDEs. I co-wrote an O’Reilly book (with Sean Kane) in vim. I don’t want to use an IDE, neovim + Claude Code is enough. Furthermore in most of the IDEs I’ve seen, and in the mermaid.live tool, looking at an actual diagram of any size is not great. If you have this tooling and prefer it, great.

But, to suit my preferences, I decided to write a tool that would allow us to collaborate on a diagram in a way that is more natural to AI. And, which is more natural to programmers. It does include an editor, so that I can directly edit the diagram, but for the most part it’s the ability to push and pull diagrams from the agent that is the biggest win. It has both an MCP server and a CLI tool to interact with it, so take your pick. Both allow the agent to directly push updates, the CLI users fewer tokens. The tool supports going entirely full screen with the diagram, too.

Most of the rest of the Mozi team are now using it, and I am pretty sold on this workflow at the moment. It’s also fun how it harkens back to the way we all talked about designing software in the aughts, back when we thought we might largely generate code from diagrams, as Todd Sundsted pointed out to me awhile back. The code generator is just a lot more sophisticated these days.

The App

It’s a pretty simple app, but I tried to polish it up enough to make it nice to use. Other co-workers have now contributed to it as well. I’m a light-mode guy but co-workers are not all, so there is a dark mode. vim bindings are supported but not required.

On Linux and Windows, it’s a server and opens the browser to the diagram. On macOS, it’s a desktop app that opens the diagram. It can also open .mmd files in the event you want to review previous work.

If you are serious about improving your AI workflow, I encourage you to try it out. You can get it here.

Editor UI

Claude Code interaction

https://relistan.com/mermaid-tool-for-ai
Calling Go from Elixir with a CNode (in Crystal!)
articlesgogolangdevelopmenteventsevent-sourcingelixircrystal
Show full content

Header image

At Mozi, we needed to connect a new Elixir Phoenix LiveView app to an existing Go backend. This is how we did it.

Background

We have a backend built in Go, which is fully-evented along the lines of the patterns we used at Community, described in a previous post. In order to support all of that, we have some hefty internal libraries and existing patterns, and get a lot for free by building on top of them.

Previously the only frontend to our application was an iOS app and that app is also event-sourced and evented. And now Tom Patterer and I wanted to add a webapp to the mix, in order to support scenarios outside of the iOS app, either because they work better on the web, or so we can support Android and desktop browsers to limited extent (for now) as well. We chose Phoenix LiveView for the web frontend because it is a great fit for this kind of web app, the main backend developers at Mozi already know Elixir well, and the comparable Go live implementation is not as robust or complete.

However, we really didn’t want to have to rewrite/duplicate a lot of the code that handles events in our existing Go services, or maintain two different stacks. It would be great if the Elixir app could just call the Go code.

Solutions We Didn’t Use

I have actually done this before and it works: you can compile the Go code into a C ABI library and then call it from Elixir via NIFs (Native Implemented Functions). If you aren’t familiar with the BEAM ecosystem (Erlang VM on which Elixir runs), NIFs are foreign function interface glue that allows you to call C code from code running on the BEAM. There are some problems with this approach (not in order of importance):

  1. You have two runtimes with complex internal schedulers running in the same process, potentially competing with each other for resources.

  2. One of the great things about the BEAM is that it is super robust and with OTP applications (OTP is the framework built originally to run phone switches), you get a lot of fault tolerance built in. But now you have some C code in the BEAM and that has to be exactly right or your Elixir app will crash.

  3. Compiles and builds become a mess because your build for your Elixir app is either linked against the C (Go) library, or you create an Elixir lib that wraps the C library. In either case you end up with a painful build somewhere.

There are probably some other issues I haven’t mentioned. It’s not a great solution.

Ports are another option. They are a sub-process running on the other end of a pipe that you control from the BEAM process. This is a bit better because you have a separate process and there is not a worry about two schedulers in the same process. However, the overhead is higher and you are still not fully decoupled because the BEAM process has to manage the running port and sub-process. This was the most viable option other than the one we chose, which allows even more decoupling.

C Nodes to the Rescue

The option we actually chose was to implement what is called a “C Node” in the Erlang ecosystem. There is a library that ships with the Erlang distribution called erl_interface that allows you to implement a BEAM distribution node in C. What that means is that you can write C code that will talk to the Elixir/Erlang application over the native distribution protocol used to connect nodes together running the BEAM.

This is a great option because, while it does introduce more overhead than the NIFs, it allows you to fully decouple the codebases from each other at both compile and runtime. All you need to do is write a lightweight wrapper library in the Elixir side that makes it easy to call the remote node using native Elixir functions like send/2. And on the C side you use the library to decode the distribution messages and process them as needed, then call the library to return data back, or make other remote calls. If the nodes are connected, sending to the remote node feels just like making a normal function call from the Elixir side.

What we did was build the Go code as a C ABI library. We then wrote a small C wrapper that processes some CLI args and environment variables, and starts looping on the inbound messages. It calls the Go code as needed from the C code. In this setup, main() is in the C code and the Go code is initialized and called from there.

The way it works is that the C code starts up and calls to the Elixir app on a well-known local address. This then begins distribution with the BEAM running the Elixir app. You can tell on the Elixir side if the C node is connected by calling Node.list(:hidden). On the C side the call either succeeds or fails, so you can easily manage retries as needed. In our case, embracing the “let it crash” philosophy, the process exits cleanly, shutting down the Go code. Then it is restarted by S6 running inside the container. Because we use a well-known name for the C node, it’s easy to tell if it is connected or not.

Discovering the remote node is handled in application.ex like this:

# This is used when findin the events-sidecar node, overriden in tests
Application.put_env(:elmozi, :find_events_sidecar, fn ->
  node =
    Node.list(:hidden)
    |> Enum.filter(fn n -> String.contains?(Atom.to_string(n), "events_sidecar") end)
    |> hd

As the comment says, this then makes it easy to override the sidecar in tests, using a a mock or stub as needed. Note that we did not implement Node.ping/1 and this is not necessary.

A Short Interlude

Some small number (of the 5 of you who got this far) of you may now be asking… but why use C, there is a Go implementation of the BEAM distribution protocol? I had been watching this implementation, called Ergo, for awhile. I wrote some simple stuff using it. There was always a bit of an issue with making sure it supported the latest OTP version. In the past I steered away from it because we couldn’t realiably be sure that we would be able to upgrade Elixir and not suffer issues talking to Go. As of last fall, in a major departure, that project no longer supports the native distribution protocol. Instead, you must run a separate implementation on the BEAM side. And it’s now a commercial offering. Fair enough, the developer deserves to make some money, but I am glad we didn’t build anything serious on it.

Crystal Upgrade

Back to our C node. While I can write and maintain C code, I’m one of the few people here who can. So in order to improve the maintainability of the codebase, I decided to rewrite the C code in Crystal, a strongly typed language that looks and feels a lot like Ruby but is compiled to native machine code. This was not a major effort. It took some work to build the wrappers for the erl_interface library, but it wasn’t too bad. We did get this for free in C, but the Crystal wrappers are thin, and in the end the total line count (as a basic measure of complexity) of the Crystal code is still less than the C code. The result is a three language mash-up that actually feels pretty slick and fairly natural. It is certainly nicer to work on than the C code was.

To make life a little easier, we exposed some additional functions from Go to allow the Crystal code to log using our same Go logging setup and a few other basic infrastructure bits that we then don’t have to duplicate in Crystal. There is a performance penalty every time you cross the C/Go boundary, but for our use case, it’s not a big deal.

This is roughly what it looks like to work with the erl_interface library. Note that Elgo is the Crystal module wrapping the Go functions.

def handle_message(xbuf : Erlang::EiXBuff)
  # We predeclare these because we need to pass pointers to them to the Erlang code
  index = 0
  version = 0
  arity = 0
  pid = uninitialized Erlang::ErlPid
  atom_buf = StaticArray(UInt8, COMMAND_ATOM_MAX_SIZE).new(0)

  if Erlang.ei_decode_version(xbuf.buff, pointerof(index), pointerof(version)) != 0 ||
     Erlang.ei_decode_tuple_header(xbuf.buff, pointerof(index), pointerof(arity)) != 0 || arity != 2 ||
     Erlang.ei_decode_pid(xbuf.buff, pointerof(index), pointerof(pid)) != 0
    Elgo.elgo_log_error("Invalid message format".to_unsafe)
    return
  end

  if Erlang.ei_decode_tuple_header(xbuf.buff, pointerof(index), pointerof(arity)) != 0 || arity != 2
    Elgo.elgo_log_error("Failed to decode command tuple header".to_unsafe)
    return
  end

  if Erlang.ei_decode_atom(xbuf.buff, pointerof(index), atom_buf.to_unsafe) != 0
    Elgo.elgo_log_error("Failed to decode command".to_unsafe)
    return
  end

  command = String.new(atom_buf.to_slice)

  type = 0
  size = 0
  if Erlang.ei_get_type(xbuf.buff, pointerof(index), pointerof(type), pointerof(size)) != 0
    Elgo.elgo_log_error("Failed to get message type".to_unsafe)
    return
  end

  case type
  when ErlDefs::ERL_BINARY_EXT
    bin_buf = Bytes.new(size)
    bin_size = size.to_i64
    if Erlang.ei_decode_binary(xbuf.buff, pointerof(index), bin_buf, pointerof(bin_size)) == 0
      Elgo.elgo_log_info("Received binary message".to_unsafe)

      # Main switch for the functions we support
      case
      when command.starts_with?("allow_publish_event")
        # Call the Go code
        Elgo.elgo_add_allowed_publish_event(bin_buf)
      when command.starts_with?("notify_publish_ready")
        Elgo.elgo_notify_publish_ready(bin_buf)
      else
        Elgo.elgo_log_error("Unsupported command: #{command}".to_unsafe)
      end

    else
      Elgo.elgo_log_error("Failed to decode binary".to_unsafe)
    end
  else
    Elgo.elgo_log_error("Unsupported message type".to_unsafe)
  end
How It Works In Practice

It’s quite solid! We build and deploy the Crystal/Go code as a single Docker container, running in the same Kubernetes pod as the Elixir app. They are be independently built and are only coupled by the deploy-time configuration that specifies which version of each to deploy in the pod.

Because both Crystal and Go are able to build easily on both macOS and Linux, we can develop locally on macOS and build and deploy on Linux. It took a bit of fiddling to find the right distribution of Linux to build on with easy support for Crystal and that Go would run on properly.

The only hard part here was a temporary issue: in the end I had to build a custom build of the Go 1.24 compiler on Alpine Linux that has a patch to properly support MUSL libc when starting under Cgo. Shortly this won’t be ncessary as I did not write this patch myself, it was contributed to the Go project but has not yet shipped.

If there is enough interest, I will work to open source the Crystal wrapper we wrote to erl_interface so others can use it as well. Hit me up on Mastodon to let me know you are interested!

https://relistan.com/calling-go-from-elixir-with-a-cnode
Parsing Protobuf Definitions with Tree-sitter
articlesgogolangdevelopmentprotobuftreesitter
Show full content

Tree-sitter logo

If you work with Protocol Buffers (protobuf), you can really save time, boredom, and headache by parsing your definitions to build tools and generate code.

The usual tool for doing that is protoc. It supports plugins to generate output of various kinds: language bindings, documentation etc. But, if you want to do anything custom, you are faced with either using something limited like protoc-gen-gotemplate or writing your own plugin. protoc-gen-gotemplate works well, but you can’t build complex logic into the workflow. You are limited to what is possible in a simple Go template.

It’s also possible to use protoreflect from Go to process the compiled results at runtime. This is painful. Really painful.

So, at work, we had made limited use of the protobuf definitions other than for their main purpose and for documentation and package configuration via custom options (these are supported in protobuf). Writing the protoreflect code to make that work is not something I want to repeat.

Then I recently revamped my editor setup and moved from Vim to Neovim. In the process I realized how awesome the Tree-sitter parsing library is and that it probably was going to support extracting everything I wanted to get from our protobuf definitions. Neovim uses Tree-sitter extensively.

Why This Matters

Our evented and event-sourced backend at Mozi relies on protobuf for schema definitions and serialization of events. We use these same schemas everywhere from the frontend all the way to the backend. This means our whole system is working on the exact same entity definitions throughout. Good Stuff™.

In Go, the bindings are not really native structs and require a lot of GetXYZ() and GetValue() calls chained with nil checking to work around the fact that nil and zero values are encoded the same way in Protobuf. You also can’t use them in conjunction with anything that uses struct tags because you can’t apply tags. I am told by the mobile devs that the Swift bindings are similarly unfriendly.

We use a mapping layer to paper over this and to make these easier to work with in in our Go code, in data stores, and with off-the-shelf libraries.

We were maintaining custom mappings by hand. That’s a waste of time and even getting GPT to write the transformations back and forth is annoying, and invariably requires tweaking. So I wanted a solution that was much more automatic and repeatable.

Here’s what I did.

Example Definition

First we’ll have a look at one protobuf definition. Then we’ll talk about extracting the information we want from it.

Imagine that we’re working with the following fairly typical protobuf message definition. We want to be able to extract the name of the message, the enum names and values, and the fields and their types. Here we are not particularly interested in the field numbers, but you could also extract them, of course.

syntax = "proto3";
package entities;
import "google/protobuf/wrappers.proto";

// A BlogPost represents a single post on the blog.
message BlogPost {
  // Some custom configuration options
  // ...

  // Each blog post is assigned a type so we can identify how it will be used
  enum PostType {
    POST_TYPE_NOT_SET = 0;
    POST_TYPE_ARTICLE = 1;
    POST_TYPE_PAGE = 2;
    POST_TYPE_SPLASH = 3;
  }

  google.protobuf.StringValue post_id = 1; // The ID of the blog post
  PostType post_type = 2; // What kind of post is this?
  google.protobuf.StringValue title = 3; // The title of the post
  google.protobuf.StringValue body = 4; // The actual contents of the post
}

This typical message contains a single enum type and 4 fields. Real life messages will contain many more fields, but this is enough for us in this post. Looking at this, we could hack something to parse this fairly simple example using regexes or other string matching. But it would end up being pretty brittle. You could even break most trivial parsers by commenting out one or more lines of valid code with /* */ style. So let’s take a look at how we could get the data we need using a real parser: Tree-sitter.

Parsing and Querying the Document

Tree-sitter has numerous bindings that enable parsing programming languages and data formats and protobuf is supported. There are also good Go bindings for Tree-sitter that make it possible to interact with all of this in a straightforward way from Go code. We’ll use the github.com/smacker/go-tree-sitter package and the associated protobuf bindings.

The library supports various methods of access to the parsed tree, but the one we’ll use here is a query expression that will extract only the data we care about.

We can use an S expression to query the parsed tree. But, we need to understand what the parsed tree looks like before we can query it. How do we visualize what is in the AST? One way would be to use the online playground, but that lacks support for Protobuf. Because I was already working in Neovim, I decided to use the excellent built-in visualization and query tools!

Inside Neovim you can run :InspectTree on any open document where the bindings are included, and see a nice tree. Here is me running the inspector on the source code for this blog post. (See if you can spot the code error)

In :InspectTree, if I highlight things in the document, I see them reflected in the tree, and vice versa. This is invaluable for working with the queries, since we can identify what each element in the AST actually is in the document, live.

We can do the same thing for our Protobuf document. Then, it’s a matter of constructing a query to find and extract the parts of the document we want:

  1. Message Name
  2. Enum names, keys, and values
  3. Field names and types

Writing a query using the Neovim tools is also nice, and straightforward. From the :InspectTree panel, you can open the query editor by typing :EditQuery. This brings up another pane where we can type queries and see them reflected in the original document via highlighting and annotation.

This is what writing a query looks like in the Neovim query window:

When I put the cursor over the named capture @name in the query, it highlights any matched parts of the document. There are many ways to write the queries that we might use here. You essentially just walk through the tree in the viewer and mark the things you’d like to return as named captures.

The simplest query, shown in the screenshot, is to simply extract the message name:

(message_name (identifier)) @name

Here we found by inspecting the tree, that a message_name type is always followed by an identifier. If we capture the identifier as @name we can then refer to that capture when we want the message name. Then we can just build it up from there.

Here you can see me traversing a query that I built, and how the editor highlights the matches:

This is an example of a single query that will extract all of our required data from the protobuf definition:

(message_name (identifier)) @message_name
(enum_name (identifier)) @enum_name
(enum_field
	(identifier) @enum_key
	(int_lit (_) @enum_value)
)
(field (
(type (message_or_enum_type)) @field_type
	)
	(identifier) @field_name
)

Captures from the document will be returned by Tree-sitter in order. This is very helpful. We can then walk the results to generate a structure more easily reference in code. So let’s take a look at some Go code to interact with this document using the query we built.

Working with Tree-Sitter from Go

We need to import the two packages mentioned earlier. This is truncated for clarity: you will need other simple stdlib import.

import (
	sitter "github.com/smacker/go-tree-sitter"   // Tree-sitter bindings
	"github.com/smacker/go-tree-sitter/protobuf" // Protobuf definitions
)

We need some kind of data structure to store our parsed info in. The simplest starting point is something like this:

// A Message represents a single Protobuf message definition
type Message struct {
	Name   string
	Fields map[string]string
	Enums  map[string]map[string]int
}

You could, of course, use a more structured type if that suits your purpose better.

Then we need a function to read in the file and run it through the parser:

// ParseMessage parses the message file and returns a Message struct
func ParseMessage(filename string) (*Message, error) {
    content, err := os.ReadFile(filename)
    if err != nil {
        return nil, fmt.Errorf("failed to read file: %w", err)
    }

    // Create a new parser
    parser := sitter.NewParser()
    parser.SetLanguage(protobuf.GetLanguage())

    // Parse the content of the protobuf file
    tree, err := parser.ParseCtx(context.Background(), nil, content)
    if err != nil {
        return nil, fmt.Errorf("failed to parse protobuf: %w", err)
    }

    fields, enums, err := GetMessageFields(tree, content)
    if err != nil {
        return nil, err
    }

    msg := &Message{
        Name:   name,
        Fields: fields[name],
        Enums:  enums,
    }

    return msg, nil
}

You will note in the above that the majority of the hard work is being done by a function we have not seen yet: GetMessageFields(). That should look something like this:

// GetMessageFields runs the Treesitter query and returns the  two maps
func GetMessageFields(tree *sitter.Tree, content []byte) (map[string]map[string]string, map[string]map[string]int, error) {
    query := `
        (message_name (identifier)) @message_name
        (enum_name (identifier)) @enum_name
        (enum_field
            (identifier) @enum_key
            (int_lit (_) @enum_value)
        )
        (field (
        (type (message_or_enum_type)) @field_type
            )
            (identifier) @field_name
        )
  `

    q, qc, err := queryTree(tree, query)
    if err != nil {
        return nil, nil, err
    }

    fields := make(map[string]map[string]string)
    enumFields := make(map[string]map[string]int)

    var (
        fieldName, fieldType, messageName string
        enumName, enumKey, enumValue      string
    )

    // Iterate over the matches and print the field names and types
    for {
        match, ok := qc.NextMatch()
        if !ok {
            break
        }

        for _, capture := range match.Captures {
            node := capture.Node
            captureName := q.CaptureNameForId(capture.Index)
            switch  captureName {
            case "message_name":
                messageName = node.Content(content)
                fields[messageName] = make(map[string]string)
            case "field_name":
                fieldName = node.Content(content)
                fields[messageName][fieldName] = fieldType
            case "field_type":
                fieldType = node.Content(content)
            case "enum_name":
                enumName = node.Content(content)
                enumFields[enumName] = make(map[string]int)
            case "enum_key":
                enumKey = node.Content(content)
            case "enum_value":
                enumValue = node.Content(content)
                // Treesitter thinks zeroes are octal, let's work around it
                if strings.HasPrefix(enumValue, "0x") {
                    enumFields[enumName][enumKey] = 0
                } else {
                    enumFields[enumName][enumKey], err = strconv.Atoi(enumValue)
                    if err != nil {
                        return nil, nil, err
                    }
                }
      default:
        return nil, nil, fmt.Errorf("unexpected match type: %s", captureName)
            }
        }
    }

    return fields, enumFields, nil
}

Here we define the query, ask Tree-sitter to kick off the query, and then we loop over the matches, inspecting their name and then building up the maps.

The last piece of code to show is the queryTree() function that kicks off the query and cursor. It looks like this:

// queryTree runs a Treesitter query over a pre-existing tree
func queryTree(tree *sitter.Tree, query string) (*sitter.Query, *sitter.QueryCursor, error) {
    q, err := sitter.NewQuery([]byte(query), protobuf.GetLanguage())
    if err != nil {
        return nil, nil, fmt.Errorf("failed to run query: %w", err)
    }

    // Execute the query
    qc := sitter.NewQueryCursor()
    qc.Exec(q, tree.RootNode())

    return q, qc, nil
}

And that’s pretty much the meat of it. We can call ParseMessage() and we get back a Message{} struct that is populated with our message name, fields, and enums. In JSON representation, it would look something like this:

{
   "Enums": {
      "PostType": {
         "POST_TYPE_NOT_SET": 0,
         "POST_TYPE_ARTICLE": 1,
         "POST_TYPE_PAGE":    2,
         "POST_TYPE_SPLASH":  3
      }
   },
   "Fields": {
      "post_id":   "google.protobuf.StringValue",
      "post_type": "PostType",
      "title":     "google.protobuf.StringValue"
      "body":      "google.protobuf.StringValue",
   },
   "Name": "BlogPost"
}

And that’s it! It’s up to you what you do with this, but that gets you started. If you need to parse sub-types, you could design a query to do that. If you want to parse RPC definitions, you could do that, too. We use this information to generate out our bindings (which includes some logic).

Conclusion

This basis for tooling has been pretty good for us. I will undoubtedly bring Tree-sitter and the Neovim tooling to bear on other problems in the future. Hopefully this overview gets you a starting point.

https://relistan.com/parsing-protobuf-files-with-treesitter
Run Your Own Kubernetes Instance with Microk8s
articleskubernetesdevopsinfrastructure
Show full content

microk8s logo

This post covers how to get a personal Kubernetes (K8s) cluster running on an instance with a public IP address, with HTTPS support, on the cheap. I’m paying about €9/month to run mine and without VAT in the US you will pay less. This post is not how to build or run a large production system, but some of the things you learn here could apply.

We’ll get a cloud instance, install Kubernetes, set up ingress, get some https certs, and set the site up to serve traffic from a basic nginx installation. You need to know some basic stuff to make this work, things like Linux CLI, getting a domain name, and setting up a DNS record. Those are not covered.

Choices

Whenever you dive into something technical of any complexity, you need to make a series of choices. There are an almost infinite set of combinations you could choose for this setup. If you have strong feelings about using something else, you should do that! But in this post, I have made the following choices:

These are opinionated choices that will impact the rest of this narrative. However, there are two other choices you need to make that are up to you.

Selecting Hosting

To run Kubernetes where your services are available on the public Internet, you need to host it somewhere. If you want to run that at home on your own hardware, you could do that. Having had a long career maintaining things, I try to keep that to a minimum in my spare time. So I have chosen a cloud provider to host mine.

You will need to make sure you get a fixed public IP address if you want to serve traffic from your instance. Most clouds provide this, but some require add-ons (and more money).

From my own experience, I can strongly recommend Hetzner for this. They have a really good price plan for instances with a good bit of CPU, memory, and disk. I’ve chosen the CPX21 offering at the time of this writing.

This offering has the following characteristics:

  • 3 vCPUs
  • 4GB RAM
  • 80GB disk
  • 20TB traffic
  • IPv4 support (IPv6-only is cheaper)
  • Available in US, Germany, and Finland
  • €8.98/month with VAT included, less if you are in the US

In any case, you should select an hosting provider and make sure your instance is running the latest Long Term Support (LTS) Ubuntu Linux.

Selecting A Domain And DNS

Your Kubernetes host will need to be addressed by name. You should either use a domain you already own, or register one for this purpose. A sub-domain from an existing domain you own is also no problem. Once you have an instance up, you will want to get the IP address provided and set it up with your registrar. You could also consider fronting your instance with CloudFlare, in which case they will host your DNS. I will leave this as an exercise to the reader. There are lots of tutorials about how to do it.

Installing and Configuring Kubernetes

Kubernetes logo This is actually quite easy to do with microk8s. This is a very self-containd distro of Kubernetes that is managed by Canonical, the people who make Ubuntu Linux. So that means it’s pretty native on the platform. It supports pretty much anything you are going to want to do on Kubernetes right now.

On Ubuntu you can install microk8s with the snap package provider. This is normally available on the latest Ubuntu installs, but on Hetzner the distro is quite tiny so you will need to sudo apt-get install snapd. With that complete, installing microk8s is:

$ sudo snap install microk8s --classic

That will pick the latest version, which is what I recommend doing. You can test that this has worked by running:

$ microk8s kubectl get pods

That should complete successfully and return an empty pod list. Kubernetes is installed!

That being said, we need to add some more stuff to it. microk8s makes some of that quite easy. You should take the following and write it to a file named “microk8s-plugins” on your hosted instance:

#!/bin/sh

# These are the plugins you need to get a basic cluster up and running
DNS_SERVER=1.1.1.1
HOST_PUBLIC_IP="<put your IP here>"

microk8s disable ha-cluster --force
microk8s enable hostpath-storage
microk8s enable dns:"$DNS_SERVER"
microk8s enable cert-manager
microk8s enable rbac
microk8s enable metallb:"${HOST_PUBLIC_IP}-${HOST_PUBLIC_IP}"

Youd should put the public IP address of your host in the placeholder at the top of the script.

I have selected CloudFlare’s DNS here. This is used by services running in the cluster when they need name resolution. You could alternatively pick another DNS server you prefer. Another example would be Google’s 8.8.8.8 or 8.8.4.4.

Note that the disable ha-cluster is not required and it will limit your cluster to a single machine. However, it does free up memory on the instance and if you only plan to have one instance, it’s what I would do.

Now that you’ve written that to a file, make it executable and then run it.

$ chmod 755 microk8s-plugins && ./microk8s-plugins

It’s a good idea to keep this around so that if you re-install or upgrade later you have it around. You might also look around later to see which other add-ons you might want. For now this is good enough.

We’re setting up:

  • hostpath storage: allows us to provide persistent volumes to pods written to the actual disks of the system itself.

  • cluster wide DNS: configures the DNS server to use for lookups

  • cert manager: will support getting and managing certificates with Letsencrypt

  • rbac: support access control in the same way as most production systems

  • metallb: a basic on-host load balancer that allows us to expose services from the Kubernetes cluster to the public IP address. This is installed with a single public IP address.

kubectl Options

microk8s has kubectl already available. You used it earlier with microk8s kubectl. This in a totally valid way to use it. You might want to set up an alias like: alias kubectl="microk8s kubectl". Alternatively you can install kubectl with:

$ snap install kubectl --classic

Either is fine. If you like typing a lot, you don’t have to do either one!

Namespaces

From this point on we’ll just work in the default namespace to keep things simple. You should do this however you like. If you want to put things into their own namespace, you can apply a namespace to all of the kubectl commands.

cert-manager and contour have their own namespaces already and are setup to work that way.

Container Registry

JFrog Logo You need somewhere to put containers you are going to run on your cluster. If you already have that, just use what you have. If you are only going to run public projects, then you don’t need one. If you want to run anything from a private repository, you will need to sign up for one. Docker Hub allows a single public image. There are lots of other options. I selected JFrog because they allow up to 2GB of private images, regardless of how many you have.

If you are going to use a private registry, you need to give some credentials to the Kubernetes cluster to tell it how to pull from the registry. You will need to get these credentials from your provider.

A running Kubernetes it entirely configured via the API. Using kubectl we can post YAML files to it to affect configuration, or for simpler things, just providing them on the CLI. You need to give it registry creds by setting up a Kubernetes secret like this:

$ kubectl --namespace default  create secret docker-registry image-registry-credentials --docker-username="<your username here>" --docker-password="<your password here>" --docker-server=<your server>

For jfrog.io the server is <yourdomain>.jfrog.io. This should not contain a path.

You now have a secret called image-registry-credentials. You can verify this with kubectl get secrets, which should return a list with one secret.

Setting Up Ingress

When stuff is running inside a Kubernetes cluster, you can’t just contact it from outside. There are a lot of ways to do this, as with everything else in Kubernetes. For most, this is managed by an ingress controller. There are again many options here. I’ve chosen Contour because it’s widely used, easily supported, and runs on top of Envoy, which I think is a really good piece of software.

So let’s set up Contour. This is super easy! Do the following

$ kubectl apply -f https://projectcontour.io/quickstart/contour.yaml

That grabs a manifest from the Internet and runs it on your cluster. As with anything like this, caveat emptor. Check it over yourself if you want to be sure what you are running. Now that it is installed, you can run:

kubectl get pods -n projectcontour

Contour installs in its own namespace, hence the -n.

That should look something like this:

NAME                       READY   STATUS    RESTARTS        AGE
contour-6d4545ff84-kptk2   1/1     Running   1 (5d19h ago)   6d3h
contour-6d4545ff84-qbggg   1/1     Running   1 (5d19h ago)   6d3h
envoy-l5sqg                2/2     Running   2 (5d19h ago)   6d3h

Obviously yours will have been running for much less time.

That’s all we need to do here.

Storage

We installed the hostpath plugin so we can make persisntent volumes available to pods. But we don’t really have control over where it puts the directories that contain each volume. We can control that by creating a storageClass that specifies it, and then specifying that storage class when creating pods. This is how you might do that. If you don’t care, just skip this step and don’t specify the storage class later.

---
kind: StorageClass
apiVersion: storage.k8s.io/v1
metadata:
  name: ssd-hostpath
provisioner: microk8s.io/hostpath
reclaimPolicy: Delete
parameters:
  pvDir: /opt/k8s-storage
volumeBindingMode: WaitForFirstConsumer

This will create a storageClass called ssh-hostpath and all created volumes will live in /opt/k8s-storage. You can, of course, specify what you like here instead. You might look into the reclaimPolicy if you want to do something else as well.

Setting Up Certs

If you are going to expose stuff to the Internet you will probably want to use HTTPS, which means you will need to have certificates. We installed cert-manager earlier, but we need to set it up. We’ll use letsencrypt certs so that means we’ll need a way to respond to the ACME challenges used to authenticate our ownership of the website in question. There are a few ways to do this, including DNS records, but we’ll use the HTTP method. cert-manager will automatically start up an nginx instance and map the right ingress for this to work! There are just a few things we need to do. JFrog Logo

We’ll first use the staging environment for letsencrypt so that you don’t run off the rate limit for new certs while messing around.

You’ll want to install both of these, substituting your own email address for the placeholder:

---
apiVersion: cert-manager.io/v1
kind: ClusterIssuer
metadata:
  name: letsencrypt
spec:
  acme:
    # You must replace this email address with your own.
    # Let's Encrypt will use this to contact you about expiring
    # certificates, and issues related to your account.
    email: '<your email here>'
    server: https://acme-v02.api.letsencrypt.org/directory
    privateKeySecretRef:
      # Secret resource that will be used to store the account's private key.
      name: letsencrypt-account-key
    # Add a single challenge solver, HTTP01 using nginx
    solvers:
    - http01:
        ingress:
          class: contour

Write this to a file called letsecrypt.yaml and the run kubectl apply -f letsencrypt.yaml.

Do the same for this file, naming it letsencrypt-staging.yaml.

apiVersion: cert-manager.io/v1
kind: ClusterIssuer
metadata:
  name: letsencrypt-staging
  namespace: cert-manager
spec:
  acme:
    email: '<your email here>'
    privateKeySecretRef:
      name: letsencrypt-staging
    server: https://acme-staging-v02.api.letsencrypt.org/directory
    solvers:
    - http01:
        ingress:
          class: contour

At this point, we are finally ready to deploy something!

Deploying Nginx

To demonstrate how to deploy something and get certs, we’ll deploy an nginx service to serve files from a persistent volume mounted from the host. I won’t walk through this whole thing, it’s outside the scope of this post. But, you can read through the comments to understand what is happening.

Write the following into a file called nginx.yaml.

---
# We need a volume to be mounted on the ssd-hostpath we created earlier.
# You can add content here on the disk of the actual instance and it
# will be visible inside the pod.
apiVersion: v1
kind: PersistentVolumeClaim
metadata:
  name: nginx-static
spec:
  storageClassName: ssd-hostpath
  accessModes: [ReadWriteMany]
  # Configure the amount you want here. This is 1 gigabyte.
  resources: { requests: { storage: 1Gi } }
---
apiVersion: apps/v1
kind: Deployment
metadata:
  name: nginx
  labels:
    app: nginx
spec:
  replicas: 1
  selector:
    matchLabels:
      app: nginx
  template:
    metadata:
      labels:
        app: nginx
    spec:
      # This is not needed if you are using a public image like
      # nginx. It's here for reference for your own apps.
      imagePullSecrets:
      - name: image-registry-credentials
      containers:
      - name: nginx
        image: nginx:latest
        ports:
        - containerPort: 80
        volumeMounts:
        - mountPath: "/usr/share/nginx/html"
          name: nginx-static
      volumes:
      - name: nginx-static
        persistentVolumeClaim:
          claimName: nginx-static
---
apiVersion: v1
kind: Service
metadata:
  name: nginx
spec:
  selector:
    app: nginx
  ports:
  - protocol: TCP
    port: 80
    targetPort: 80
  sessionAffinity: None
  type: ClusterIP
---
apiVersion: networking.k8s.io/v1
kind: Ingress
metadata:
  name: nginx
  labels:
    app: nginx
  annotations:
    cert-manager.io/cluster-issuer: letsencrypt-staging
    # You will probably want to re-run this manifest with this
    # set to true later. For now it *must* be false, or the
    # ACME challenge will fail: you don't have a cert yet!
    ingress.kubernetes.io/force-ssl-redirect: "false"
    # This is important because it tells Contour to handle this
    # ingress.
    kubernetes.io/ingress.class: contour
    kubernetes.io/tls-acme: "true"
spec:
  tls:
  - secretName: '<a meaningful name here>'
    hosts:
    - '<your hostname>'
  rules:
  - host: '<your hostname>'
    http:
      paths:
      - pathType: Prefix
        path: /
        backend:
          service:
            name: nginx
            port:
              number: 80

Read through this before you run it, there are a few things you will need to change in the bottom section. There are a ton of other ways to deploy this but this is enough to get it running and show that your setup is working.

Now just run kubectl apply -f nginx.yaml. Following a successful application, you should be able to run kubectl get deployments,services,ingress and get something back like:

NAME                   READY   UP-TO-DATE
deployment.apps/nginx  1/1     1

NAME           TYPE        CLUSTER-IP    EXTERNAL-IP   PORT(S)   AGE
service/nginx  ClusterIP   10.152.183.94 <none>        80/TCP    5d1h

NAME          CLASS    HOSTS      ADDRESS  PORTS AGE
ingress ...   <none>   some-host  1.2.3.4  80    5d1h

This has also created a certificate request and begun the ACME challenge. You can see that a certificate has been requested and check status by running kubectl get certificates.

k8 get certificates
NAME      READY   SECRET    AGE
my-cert   True    my-cert   4d6h

Once the ACME challenge has succeeded you can see Ready: True. If something goes wrong here, you can follow this very good troubleshooting guide.

You can test against your site with curl --insecure since the cert from the staging environment is not legit.

Final Steps

Once that all works, I recommend re-running against the production letsencrypt by changing the nginx.yaml to reference it and re-applying. You can watch the ACME challenge by inspecting the pod that will be created to run the ACME nginx.

That’s pretty much it. Kubernetes is huge and infintitely configurable, so there are a million other things you could do. But it’s up and running now.

https://relistan.com/running-your-own-kubernetes
Events, Event Sourcing, and the Path Forward
articleseventsevent-sourcingcommunity
Show full content

TinCanTelephone

Distributed systems pose all kinds of challenges. And we’ve built them in the web age, when the tech of the wider Internet is what we use in microcosm to build the underpinnings of our own systems. Our industry has done somersaults to try to make these systems work well with synchronous calls built on top of HTTP. This is working at scale for a number of companies and that’s just fine. But if you were to start from scratch is that what you would build? A few years ago, we had that opportunity and we decided, no, that’s not what we would build. Instead, we built a distributed, asynchronous system centered around an event bus, and it has been one of the best decisions we’ve made. Most of the things that make a service architecture painful are either completely alleviated or mostly so, with only a few tradeoffs. Here’s what we’ve built at Community, and some of what we have learned.

Beyond The Monolith

The advice du jour is that you should start with a monolith because it allows you to iterate quickly, change big things more easily, and avoid any serious consistency issues—assuming you back your service with an ACID-compliant DB. That’s good advice that I also give to people, and we did that. That scales pretty well, but becomes an issue as you grow the team and need to iterate on independent work streams.

Queuing

But what’s the next step? For us, the next step was to stop building things in the monolith and to build some async services that could work semi-autonomously alongside it. Our platform is a messaging platform so this was already a reasonably good fit: messages aren’t delivered synchronously and some parts of the workflow can operate like a pipeline.

We needed at least a queuing system to do that, something that would buffer calls between services and which would guarantee reliable delivery. We are primarily an Elixir shop so we picked RabbitMQ because of the good driver support on our stack: RabbitMQ is written in Erlang and Elixir runs on the same VM and can leverage any Erlang libraries. This has turned out to be a really good choice for the long term. RabbitMQ is super reliable, can have very good throughput, is available in various hosted forms, and has a lot of different topologies and functionality that make it a Swiss army knife of async systems. We paid a 3rd party vendor to host it and began building on top of it.

Initially we used a very common pattern and just queued work for other services, using JSON payloads. This was great for passing things between services where fire-and-forget was adequate. Being able to rely on delivery once RabbitMQ accepted the message from the publisher means you don’t deal with retries on the sender side, you almost never lose messages, and the consumer of the messages can determine how it wants retries to be handled. Deploys never interrupt messaging. A service can treat each message as a transaction and only ack the message once work has been completed successfully. All good stuff.

But the core data and associated models was/were still locked up inside the monolith. And we needed to access that data from other services fairly often. The first pass was to just look at the messages passed from the monolith to other services and do a local DB call to enrich them with required fields before passing them on. That works for a few cases just fine.

Other Paradigms

We built other kinds of async messaging between services on top of those same ad hoc JSON messages, knowing full well that wasn’t what we wanted long term, but learning about the interaction patterns, and getting our product into the market.

But, eventually you litter the code with DB enrichment calls and other complexity. And with no fixed schemas, the JSON messaging rapidly outscales your ability to reason about it. Instead, wouldn’t it be nice if a new service could also get a copy of those same messages? And wouldn’t it be really great if the people writing that new service didn’t have to talk to the people emitting those messages to make sure the schema wouldn’t change on them? And what if you could get a history of all the major things that ever happened in the system in the form of messages? And maybe a new service could have access to that history to bootstrap it?

Events!

Yes, to all of the above. That’s what a truly event-based system offers. And that’s what we transformed this async system into.

Building the async system in the first place made this much easier and I want to shout out to Tomas Koci, Jeffrey Matthias, and Joe Merriweather-Webb who designed and built most of that and who have made many contributions to the events system as well. Once we were in the market with our product, we all agreed it was time for the next phase.

In mid-2019, Andrea Leopardi, Roland Tritsch, and I met up in Dublin and plotted the course for the next year or so. The plans from that meeting turned into the structure of the events system we have now. A lot of people have contributed since! This has been a big team effort from the folks in Community Engineering. I have attempted to name names here wherever possible, but there are a million contributions that have been important.

Since building the bus, we’ve grown to about 146 services running in production, of which 106 are core business services (61 Elixir, 20 Go, 7 Python, remainder 3rd party or other tech). Most core business logic lives in Elixir with Go in a supporting role, and Python focused on data science. This is nearly 2 services per engineer in the company. On most stacks that would be an enormous burden. On our system, as described below, it’s fairly painless. We still have the monolith, but it’s a lot smaller now. It gets smaller all the time, thanks to the drive of Jeffrey Matthias, Geoff Smith, Lee Marlow, and Joe Lepper among others.

So, back to the story…

envelope

The Public Event Bus

The next step was the move to a system with a public event bus. We made some pretty good decisions but still live with a few small mistakes. So I’ll describe a simpler version of what we have now and gloss over the iterations on getting to this points, and I’ll call out mistakes later.

If you aren’t familiar with the idea of an event bus, it boils down to this: any service can listen on the bus for events that happen anywhere in the system, and then do whatever they need to do based on the event that happened in the system. Services that do important things publish those events in a defined schema so that anyone can use them as they need. You archive all of those events and make them arbitrarily queryable and replayable. To be clear here about what we mean when we say “events”: Events are something that happened, Commands are a request for something to happen. We started with only events, and that was a good choice. That approach allowed us to more carefully iterate on the events side so that we didn’t make the same mistakes in two places at once.

For other interactions between services we built an async RPC functionality over RabbitMQ that essentially provides a very lightweight Protobuf wrapper around arbitrary data. This enabled us to largely punt on Commands implementation while we got good at events. It allowed us to identify sensible practices in a private way between services before making those commands public system-wide.

So let’s talk about the event bus and event store since that’s the core of the system.

System Overview

Our public bus is RabbitMQ, with a common top-level exchange. We separated it into two clusters: one built around text messages (e.g. SMS) that we process and the main one around events that are the real core of the system. This allowed us to have very low latency on core data events while allowing more latency on the high throughput messaging cluster. You could run it on on a single cluster, but we have enough messaging throughput that separation was a good choice. It also divides the fault domain along lines that make sense for our system.

We publish events to the main bus (a topic exchange), using event type as the routing key. Services that want to subscribe to them do so. Those services may then event-source a projection into a DB of their own based on those events, or simply take action as required. DB tech is whatever the service requires. We have Postgres, Vitess (MySQL), Redis, Cassandra, ElasticSearch, etc. For services that do event source, we have standardized a set of rules about how they must interact with the bus, how they handle out-of-order events, duplicates, etc. We have a LADR that defines how this must work. The technical side of this is built into a shared Elixir library that most of the services use. This wraps the excellent Broadway library, the Broadway AMQP integration, and our generated Protobuf library containing the schemas. It provides things like validation and sane RabbitMQ bindings, and publishes an events manifest we can use to build maps of who produces and consumes which events. Dan Selans worked for us back then, and built a frontend that makes those manifests human consumable, and draws an events map. This is very useful!

Because some of the services in our system are written in Go, we have built some of the same logic in that language and leverage the Benthos project (which we sponsor) for the work pipelining, similar to how we use Broadway in Elixir. Benthos is an unbelievable jack-of-all-trades that you should take a look at if you don’t know it. We additionally build all the Protobuf in Python for use in data science activities, but don’t have a full events library implementation…. yet.

We archive everything that is published on the bus and put it into the event store. This then enables replays.

Sourcing

When we start a new service that needs to source events, we bootstrap it from a replay of historical events and it writes them to its DB using the same code it will use in production. Because our services must handle out of order events, we can generally replay any part of the history necessary at any future point. Simple rules about idempotency and a little bit of state keeping solve this out of order handling for the 95% case. The remaining 5% tend to be one-off solutions for each use case.

Entropy

Services now have their own projection(s) of what things look like from the events they have consumed. Because this is so distributed, even with RabbitMQ ensuring deliverability, there are still many ways the system could introduce drift.

Underpinning all of the other mechanisms is another simple rule: we have worked hard to guarantee that one event type is published from one service. This vastly reduces the complexity of working with them.

We handle anti-entropy by several means:

  1. We have a fallback for RabbitMQ. If it’s not available for publishing, services will fall back to Amazon SQS. This is an extremely rare occurrence, but ensures we don’t lose events. We can then play events from SQS into RabbitMQ when it comes back up. Thus, services don’t subscribe to SQS.

  2. Services must handle all events that are of the type they subscribe to. This means any failure to do so is an error that must be handled. This is pretty rare in production because it generally gets caught pretty early on, and Protobuf and our events library help guarantee correctness.

  3. We run daily replays of all of the previous day’s core events, on the production bus. We don’t replay message events, but all of the core system events are replayed. This means that a service has a maximum window of 24 hours to have missed an event before it sees it again. We’ll be adding 1 hour replays or similar in the next few quarters.

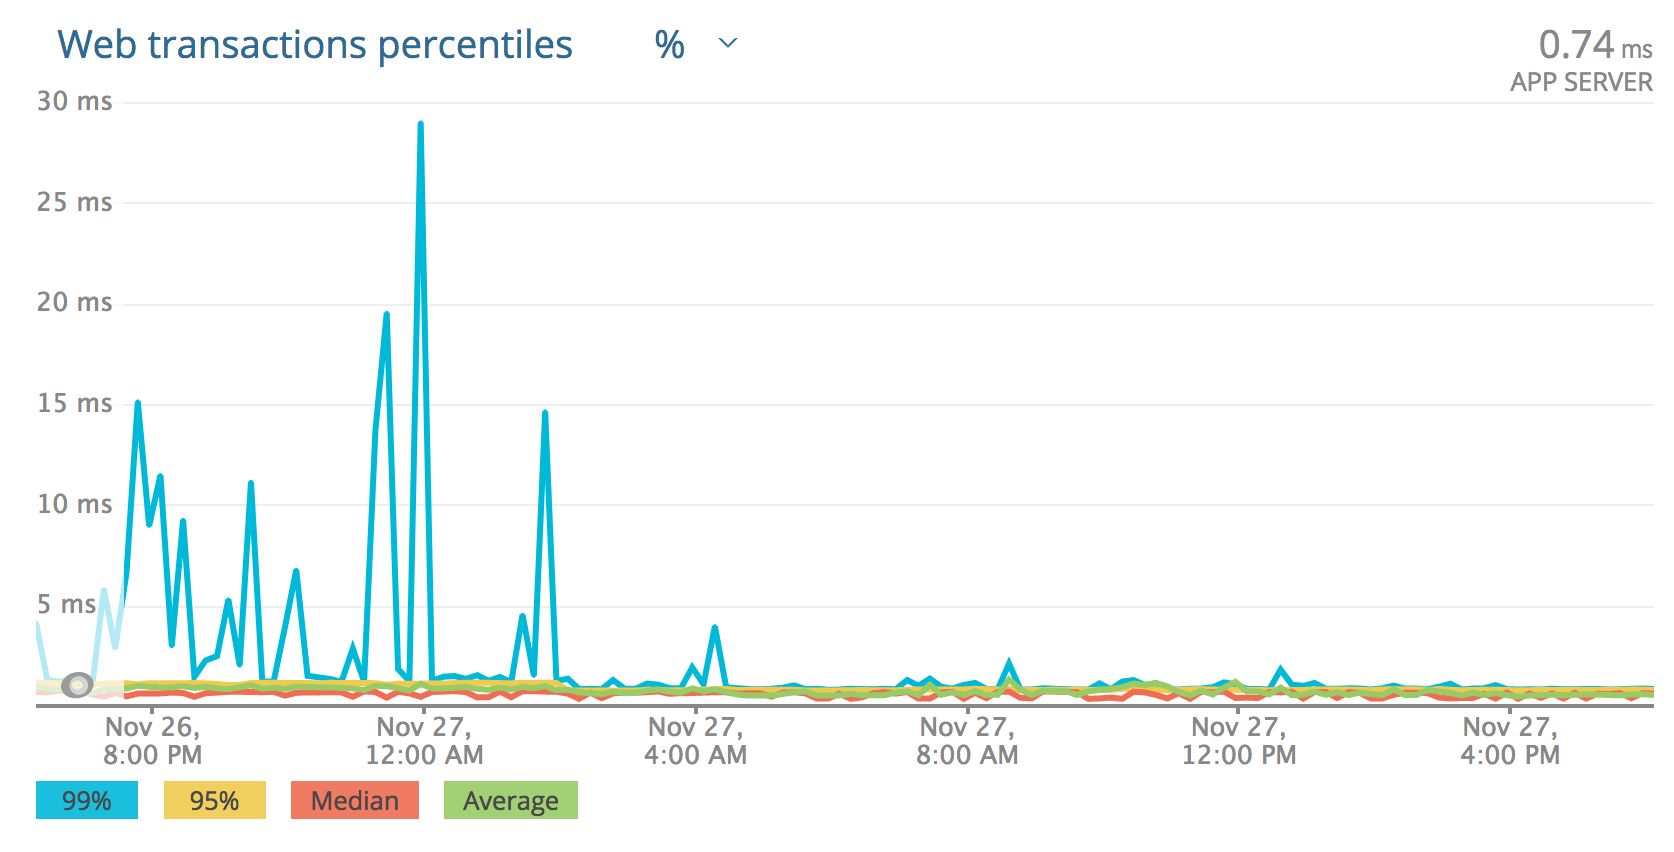
  4. We run Spark jobs that compare drift on some event-sourced DBs against the event store. This allows us to track how widespread any issues may be. We have dashboards that let us see what this looks like. It’s extremely small drift, and is generally insignificant. Recents runs show that average drift is 0.005%, which is already very good, but is better than it looks because it also reflects changes that happen while the run is in flight. For all practical purposes this then simply reflects eventual consistency and in absolute numbers is basically zero.

Consistency

We handle consistency by assuming eventual consistency whenever possible. Where it’s not possible, we do allow querying of a remote service to get data. Events related to that data should only be published by one service. So it’s possible to get an authoritative source when strictly necessary. This is done over a synchronous RPC implementation on top of RabbitMQ with Protobuf thanks to Tom Patterer and Andrea Leopardi. Andrea wrote about this implementation.

Many of the frontend calls go through the monolith. This then provides some consistency for the models it contains. We sometimes use the monolith as a BFF where necessary, to provide some consistency. For all other cases we query directly against the services themselves via an API gateway.

Commands

Following on the two year success of the event bus, we introduced commands, which work quite similarly but which express a different idea. Commands are a request for something in the system to happen (intent). Services may or may not take action as a result. If they do, they may or may not generate events. Commands are also public, archived, and replayable. This is so far working quite well, but runs alongside other interaction methods described below. We’ll phase out much of the async RPC in favor of Commands now that we have them.

Current State

We continue to iterate and improve on this system. Some more improvements and efficiencies are slated for this year already. We’ll write more about those when we get there. If you are a person who wants MOAR detail, keep reading below. I’ll attempt to describe some of this in more technical detail.

lion moaring

More Details

That gives a pretty good overview. But if you want to know more, read on.

Routing, Exchanges, Queues

We don’t leverage headers for much routing, but there are a few places in the system that add them and use them (e.g. for a consitent-hash-exchange). But most routing is by event type and that’s our key. We learned early on that each service should attach its own exchange to the top-level exchange and hang its queue off of that. Exchanges are really cheap for RabbitMQ and this allows services to use a different exchange type if necessary—and it also prevents rapid connects/disconnects from impacting the main bus. This happened when an service once went nuts and was bound to the top level. That hasn’t happened since.

Most services will bind a single durable queue to their exchange to make sure that they receive events even when down, and the work is spread across the instances of the service when up. Some services use ephemeral queues that go away when they are not running. Others use different topologies. RabbitMQ is very flexible here and has been the bedrock of our implementation.

Archiving

Once things are on the bus, we archive every single one. We have a service that subscribes to every event type on the two buses, aggregates them in memory into file blobs, then uploads them to Amazon S3 (the “event store”). This archiver only acks them from Rabbit once they are uploaded, so we don’t lose events. Those files on S3 are in a run-length-encoded raw Protobuf format, straight from the wire, grouped into directories by timestamp and event class. Filenames are generated in a consistent way, and include some hashing of the contents so that we prevent overwrites.

Like the majority of the services operating on the events store and bus, this service is written in Elixir and leverages all of the badassery of Erlang’s OTP and supervision trees to be always working. It doesn’t break.

Event Store Iteration

The main event store is the archive of raw Protobuf that was sent on the wire, encoded with a run length encoding into blob files that are posted to S3, as mentioned. After the first year, Tom Patterer and Aki Colovic here in Europe built Apache Spark jobs and a Go service to transform those into Parquet files on S3 more or less as they get written—so there is very little latency between the two. We can then leverage AWS Athena (Presto) for ad hoc queries, monitoring of events, and understanding what is there.

And, the ability to query all of history for debugging is an amazing thing that I don’t think I’d ever want to live without again. It takes a lot of pressure off of distributed tracing, although we do have that for complex flows on Otel thanks to Jaden Grossman, Tatsuro Alpert, and Bradley Smith.

Replays

We built a replayer service that initially could only do replays by event type and time range, played straight from S3 to a private copy of the bus (“the replay bus”). Services can hook up to that bus to get the replayed data. We usually do this with a one-off deploy of the same code. That got us well into this: it was enough for the first year.

Later on, we built further integration with AWS Athena that allows us to arbitrarily query events from the event store in Athena from Parquet files on S3, and also allows for the results of a query to be used in an event replay. This allows for very targeted bootstrapping of new services, repairing outages, fixing state when a bug caused a service to behave badly, etc. The ability to arbitrarily query all of history also helps when looking for any issues in the event store or your service. Athena is pretty quick, even with several years of data. Partitioning by event date and type really helps. We actually use our Go libs from Spark and I wrote about how to do that.

Snapshots

An additional step we took later (thanks to Moritz Mack) was to use Spark to build daily snapshots in the form of Parquet tables of events… that can also then be replayed. This also speeds up querying and consistency checking by vastly reducing the amount of queried data. We currently rebuild those snapshots nightly from all of history so that there is no drift. We will move to incremental snapshotting at some point, but Spark and S3 are hugely fast, and we have enough individual files to run in parallel nicely.

Events and Event Schemas

The best decision we made was to use Protobuf for messaging. Protobuf is one of the only modern encoding systems that had good support across all three of our core languages. There were two Protobuf libraries in Elixir at the time. We picked one, then later switched to elixir-protobuf, to which we are now major contributors thanks to Andrea Leopardi, João Britto, and Eric Meadows-Jönsson. Using Protobuf means that we can guarantee compatibility on schemas going forward, have deprecation ability, and because it is widely supported, we have access to it in all of the toolsets where we need it. It also converts back and forth to JSON nicely when needed.

Protobuf schemas, unlike Avro, for example, don’t accompany the data payload. This means that you need to provide them to the software that needs them out of band. Andrea Leopardi wrote about how we do that so I won’t detail it here. We took most of the pain out of this by designing the schemas in a way that means most services don’t always have to have the latest schemas. And because Protobuf allows decoding all of a payload that you do know, it means as long as we’re only adding fields we don’t have any issues.

To do this, we designed a schema where there is a common Event base, an Envelope with a separate set of guaranteed fields for all events (e.g. id, timestamp, and type). This allows systems to process events without always having the very latest schemas unless they need to access the new event type or new fields.

Other Communication Methods

Events make this all so much easier. But it’s hard to always use them (or commands). It’s possible but there are just places where you need something else. We have some get out of jail free cards. When we model new solutions in our space we push the following hierarchy:

  1. Events and Commands first. If it can be done with events/commands, we do that.
  2. Async, stateless RPC over a queue. For things like queueing work to yourself or another service. Private calls that don’t need archiving or, replays.
  3. Synchronous RPC, using queues for call-response
  4. HTTP as a last resort

I believe that in the core system there are only two remaining places that widely leverage HTTP for things other than serving APIs to frontends.

Things We Learned

You don’t build an entire system without running into issues. Here are some things we learned. They are not strictly ordered but somewhat in order of importance.

  • Putting events on S3 was a really good decision. It has all the S3 goodnesss, and also unlocks all of the “Big Data” tools like Spark, Athena, etc.

  • People will find every way possible to publish events that aren’t right in one way or another. This is no surprise. But really, if you are deciding where to allocate time, it’s worth all the effort you can muster to put validation into the publishing side.

  • Being able to throw away your datastore and start over at any time is powerful. For example: we run ElasticSearch but we never re-index. We just throw away the cluster and make a new one from a replay thanks to Alec Rubin, Joe Lepper, and Brian Jones. If you have to swap from one kind of datastore to another (e.g. Redis -> Postgres) you can just rehydrate the new store from a replay using the same event sourcing code you would have to write anyway. Very little migration code.

  • Sometimes you want to represent events as things that occurred. Sometimes you want to represent them as the current state of something after the occurrence. Some people will tell you not to do the latter. Making this a first class behavior and clearly identifying which pattern an event is using has been super helpful. We do both.

  • Use the wrapper types in Protobuf. One major shortcoming of Protobuf is that you can’t tell if something is null or the zero value for its type. The wrappers fix that.

  • If you have to interact with a DB and publish an event, sometimes the right pattern is to publish the event, and consume it yourself before writing to your DB. This helps with consistency issues and allows you to replay your own events to fix bugs. Lee Marlow, Geoff Smith, and Jeffrey Matthias called this pattern “dogfooding”. Sometimes the right pattern is to send yourself a command instead.

  • Protobuf supports custom annotations. Those can be really helpful for encoding things like which events are allowed on which bus, which actions are allowed on the event, etc. Especially helpful when building supporting libraries in more than one language.

  • Daily replays allow you both an anti-entropy method as well as a daily stress test of the whole system. This has been great for hammering out issues. It also guarantees that services can deal with out-of-order events. They get them at least every day. The main gate to rolling it out was fixing all of the places this wasn’t right. Now it stays right.

  • Event-based systems make reporting so much easier! And data exports. And external integrations. And webhooks, and a million other things.

  • The event store is a fantastic audit trail.

  • We sometimes rewrite our event store if we’ve messed something up. We save up a list of the screw-ups and then do it in batch. We leave the old copy on S3 and make a new root in the bucket (e.g. v4/). We use Spark to do it. We don’t remove the old store so it’s there for auditing.

  • Write some tools to make working with your events nicer. We have things to listen on a bus, to download and decode files from the raw store, etc.

  • Local development seeds are easy when you have events. Just seed the DB with a local replay of staging/dev data.

Future

On the roadmap for the next year is to take our existing service cookie cutter repo and enable it to maintain live event-sourced projections in the most common format for a few very commonly used event types. We’ll snapshot those nightly and when standing up a new service, we can start from the latest DB snapshot and only replay since. This will make things even more efficient.

https://relistan.com/event-sourcing-and-event-bus
Coordination-free Database Query Sharding with PostgreSQL
articlesdatabasescommunity
Show full content

slice of pie

At Community.com, we had a problem where a bunch of workers needed to pick up and process a large amount of data from the same DB table in a highly scalable manner, with high throughput. We wanted to be able to:

  1. Not require any coordination between the workers
  2. Be able to arbitrarily change the amount each worker would pick up
  3. Not have to shard the table

I came up with a solution that has been in production, at scale, for quite awhile now. While it was my design, other great engineers at Community deserve the credit for the excellent implementation and for rounding off some of the rough edges. It was a team effort! There are undoubtedly other ways to solve this problem, but I thought this was pretty interesting and I myself have never seen anyone else do it before. I am not claiming it’s entirely novel. But this is what we did to nicely solve this problem.

The Problem

We have workers that process outbound SMS campaigns. They need to be able to take a single message and dispatch it to a million plus phone numbers. And, they need to do that at most once for each number. These workers have access to a data store that maps some data related to the campaign to a set of recipients. The workers don’t actually do the SMS, but they do the heavy lifting: the expansion of one message to millions.

We wanted to be able to divide that audience up into chunks of a size large enough to be efficient for querying and processing, and small enough that a worker could shut down mid-campaign and not lose anything. Ideally each worker would pick up an amount of work, crank through it, and then process another piece of work, without checking in with anyone else.

You could, as we initially did, have a single process read in all the recipient information from the DB and write batches of IDs into a queue for processing. That is simple. It worked fine way back in the early days. But it’s very slow. Single-threaded walking through a DB table is slow. It’s linear time. As that line gets longer it gets really bad. Further, our whole system also uses UUID4 primary keys, so it’s not trivial to walk a DB table or to provide ranges of IDs. If you were to use auto-increment integers this is easier, but then you will have other problems to solve. I’d rather not have those problems.

The Solution

We wanted a way for the single threaded job to be able to rapidly enqueue work without querying the DB, and for all the querying to happen in the workers, in parallel, against multiple read replicas. Our whole backbone is built on RabbitMQ, so this was the natural place to queue work. Our campaign workers are written in Elixir, like much of the rest of the system, and they can leverage the awesome Broadway library for processing. So all we needed was a way to divide up the table in a consistent way, so that given a set of parameters, the results to any query would be fairly evenly divisible into chunks without knowing ahead of time exactly how many there would be or which specific rows were assigned to the worker.

You might think, “partitioning!” but for various reasons that doesn’t make sense. You could argue positives and negatives of the tech, but the main blocker was that we need to query the table and get a result in chunks that will be reasonably evenly distributed no matter what other parameters we want to query on. So we’re not just ranging over IDs, we’re ranging over the results of an SQL query that filters on various fields in the row in arbitrary combinations. And while newer Postgres Hash partitions could maybe be made to work here, we need way more chunks than you’d ever want partitions. And we want to arbitrarily assign which workers take which ranges.

To be clear: we will run the same query on multiple workers, with overlapping queries, delays, etc, without any further coordination in the workers, and we’ll make sure that none of the results have any overlapping data, without hard partitioning in Postgres.

So, dividing a keyspace into buckets that can be addressed arbitrarily… that sounds a lot like a hashing function. Like most problems with distributed systems, hashing is part of the solution, if not the whole solution! What we wanted was:

  1. Assign a bucket to every row ahead of time
  2. Originating job publishes work covering bucket ranges
  3. Workers consume the work and run the query, supplying a bucket range
  4. Workers get results covering only those buckets, process them, return to 3

The design was to have a fixed number of buckets. This necessarily needed to be sized by the largest amount that made sense for a worker to process, given the largest campaign size we expected to see. In the end we chose 1,000 buckets. Armed with the knowledge of how many buckets there are and how many messages we need to publish, the originating job could publish the right number of work requests with the right number of bucket ranges in each. If your campaign only has 1000 recipients, we’d queue 1 item into RabbitMQ, with a bucket range of 0-999. If you had 1 million recipients, we’d queue up 100 items with 10 shards each.

Distribution isn’t perfect but it’s darn good.

The Details

The implementation is surprisingly(?) simple.

How do you turn your DB table into buckets addressable by a hash? Do we store it in the row? Nope. How about using PostgreSQL’s indexing on the result of a function? On the insertion of every row, an index gets updated with the result of the function as the key. Then, when you query with that function, you hit the index instead, so all the expensive math is done on insert and what is indexed is just an integer. There are undoubtedly other ways to make this work in PostgreSQL. You could calculate the bucket in code and write it in a column. But it’s pretty nice like this because Postgres manages all the annoying bits and we don’t have to mess with the field anywhere since it exists only in the index.

We need a hashing function with very good distribution. There are a number of these, but most are not available inside Postgres. But MD5 is, so that’s what we’re using.

This is our index:

CREATE INDEX CONCURRENTLY <table_name>_sharding_md5_modulo_1000_index
ON <table_name> (mod(abs(('x'||substr(md5(id::text),1,16))::bit(64)::bigint), 1000))

That is creating an index where the key to the index for this row is the result of that function. When we want to query it, we do the following:

SELECT id FROM <table_name> WHERE <arbitrary query here>
AND mod(abs(('x'||substr(md5(?::text),1,16))::bit(64)::bigint), 1000) BETWEEN ? AND ?

Now those workers can dequeue their work item, run their query, and then stream messages into RabbitMQ while they process the results of their query. Despite how that SELECT may look, no actual math is being done to hash each of those rows. This is hitting the pre-calculated index. The only hash function math is done at insert time.

Conclusion

So there you go, a super flexible way to break a table into chunks that can be combined with any arbitrary query the table can support. I called it “Coordination-free” in the title. Someone might object to that saying the coordination is happening in the originating job. It’s true some coordination is happening there. But it’s not happening in any high throughput part of the system. Those parts just crank away at scale.

We’ve been running this in production for a year, processing billions of messages through it. Performance is excellent and while we initially viewed this as a temporary “hack” to work around a performance problem, it has become a trusted part of the toolbox. Maybe it fits in your toolbox, too.

https://relistan.com/coordination-free-db-query-chunking
Writing Apache Spark UDFs in Go
articlesgojavasparkcommunity
Show full content

Spark Gopher

Apache Spark is a perfect fit for processing large amounts of data. It’s not,  however, a perfect fit for our language stack at Community. We are largely an Elixir shop with a solid amount of Go, while Spark’s native stack is Scala but also has a Python API. We’re not JVM people so we use the Python API—via the Databricks platform. For most of our work, that’s just fine. But, what happens when you want to write a custom user defined function (UDF) to do some heavy lifting? We could write new code in Python, or… we could use our existing Go libraries to do the job! This means we have to wrap up our Go code into a jar file that can be loaded into the classpath for the Spark job. This is how to do that.

(Note that everything below could equally apply to UDAFs—aggregate functions)

Why Did You Do This Crazy Thing?

You might be wondering how well this works. To put that issue to rest: it works well and has been effective for us. That being established, let’s talk about our use case. We have a large amount of data stored in a binary container format that wraps Protobuf records, stored on AWS S3. Spark is great with S3, but cannot natively read these files. Complicating things further, schemas for the Protobuf records need to be kept up to date for all the tools that process this data in anything but the most trivial way.

Over time we have built a set of battle-tested Go libraries that work on this data. Furthermore, we already maintain tooling to keep the Protobuf schemas and Go libraries up to date. It seems natural to leverage all of that goodness in our Spark jobs:

  1. Battle-tested libs that have been in production for awhile, with good tests.
  2. We already manage pipelines to keep the schemas up to date for the Go libs.

Given the tradeoffs of reimplementing those libraries and the CI jobs, or wrapping Go code up into jar files for use as Spark UDFs, we did the sane thing!

Spark UDFs

Spark is flexible and you can customize your jobs to handle just about any scenario. One of the most re-useable ways to work with data in Spark is user defined functions (UDFs). These can be called directly inside Spark jobs or Spark SQL. In our case we use a UDF to transform our custom binary input and Protobuf into something that Spark more easily understands: JSON.

This means we can do something like this:

import pyspark.sql.functions as F
import pyspark.sql.types as T

spark.udf.registerJavaFunction("decodeContent", "com.community.EventsUDF.Decoder")

# Define a schema for the JSON fields we want (you must customize)
event_schema = T.StructType([
  T.StructField("wrapper", T.StructType([
    T.StructField("id", T.StringType()),
    T.StructField("somefield", T.StringType()),
    T.StructField("timestamp", T.StringType()),
    T.StructField("anotherfield", T.StringType())
  ]))
])

events_df = (
  spark.read.format("binaryFile")
  .load(f"s3a://path_to_data/*")
  .withColumn("content", F.expr("decodeContent(content)").cast(T.StringType()))
)

parsed_json_df = (
  (events_df)
  .withColumn("json_data", F.from_json("event", event_schema))
  # Break out part of the JSON into a column
  .withColumn("type", F.col("json_data.yourjsonfield.type"))
)

# Continue working with the dataframe

By transforming the data into JSON, we get to work on something that is much more native to Spark than Protobuf. Because we use the libraries that are already maintained with up to date bindings, we don’t have to manage that inside Spark itself. We only have to update our UDF in the jar loaded by the job.

Building a Spark UDF in Go

Before we look too hard at anything else we need to get Go code into a wrapper that lets us call it from Java. Then we’ll need to write a little Java glue to wrap the Go code into the right types to make Spark happy when calling it. Luckily, for this use case it’s all pretty simple.

Wrapping Go Code Into a Java Library

First, we need some Go code to wrap. The library we talked about was built for one purpose, but we need a little wrapper function to do just the part we need to call from Spark. In our case we’ll take a single value from Spark and return a single value back. Both of those values will be of type []byte which makes things really simple going between Go and Java, where this type interchanges easily. I made a file called spark_udf.go that looks like this:

package eventdecoder

import (
        "bytes"
        "compress/gzip"
        "io/ioutil"

        "github.com/company/yourlib"
)

func Decode(data []byte) []byte {
        zReader, err := gzip.NewReader(bytes.NewReader(data))
        if err != nil {
                // We return an error as the body!
                return []byte(err.Error())
        }

        uncompressedData, err := ioutil.ReadAll(zReader)
        if err != nil {
                // We return an error as the body!
                return []byte(err.Error())
        }

        output, _, _, err := yourlib.DoSomeWork(uncompressedData) 

        // Handle errors, etc

        return bytes.Join(output, []byte("\n"))
}

Now that we have that, we need to get it into a jar file with all the bindings that will let Java call into the Go function. As part of the gomobile efforts to integrate Go with Android, there are some tools that will handle two way wrappers between Java and Go. gobind will generate Java bindings for exported functions in a Go module. You could start there and build up the necessary tools to make this work. Sadly, it’s not at all trivial to get it into a shape that will build nicely.

After messing around with it for awhile, I found a tool called gojava that wraps all the hard parts from gobind into a single, easy to use tool. It’s not perfect: it does not appear to be under active development, and does not support Go modules. But, it makes life so much easier, and because none of this stuff changes that often, the lack of active development isn’t much of a hindrance here. The ease of use makes it worth it for us. Getting a working Java jar file is a single step:

JAVA_HOME=<your_java_home> \
        GO111MODULE=off \
        gojava -v -o `pwd`/eventdecoder.jar build github.com/<your_module_path>

This will generate a file called eventdecoder.jar that contains your Go code and the Java wrappers to call it. Great, right? If you are using Go modules, just use go mod vendor before running gojava to make sure that you have all your dependencies in a form that gojava can handle.

Adding the Right Interface

But we are not done yet. The Go code in the jar we built does not have the right interface for a Spark UDF. So we need a little code to wrap it. You could do this in Scala, but for us Java is more accessible, so I used that. Spark UDFs can take up to 22 arguments and there are different interfaces defined for each set of arguments, named UDF1 through UDF22. In our case we only want one input: the raw binary. So that means we’ll use the UDF1 interface. Here’s what the Java wrapper looks like:

package com.community.EventsUDF;
import org.apache.spark.sql.api.java.UDF1;
import go.eventdecoder.Eventdecoder;

public class Decoder implements UDF1<byte[], byte[]> {
        private static final long serialVersionUID = 1L;

        @Override
        public byte[] call(byte[] input) throws Exception {
				// Call our Go code
                return Eventdecoder.Decode(input);
        }
}

We stick that in our path following the expected Java layout. So if spark_udf.go is in the current directory, below it we put the above files in java/com/community/EventsUDF/Decoder.java. Note that this needs to match your package name inside the Java source file.

Assembling It

We’re almost there! But, we need the Spark jar files that we’ll compile this against. Our project has a Makefile (which I’ll share at the end of this post) that downloads the correct jars and sticks them in ./spark_jars. With those being present, we can compile the Java code:

javac -cp \
	spark_jars/spark-core_$(VERSION).jar:eventdecoder.jar:spark_jars/spark-sql_$(VERSION).jar \
	java/com/community/EventsUDF/Decoder.java

With that compiled we can just add it to our Jar file and we’re ready to go!

cd java && jar uf ../eventdecoder.jar com/community/EventsUDF/*.class

That will update the jar file qnd insert our class. You can load that up into Spark and call it as shown at the start of this post.

Important Notes

You need to build this for the architecture where you will run your Spark job! Spark may be in Scala, and we may have wrapped this stuff up into a Java jar, but the code inside is still native binary. You may have some success with GOOS and GOARCH settings, but it has not been repeatable for us with gojava. We’ve built our UDFs that we use on Databricks’ platform under Ubuntu 18.04 with Go 1.14 and they work great.

Another gotcha that Aki Colović found when working with this stuff, is that your Go package cannot contain an underscore or it makes the Java class loader unhappy. So don’t do that.

A Makefile to Make it Simpler

There were a few finicky steps above and this needs to be repeatable. So, I built a Makefile to facilitate these UDF builds. It does all the important steps in one go. As you will see below, we have cached the right versions of the Spark jars in S3, but you can pull them from wherever you like. If you are into Java build tools, feel free to use those.

The Makefile I wrote looks like this. You will likely have to make little changes to make it work for you.

# Makefile to build and test the eventdecoder.jar containing the
# Apache Spark UDF for decoding the events files in the Community
# event store.
SCALA_VERSION := 2.11
SPARK_VERSION := 2.4.5
VERSION := $(SCALA_VERSION)-$(SPARK_VERSION)
BUCKET_PATH ?= somewhere-in-s3/spark
JAVA_HOME ?= /usr/lib/jvm/java-8-openjdk-amd64
TEMPFILE := $(shell mktemp)

all: ../vendor udf

../vendor:
	go mod vendor

.PHONY: gojava
gojava:
	go get -u github.com/sridharv/gojava
	go install github.com/sridharv/gojava

eventdecoder.jar: gojava
	JAVA_HOME=$(JAVA_HOME) \
		GO111MODULE=off \
		gojava -v -o `pwd`/eventdecoder.jar build github.com/my-package/eventdecoder

spark_jars/spark-sql_$(VERSION).jar:
	mkdir -p spark_jars
	aws s3 cp s3://$(BUCKET_PATH)/spark-sql_$(VERSION).jar spark_jars

spark_jars/spark-core_$(VERSION).jar:
	mkdir -p spark_jars
	aws s3 cp s3://$(BUCKET_PATH)/spark-core_$(VERSION).jar spark_jars

spark-binaries: spark_jars/spark-core_$(VERSION).jar spark_jars/spark-sql_$(VERSION).jar

# Build the UDF code and insert into the jar
udf: spark-binaries eventdecoder.jar
	javac -cp spark_jars/spark-core_$(VERSION).jar:eventdecoder.jar:spark_jars/spark-sql_$(VERSION).jar java/com/community/EventsUDF/Decoder.java
	cd java && jar uf ../eventdecoder.jar com/community/EventsUDF/*.class

.PHONY: clean
clean:
	rm -f eventdecoder.jar
Conclusion

What may seem like a slightly crazy idea turned out to be super useful and we’ve now built a few UDFs based on this original. Re-using Go libraries in your Spark UDF is not only possible, it can be pretty productive. Give it a shot if it makes sense for you.

Credits

The original UDF project at Community was done by Alec Rubin and me, while improvements were made by Aki Colović, and Tom Patterer.

https://relistan.com/writing-spark-udfs-in-go
Hello World on the W65C265 (65816) from macOS
articlesassemblymicrocontroller65c0265816
Show full content

Mensch SXB

I have been lucky enough to be healthy so far and have been using lockdown time to get back into electronics and microcontrollers, a hobby that is very compatible with being stuck at home. I have a bunch of Arduino, STM32, ESP8266, and ESP32 boards, but something was calling me more to the retro side of things. My first computer was an Apple //e and I learned to do some 6502 assembly when I was a kid. I later upgraded to an Apple IIgs which was based on the 65816 (which also powered the Super Nintendo). When I was about 13, I saved up and bought myself Orca/M which was an assembler targeting the 65816 on the IIgs. I learned a small amount then before moving on to Orca/C. But I always regretted not learning more. So I wanted something along those lines to play with now.

There are a few options here. There is always emulation. This is a reasonable option, but then I don’t get to play with the electronics of the computer. I could buy a vintage IIgs but they are expensive and take up a bunch of space. Neither of these appealed heavily, though I’m not ruling out a IIgs in the future.

After a little research, I ordered a Mensch single-board computer from Western Design Center, the keepers of the 6502 flame. Bill Mensch was on the original 6502 design team and is the force behind the 65C02 and the 65816. His company still supplies the 65C02, 65C816, and a few other chips. One of those is the W65C265, which is a microcontroller based on the 65816. This is not like the Arduino or STM32 blue pill or other microcontrollers in the sense that it has no on board flash. What it does have is an on board machine code monitor and a library of code in ROM that makes accessing the peripherals pretty easy. It has an interesting mix of peripherals, too, including 8 16bit timers, 4 UARTs, and two tone generators that emit digital sine waves. Also quite unlike many microcontrollers, it is set up to easily add off-board RAM. You do kind of need to if you’re doing much, also, because it has only 520 bytes of RAM, about a quarter of which is occupied by the monitor. The board is pretty inexpensive fun at $18 plus shipping and they happily shipped it to me in Ireland. You can find one for yourself on the WDC site.

I started looking around and found that there is actually decent tool support for this board even though not a lot of people seem to be playing with it or documenting it recently. The chip has been around since the early 90’s, though, and the programming manuals for the 65816 and 65C02 all apply so there is a lot of documentation to start from. WDC supplies tools (compilers, assemblers) for the chip but I was unable to get the download link to work from email on their site. I have notified them. In the meantime I started looking for alternatives, and it turns out there are a few good options. I’ll document the route I chose here to get my first program working.

Getting Started

I found a series of blog posts by Mike Kohn talking about getting started with the board. I ended up following along with what he did to make things work. There were a few bumps along the way to get it running on macOS.

First, to get code onto the board you need to be able to upload to the board over serial. Some microcontoller prototyping boards have USB and some have serial interfaces. The Mensch is in the second category. I have had an FTDI cable for a long time so I just hooked that up and got going. If you don’t have one, you’ll want to pick up one of the many options available. Here’s a Sparkfun example an Adafruit example or one from Banggood.

Note that the ground pin in on the left when facing the board, so the FTDI cable goes on upside down. See the photo at the top of this post.

Next, we need a way to get things to the board. A gentleman named Joe Davisson wrote a tool called EasySXB that makes it easy to load code into the Mensch. I was not able to find available binaries for macOS, however. So I ended up pulling the source and then having to patch and upgrade dependencies to get it to compile under clang on macOS. I have opened a PR to get the changes upstreamed, but in the meantime, macOS High Sierra and newer binaries are available on my fork.

A good “Getting Started” page on the WDC site walks you through using this to upload code, so I won’t repeat that here. It works the same on macOS as on Windows once you have the native binaries. Note that when starting EasySXB on the command line, you can supply the port with the --port option which makes it ever so much easier to use since the tool doesn’t support point-and-click to find the serial port. In my case I ran it with:

$ ./easysxb --port /dev/cu.usbserial-FTDOMLSO

Once the UI starts you can use the menus to connect.

Running Some Code

Now we need to write some code (or grab it from somewhere) and assemble it. I started with the hello world blinking LED program from Mike’s post. He and Joe Davisson maintain an assembler that can target the 65816 called naken_asm. I initially tried to use the acme assembler but it uses different syntax than Mike’s code so I took the easy wrote and used naken_asm. It compiles cleanly on macOS and was ready to use in a few seconds.

The code from Mike Kohn’s post doesn’t quite run out of the box on the Mensch. He has been using external memory on his board and therefore the base address in the code is above that available in the base Mensch like I have. I read through the datasheet for the W65C265 and found the cleanest contiguous block of memory available and modified the program to load itself there rather than 0x1000. Line 5 now reads:

.org 0x00B6

This is easily assembled with a single command:

$ naken_asm -h led_blink_65c816.asm

naken_asm

Authors: Michael Kohn
         Joe Davisson
    CPU: 1802, 4004, 6502, 65C816, 68HC08, 6809, 68000, 8048, 8051, 86000,
         ARM, AVR8, Cell BE, Copper, CP1610, dsPIC, Epiphany, Java, LC-3,
         MIPS, MSP430, PIC14, PIC24, PIC32, Playstation 2 EE, PowerPC,
         Propeller, PSoC M8C, RISC-V, SH-4, STM8, SuperFX, SWEET16,
         THUMB, TMS1000, TMS1100, TMS9900, WebAssembly, Xtensa, Z80
    Web: http://www.mikekohn.net/
  Email: mike@mikekohn.net
Version: April 25, 2020

 Input file: led_blink_65c816.asm
Output file: out.hex

Pass 1...
Pass 2...

Program Info:
Include Paths: .
               /usr/local/share/naken_asm/include
               include
 Instructions: 29
   Code Bytes: 64
   Data Bytes: 0
  Low Address: 00b6 (182)
 High Address: 00f5 (245)

This generates an Intel hex format output that is suitable for upload to the Mensch board.

We can now use the menu in EasySXB to upload the program to the board. If the board is not responsive, you may need to hit the reset button before trying again. You can validate that things are working by loading the registers from the monitor with the Get button. Once you’ve successfully uploaded the code, you can enter 0x00B6 into to the Address: field and hit JML (jump long). You should see the LED on P72 begin to blink!

This program really is the most basic thing you could do. I took a little time and enhanced it to manage the PCS7 (chip select) register and the control register to get all 8 of the LEDs flashing in groups of 4, and two external LEDs flashing as well. I added some defines from the datasheet to make it a lot clearer what we’re doing here and to prevent having to remember all the memory addresses.

It took a little bit to figure out that I needed to set the PCS7 register up properly to get all the LEDs working. The datasheet is very complete, however, and with a little head scratching I got it working. This is the first board I’ve ever had with a monitor built in and I found it incredibly helpful here for debugging the program. I was able to manipulate registers by hand in the monitor until I understood all the necessary settings to do what I needed. Very handy!

You can find my improved Hello World in this repo.

Note that if you hook external LEDs, they should be on Port 0 and for best effect you should choose any 2 pins next to each other.

Wrap Up

Hello world is not the most exciting thing in the world, but to get there you have to get the whole toolset working. Now that we have that, we can start to explore more things with the baord. It took the better part of a day for me to make all this work on my MacBook Pro. Hopefully this post saves another retro enthusiast some time.

I’ve got some Cypress SRAM chips now and I’m looking forward to hooking them up to this board.

https://relistan.com/wdc-w65c265-mensch-hello-world
The Kernel Change That May Be Slowing Down Your App
articleslinuxkernelopsgoelixircommunity
A kernel “bug fix” that happened at the end of last year may be killing the performance of your Kubernetes- or Mesos-hosted applications. Here’s how we discovered that it was affecting us and what we did about it at Community.
Show full content

A kernel “bug fix” that happened at the end of last year may be killing the performance of your Kubernetes- or Mesos-hosted applications. Here’s how we discovered that it was affecting us and what we did about it at Community.

Huge Improvement

Bad 90th Percentile

For most of 2019 we were seeing some outlying bad performance across our apps. We run our stack on top of Mesos and Docker. Performance in production seemed worse than when not in production and we are a busy startup and only devoted a bit of time here and there to trying to understand the problem.

In the late summer of 2019 we started to notice that a few of our simplest apps were performing in a noticeably strange way. Both applications should have highly predictable performance, but were seeing response time 90th percentiles that were hugely out of our expectations. We looked into it and while we’re busy ramping up our platform, didn’t take the time to devote to fixing it.

The application we first noticed this with accepts an HTTP request, looks in a Redis cache, and publishes on RabbitMQ. It is written in Elixir, our main app stack. This application’s median response times were somewhere around 7-8ms. It’s 90th percentile was 45-50ms. That is a huge slow down! Appsignal, that we use for Elixir application monitoring, was showing a strange issue where for slow requests, either Redis or RabbitMQ would be slow, and that external call would take almost all of the 45-50ms. Redis and RabbitMQ both deliver very reliable performance until they are under huge, swamping load, so this is a really strange pattern.

We started to look at other applications across our stack in closer detail and found that many of them were seeing the same pattern. It was often just harder to pick out the issue because they were doing more complex operations and had less predictable behavior.

One of those applications accepts a request, talks to Redis, and returns a response. Its median response times were sub-millisecond. We were seeing 90th percentile response times around… 45-50ms! Numbers semm familiar? That application was written in Go.

For those not familiar with how response time percentiles work: a bad 90th percentile means 1 in 10 requests is getting terrible performance. Even having 5% of our requests getting bad performance is completely unacceptable. For complex applications it seemed to affect us less, but we rely on low latency from a couple of apps and it was hurting us.

Digging In

We use Appsignal for monitoring our Elixir applications and New Relic for monitoring Go and Python apps. Our main stack is Elixir, and the first app we saw the issue with was in Elixir, so Appsignal is where most of the troubleshooting happened. We started by looking at our own settings that might be affecting applications. We weren’t doing anything crazy and I was co-troubleshooting at this point was Andrea Leopardi, a member of our team and an Elixir core team member. He and I evaluated the application side and couldn’t find anything wrong. We then started to look at all the underlying components that could be affecting it: network, individual hosts, load balancers, etc and eliminating them one-by-one.

We isolated the application in our dev environment (just like prod, but no load) and gave it an extremely low, but predictable throughput of 1 request per second. Amazingly, we could still see the 90th percentile as a huge outlier. To eliminate any network considerations, we generated the load from the same host. Same behavior! At this point I started to think it was probably a kernel issue but kernel issues are pretty rare in situations like this with basically no load.

Kernel issue

Andrea and I talked through all the issues and decided we had better look at Docker settings as a culprit. We decided to turn off all CPU and memory limits and deploy the application to our dev environment again. Keep in mind there is no load on this application. It is seeing 1 request per second in this synthetic environment. Deployed without limits, it suddenly behaved as expected! To prove that it was CPU limits, my hunch, we re-enabled memory limits, re-deployed, ran the same scenario and we were back to bad performance. The chart at right shows Appsignal sampling the slowest transactions each minute. This is really the max outlier rather than the 90th but we ought to be able to improve that more easily. You can see in the output that without limits (green) it performed fine and with limits (red) it was a mess. Remember, there is basically no load here so the CPU limits shouldn’t much change app performance if they are in place.

We then thought there might be an interaction between the BEAM scheduler (Erlang VM that Elixir runs on) and CPU limits. We tried various BEAM settings with the CPU limits enabled and got little reward for our efforts. We run all of our apps under a custom Mesos executor that I co-wrote with co-workers at Nitro over the last few years before joining Community. With our executor it was easy to switch our enforcement from the Linux Completely Fair Scheduler enforcement that works best for most service workloads, to the older CPU shares style. This would be a compromise position to let us run some applications in production with better performance without turning off limits entirely. Not great, but a start, if it worked. I did that and we measured performance again. Even ramping the throughput up slightly to 5 requests per second, the application performed as expected. The following chart shows all this experimentation:

All of our experiments

Jackpot

Moving beyond our Elixir core stack, we discovered that we were seeing the same behavior in a Go application and a Python app as well. The Python app’s New Relic chart is the one at the start of this article. Once Andrea and I realized it was affecting non-Elixir apps and was in no way an interaction specific to the BEAM, I started looking for other reports on the Internet of issues with Completely Fair Scheduler CPU limits.

Jackpot! After a bit of work, I came across this issue on the kernel mailing list. Take a quick second to read the opening two paragraphs of that issue. What is happening is that when you have apps that aren’t completely CPU-bound, when you have CPU limits applied, the kernel is effectively penalizing you for CPU time you did not use, as if you were a busy application. In highly threaded environments, this leads to thread starvation for certain workloads. The key here is that the issue says this only affects non-CPU-bound workloads. We found that in practice, it’s really affecting all of our workloads. Contrary to my expectations that it would affect Go and BEAM schedulers the worst, in fact, one of the most affected workloads was a Python webapp.

The other detail that might not be clear from first read of that Kernel issue is that the behavior that is killing our performance is how the kernel was supposed to work originally. But in 2014, a patch was applied that effectively disabled the slice expiration. It has been broken (according to the design) for 4.5 years. Everything was good until that “bug” was fixed and the original, intended behavior was unblocked. The recent work to fix this issue involves actually returning to the previous status quo by removing the expiration “feature” entirely.

If you run on K8s or Mesos, or another platform that uses the Linux CFS CPU limits, you are almost certainly getting affected by this issue as well. At least for all the blends of Linux I looked at, and unless your kernel is more than about a year old.

Fixing It

So, what to do about it? We run Ubuntu 16.04 LTS and looking at the available kernels on the LTS stream, there was nothing that included the fix. This was a month ago. To get a kernel that had the right patches, Dan Selans and I had to enable the proposed package stream for Ubuntu and upgrade to the latest proposed kernel. This is not a small jump and you should consider carefully if this will be the right thing to do on your platform. In our case we found over the last month that this has been a very reliable update. And most importantly, it fixed the performance issue! Things may have changed in the intervening period and this patch may be back-ported to the LTS stream. I did not look into patching for other distributions.

What we’ve seen is a pretty dramatic improvement in a number of applications. I think that the description the kernel issue under sells the effect. At least on the various workloads in our system. Here are some more charts, this time from New Relic:

Patching the system, one application’s view: Kernel Patching

Same application, before and after: Before and After

The most dramatically affected: Dramatic improvement

Wrap Up

Is this affecting your apps? Maybe. Is it worth fixing? Maybe. For us both of those are definitely true. You should at least look into it. We’ve seen very noticeable improvements in latency, but also in throughput for the same amount of CPU for certain applications. It has stabilized throughput and latency in a few parts of the system that were a lot less predictable before. Applying the proposed stream to our production boxes and getting all of our environments patched was a big step, but it has paid off. We at Community all hope this article helps someone else!

https://relistan.com/the-kernel-may-be-slowing-down-your-app
Dynamic Nginx Router… in Go!
articlesgoprogrammingnginxhttp
Show full content

Nginx logo

We needed a specialized load balancer at Nitro. After some study, Mihai Todor and I built a solution that leverages Nginx, the Redis protocol, and a Go-based request router where Nginx does all the heavy lifting and the router carries no traffic itself. This solution has worked great in production for the last year. Here’s what we did and why we did it.

Why?

The new service we were building would be behind a pool of load balancers and was going to do some expensive calculations—and therefore do some local caching. To optimize for the cache, we wanted to try to send requests for the same resources to the same host if it were available.

There are a number of off-the-shelf ways to solve this problem. A non-exhaustive list of possibilities includes:

Go Gopher
Go Gopher by Renee French.

  • Using cookies to maintain session stickiness
  • Using a header to do the same
  • Stickiness based on source IP
  • HTTP Redirects to the correct instace

This service will be hit several times per page load and so HTTP redirects are not viable for performance reasons. The rest of those solutions all work well if all the inbound requests are passing through the same load balancer. If, on the other hand, your frontend is a pool of load balancers, you need to be able to either share state between them or implement more sophisticated routing logic. We weren’t interested in the design changes needed to share state between load balancers at the moment and so opted for more sophisticated routing logic for this service.

Our Architecture

It probably helps to understand our motiviation a little better to understand a bit about our architecture.

We have a pool of frontend load balancers and instances of the service are deployed on Mesos so they may come and go depending on scale and resource availability. Getting a list of hosts and ports into the load balancer is not an issue, that’s already core to our platform.

Because everything is running on Mesos, and we have a simple way to define and deploy services, adding any new service is a trivial task.

On top of Mesos, we run gossip-based Sidecar everywhere to manage service discovery. Our frontend load balancers are Lyft’s Envoy backed by Sidecar’s Envoy integration. For most services that is enough. The Envoy hosts run on dedicated instances but the services all move between hosts as needed, directed by Mesos and the Singularity scheduler.

The Mesos nodes for the service under consideration here would have disks for local caching.

Design

Looking at the problem we decided we really wanted a consistent hash ring. We could have nodes come and go as needed and only the requests being served by those nodes would be re-routed. All the remaining nodes would continue to serve any open sessions. We could easily back the consistent hash ring with data from Sidecar (you could substitute Mesos or K8s here). Sidecar health checks nodes and so we could rely on nodes being available if they are alive in Sidecar.

We needed to then somehow bolt the consistent hash to something that could direct traffic to the right node. It would need to receive each request, identify the resource in question, and then pass the request to the exact instance of the service that was prepped to handle that resource.

Of course, the resource identification is easily handled by a URL and any load balancer can take those apart to handle simple routing. So we just needed to tie that to the consistent hash and we’d have a solution.

You could do this in Lua in Nginx, possibly in HAproxy with Lua as well. No one at Nitro is a Lua expert and libraries to implement the pieces we needed were not obviously available. Ideally the routing logic would be in Go, which is already a critical language in our stack and well supported.

Nginx has a rich ecosystem, though, and a little thinking outside the box turned up a couple of interesting Nginx plugins, however. The first of these is the nginx-eval-module by Valery Kholodkov. This allows you to make a call from Nginx to an endpoint and then evaluate the result into an Nginx variable. Among other possible uses, the significance of that for us is that it allows you to dynamically decide which endpoint should receive a proxy-pass. That’s what we wanted to do. You make a call from Nginx to somewhere, you get a result, and then your make a routing decision based on that value.

You could implement the recipient of that request with an HTTP service that returns only a string with the hostname and port of the destination service endpoint. That service would maintain the consistent hash and then tell Nginx where to route the traffic for each request. But making a separate HTTP request, even if were always contained on the same node, is a bit heavy. The whole expected body of the reply would be something like the string 10.10.10.5:23453. With HTTP, we’d be passing headers in both directions that would vastly exceed the size of the response.

So I started to look at other protocols supported by Nginx. Memcache protocol and Redis protocol are both supported. Of those, the best supported from a Go service is Redis. So that was where we turned.

There are two Redis modules for Nginx. One of them is suitable for use with the nginx-eval-module. The best Go library for Redis is Redeo. It implements a really simple handler mechanism much like the stdlib http package. Any Redis procotol command will invoke a handler function, and they are really simple to write. Alas, it only supports a newer Redis protocol than the Nginx plugin can handle. So, I dusted off my C skills and patched the Nginx plugin to use the newest Redis protocol encoding.

So the solution we ended up with is:

 [Internet] -> [Envoy] -> [Nginx] -(2)--> [Service endpoint]
                             \
                          (1) \ (redis proto)
                               \
                                -> [Go router]

The call comes in from the Internet, hits an Envoy node, then an Nginx node. The Nginx node (1) asks the router where to send it, and then (2) Nginx passes the request to the endpoint.

Implementation

We built a library in Go to manage our consistent hash backed by Sidecar or by Hashicorp’s Memberlist library. We called that library Ringman. We then bolted that libary into a service which serves Redis protocol requests via Redeo.

Only two Redis commands are required: GET and SELECT. We chose to implement a few more commands for debugging purposes, including INFO which can reply with any server state you’d like. Of the two required commands, we can safely ignore SELECT, which is for selecting the Redis DB to use for any subsequent calls. We just accept it and do nothing.GET, which does all the work, was easy to implement. Here’s the entire function to serve the Ringman endpoint over Redis with Redeo. Nginx passes the URL it received, and we return the endpoint from the hash ring.

srv.HandleFunc("get", func(out *redeo.Responder, req *redeo.Request) error {
	if len(req.Args) != 1 {
		return req.WrongNumberOfArgs()
	}
	node, err := ringman.GetNode(req.Args[0])
	if err != nil {
		log.Errorf("Error fetching key '%s': %s", req.Args[0], err)
		return err
	}

	out.WriteString(node)
	return nil
})

That is called by Nginx using the following config:

# NGiNX configuration for Go router proxy.
# Relies on the ngx_http_redis, nginx-eval modules,
# and http_stub_status modules.

error_log /dev/stderr;
pid       /tmp/nginx.pid;
daemon    off;

worker_processes 1;

events {
  worker_connections  1024;
}

http {
  access_log   /dev/stdout;

  include     mime.types;
  default_type  application/octet-stream;

  sendfile       off;
  keepalive_timeout  65;

  upstream redis_servers {
    keepalive 10;

    # Local (on-box) instance of our Go router
    server services.nitro.us:10109;
  }

  server {
    listen      8010;
    server_name localhost;

    resolver 127.0.0.1;

    # Grab the filename/path and then rewrite to /proxy. Can't do the
    # eval in this block because it can't handle a regex path.
    location ~* /documents/(.*) {
      set $key $1;

      rewrite ^ /proxy;
    }

    # Take the $key we set, do the Redis lookup and then set
    # $target_host as the return value. Finally, proxy_pass
    # to the URL formed from the pieces.
    location /proxy {
      eval $target_host {
        set $redis_key $key;
        redis_pass redis_servers;
      }

      #add_header "X-Debug-Proxy" "$uri -- $key -- $target_host";

      proxy_pass "http://$target_host/documents/$key?$args";
    }

    # Used to health check the service and to report basic statistics
    # on the current load of the proxy service.
    location ~ ^/(status|health)$ {
      stub_status on;
      access_log  off;
      allow 10.0.0.0/8;    # Allow anyone on private network
      allow 172.16.0.0/12; # Allow anyone on Docker bridge network
      allow 127.0.0.0/8;   # Allow localhost
      deny all;
    }

    error_page   500 502 503 504  /50x.html;
    location = /50x.html {
      root   html;
    }
  }
}

We deploy Nginx and the router in containers and they run on the same hosts so we have a very low call overhead between them.

We build Nginx like this:

./configure --add-module=plugins/nginx-eval-module \
      --add-module=plugins/ngx_http_redis \
      --with-cpu-opt=generic \
      --with-http_stub_status_module \
      --with-cc-opt="-static -static-libgcc" \
      --with-ld-opt="-static" \
      --with-cpu-opt=generic

make -j8
Performance

We’ve tested the performance of this extensively and in our environment we see about 0.2-0.3ms response times on average for a round trip from Nginx to the Go router over Redis protocol. Since the median response time from the upstream service is about 70ms, this is a negligeable delay.

A more complex Nginx config might be able to do more sophisticated error handling. Reliability after a year in service is extremly good and performance has been constant.

Wrap-Up

If you have a similar need, you can re-use most of the components. Just follow the links above to actual source code. If you are interested in adding support for K8s or Mesos directly to Ringman, that would be welcome.

This solution started out sounding a bit like a hack and in the end has been a great addition to our infrastructure. Hopefully it helps someone else solve a similar problem.

https://relistan.com/dynamic-nginx-router-in-go