
Who was the greatest F1 driver of all time? It is an endlessly debated question amongst fans and pundits alike. If the only aspect we care about is the number of titles or grand prix wins, then the answer is straightforward. Yet, as F1 fans, we recognize that the question is far more complicated.
F1 is a team sport. As far as team performance goes, the driver is a relatively small contributor. To put it another way, F1 is not a level playing ground for drivers. Some of the most talented drivers in the sport’s history won no titles, simply because they never raced in a sufficiently competitive car. If our objective is to rate driver performances, then we need to somehow make allowances or corrections for a driver’s car competitiveness. Most subjective ranking lists already do this to some degree. Witness the fact that Stirling Moss (no world titles) is often placed near the top of such lists. However, subjective rankings are prone to bias and dependent on each individual’s subjective mental model, shaped by the races they have or have not seen or analyzed.
An alternative approach to driver rankings has developed over the past several years. This approach is to use an objective statistical model to attempt to separate driver performance from car performance and other key factors. One advantage of such an approach is that the results, and how they depend on the model itself, can be directly scrutinized. Another advantage is that models can be used to identify and challenge subjective narratives that do not really have any basis in fact.
Five years ago, I used such a model to generate a top 60 all-time ranking list, which remains the second most viewed article on this blog, behind only my post explaining the rules of racing. The model I used at that time was fairly simplistic, accounting for only driver performance, team performance, and competition with other drivers in the same season. There were fairly obvious steps available to improving the model, including the incorporation of age and experience effects, although the implementation was not altogether straigtforward. Having made a series of upgrades to the model over the past 5 years, I feel it is time for a major update to the all-time rankings. This time, it is a top 100.
I know this has been a highly anticipated and requested post. I hope I have done it justice.
THE MODEL

The statistical model used for generating driver rankings has been described in some detail in a recent post, where I documented the latest upgrades.
To briefly summarize, the outcome that the model attempts to predict is a driver’s scoring rate in each season (points per race, or ppr for short) in their counting races. A counting race is defined as any race in which a driver did not experience a non-driver DNF (e.g., a mechanical DNF or a DSQ on mechanical grounds). Counting races include races where a driver finished, as well as races where a driver had a DNF for other reasons (e.g., they crashed, they gave up, or they had a DSQ on driver-conduct grounds).
To allow comparisons across eras, a uniform scoring system is applied, which has a similar shape to the current 25-18-15-12-10-… system, but extends (exponentially decaying) beyond 10th place to allow performance differences between lower performing cars to be easily discriminated. The scoring rate outcome variable is linked to the model’s performance variable via an S-shaped (sigmoidal) function. This is necessary because there are maximum and minimum possible scoring rates, so a linear model would not suffice.

Schematic representation of the updated f1metrics model. The performance model is a function of several predictors: Driver performance, Team performance, Customer car status (1950-1980), Season, Driver Age, and Driver Experience. Performance is converted to scoring rate in points per counting race (ppr) on a standardized scale of 0-10 using a sigmoid function. The model parameters are fit to data from 1950-2019. Only ‘counting races’ (i.e., excluding non-driver DNFs, such as mechanical DNFs) contribute to the calculated season scoring rate for each driver.
A number of predictors go into the model. First, a performance level specific to the individual driver. Second, a team performance level specific to the chassis-engine-year combination. Third, a factor that represents the effect on performance of having a customer car (relevant pre-1980 when customer cars were allowed). Fourth, a season specific factor, representing the relative difficulty of scoring in a given season. And finally, driver-specific age and experience effects.
Each of these factors in the model are fitted by applying the model to all of the race result data from 1950-2019. As I had to choose a cut-off point for running the model to write this post, I chose Japan 2019. I will continue annually updating the ratings as they evolve in future posts.
Experience-related performance effects are found to be most pronounced in a driver’s first two seasons, leveling out quickly from there. Age-related performance effects are found to mostly affect drivers below the age of 25 and after the age of 35, steeply declining after age 38.

The model’s experience and age effects on performance, derived by fitting the model against all race result data from 1950-2019.
As with any model, it is important to be aware of the underlying assumptions so that the results can be appropriately interpreted. I will note a couple of key properties. First, there is no attempt in the model to attribute blame in collisions. Second, there is no attempt to correct or adjust for results where a driver’s race was affected by mechanical issues (e.g., a long pit-stop or a damaged floor). Handling either case would require subjective judgments, and furthermore would not be possible in many historical cases where we lack footage or even descriptions of many incidents.
With this model in hand, there are many potential applications. One thing we can do is determine each driver’s performance level in each season after adjusting for their team performance. In other words, how might a driver have performed if their machinery had been equally competitive to all other drivers in the same season? And furthermore, if we also adjust for season, what are the relative levels of performance of drivers between eras? These calculations are the basis for the driver rankings presented below.
TOP DRIVERS BY ERA
Before we get to the top 100, I think it is very informative to look at top driver performances within eras. While the f1metrics model is constructed to be able to compare performances across eras, via the chain of teammate links that span 1950-2019, we need to remember that the model is comparing abilities in a relative sense. It can’t directly tell us how Fangio would perform in a 2019 car, due to the different requirements of racing between those eras. We can only speculate as to how well abilities would translate as the discipline has evolved.
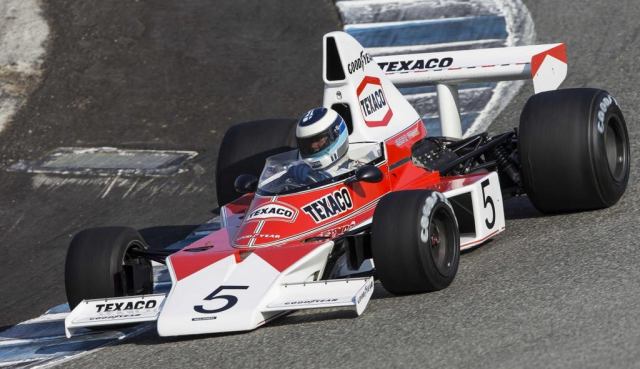
Mika Häkkinen driving a McLaren M23
When we observe systematic changes in ability between eras, it is not entirely clear what to attribute this to, whether it be better training, a larger talent pool, or other factors not explicitly represented within the model. Some readers will therefore be more comfortable looking at driver rankings within eras rather than across eras. The rankings generated within-eras are also more digestible.
For this analysis, I asked who were the best performing drivers within each decade of the sport. Note that the model is still using all of the data from 1950-2019 to generate these estimates, we are just looking at outputs within a restricted time window. For these rankings, I used each driver’s strongest consecutive 2-year performance interval from each decade. I used 2 years here (rather than 3 years, which is the primary measure for the all-time top 100 list below) to better handle cases where a driver’s best years happened to overlap the beginning/end of a decade. For a year to be counted in the 2-year performance interval, I required that the driver have at least 2 counting races in the season (again, for high inclusivity).

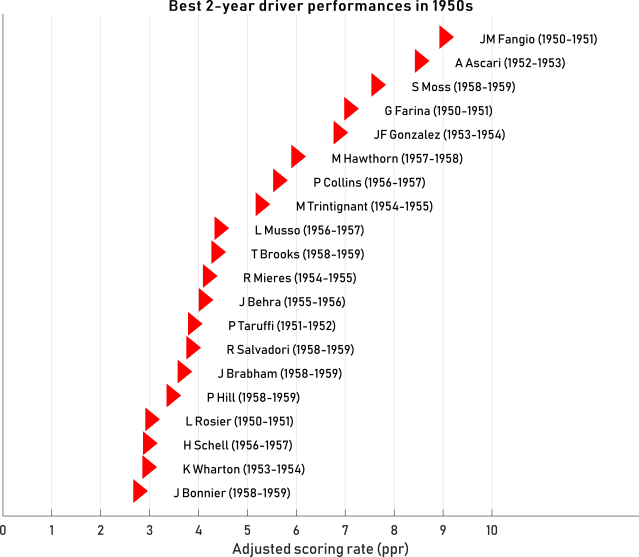
Two drivers stand clearly ahead of their peers in the 1950s. They are 5-time champion Juan Manuel Fangio and 2-time champion Alberto Ascari. Both were extremely dominant over their teammates, with Fangio only outqualified 12% of the time and Ascari 27% of the time by a teammate. Both drivers also held a strong positive head-to-head record as teammates to the 1950-champion, Giuseppe Farina. Fangio beat Farina 5-1 in counting races and 11-2 in qualifying. Ascari beat Farina 11-2 in counting races and 13-2 in qualifying.
Stirling Moss, not yet at the full height of his powers, and serving an understudy role to Fangio at Mercedes in the mid-1950s, is ranked the 3rd strongest performing driver of the decade. Giuseppe Farina and the largely underrated José Froilán González are ranked 4th and 5th, respectively. The only other driver in this era with a performance rating >6 ppr is the 1958 champion Mike Hawthorn.


As we move into the 1960s, three giants of motorsports clearly stand out. They are, respectively, Jim Clark, Jackie Stewart, and Stirling Moss. Temporally, their peaks did not really overlap due to tragic circumstances. Moss was at his absolute best in the early 1960s, when his F1 career was abruptly cut short at age 31 by a crash resulting in a severe head injury and a subsequent month-long coma. Jim Clark, who debuted in 1960, was at his peak in the early-to-mid 1960s. His career ought to have overlapped to a much greater degree with Stewart’s, but Clark died aged 32 in a 1968 Formula 2 race. Stewart’s own peak performances only began to emerge near the end of the decade, continuing into the 1970s.
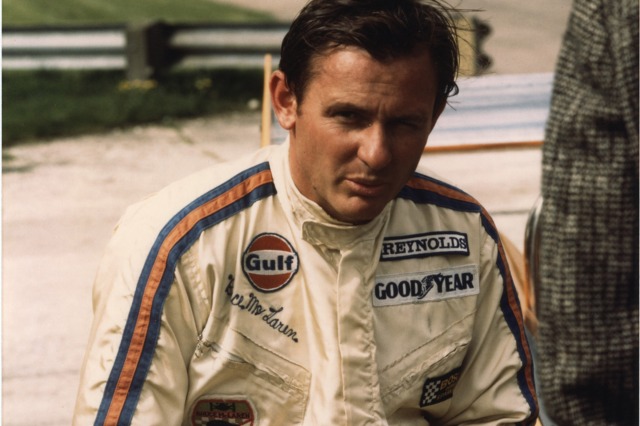
Behind these three drivers is a cast of four closely matched drivers with extraordinary legacies, all with performance ratings >6 ppr. They are World Drivers’ Champions Graham Hill (2-time champion) and Jochen Rindt (1-time champion), as well as famous car constructors Dan Gurney and Bruce McLaren. Just behind this group are rated Jack Brabham (3-time champion and the only constructor-driver champion in F1 history), John Surtees (1-time champion and 4-time 500cc champion), Denny Hulme (1-time champion), and sports car legend Jacky Ickx (6-time Le Mans winner). This is a group of drivers known as much for their driving skills in F1 as for their contributions outside of racing or success across disciplines.
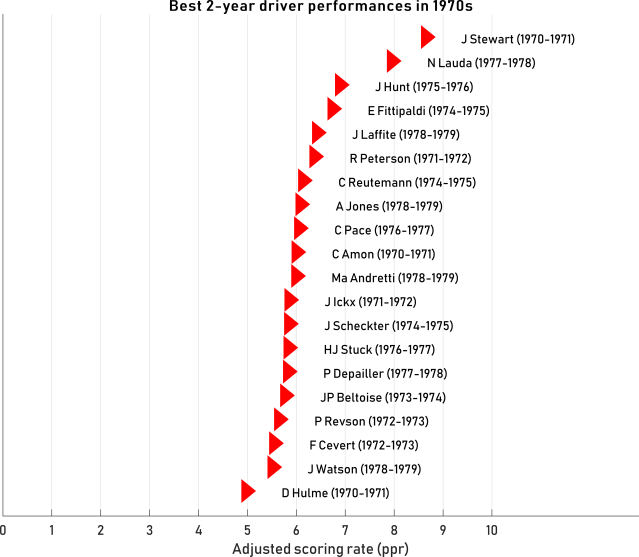
Jackie Stewart is rated the clear best driver of the 1970s, though Niki Lauda is not too far behind in 2nd place. Jochen Rindt sadly misses out due to the 2-year criterion; his 1970 performance, with a perfect win-rate in counting races, remains one of the model’s all-time top single-year performances.
The 1970s is an era of much sharper competition than the 1960s, with 15 drivers having performance ratings >6 ppr. James Hunt and Emerson Fittipaldi are rated closely as 3rd and 4th best of the era. Hunt, who was formerly the model’s 2nd ranked driver of the 1970s, ahead of Lauda, has moved down to 3rd place with the latest updates to the model. This is a result I explore in greater detail in his top 100 entry below.


We would naturally expect the 1980s to be a two-horse race between Alain Prost and Ayrton Senna. As the model sees it, Prost was the stronger performer of the pair in this period, while Senna was the stronger performer in the early 1990s. Prost’s 2-year peak spans his very strong 1985 and 1986 campaigns. Senna’s 2-year peak in the 1980s interestingly encompasses the same period. This can be attributed to the model giving 1988 to Prost, as he significantly outscored Senna on total points — debates can rage on about whether Senna might have driven differently under a different scoring system.
Behind Senna are four closely matched drivers. They are Keke Rosberg (1-time champion), Elio de Angelis (teammate to Nigel Mansell and Ayrton Senna), Jacques Laffite, and Nelson Piquet (3-time champion). de Angelis was ranked highly by the original f1metrics model on the back of his superior results against Mansell and his credible results against Senna; little has changed here. Laffite is ranked much higher once age and experience effects are taken into account. This is explained in his entry in the top 100 below.
Three other drivers of the 1980s have performance ratings >6 ppr. They are John Watson, Nigel Mansell, and Eddie Cheever. Among these three drivers, John Watson’s ranking is the most notable change from the original f1metrics model, which can be explained by the model now taking Niki Lauda’s comeback status and Alain Prost’s rookie status into account during times when they were Watson’s teammate.
Niki Lauda features as the 10th best performer of the 1980s. His comeback and clever campaign to take the 1984 title remains one of the greatest achievements in F1 history. Nonetheless, the model recognizes that he was probably past his best at this stage of his career. Alan Jones, the 1980 champion, is rated lower than he was in the original f1metrics model rankings, largely because his peak straddles 1979-1980.
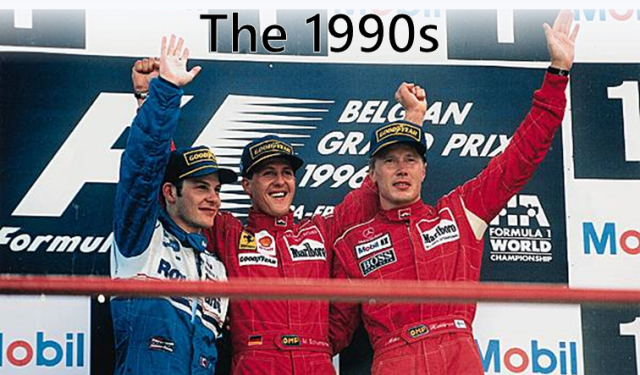

In the 1990s, Michael Schumacher stands alone at the top. The gap between his performance level and that of his peers is the most striking in F1 history. The next highest rated performances in the 1990s are those of Ayrton Senna and Alain Prost, who competed early in the decade, before Schumacher had reached his peak.
After that, the model sees a closely matched set of drivers. Rubens Barrichello and Eddie Irvine — drivers who were perhaps not given enough credit due to the enormity of the challenge from their teammate, Schumacher — and Heinz-Harald Frentzen, a driver who challenged Schumacher in other categories, but never quite reached his level in F1. Other champions of the 1990s appear next — Jacques Villeneuve, Nigel Mansell, Mika Häkkinen, and a few places further down is Damon Hill — all of whom won titles in dominant equipment.
The three other drivers of the 1990s with performance ratings >6 ppr are each stories of unfulfilled potential. Jean Alesi, who could in different circumstances have challenged for titles at Williams. Stefano Modena, who was brilliantly quick, but highly temperamental. And Mika Salo, who only got to cameo at Ferrari as Schumacher recovered from his 1999 injury, giving up his only chance at a race win to help Eddie Irvine’s title challenge.
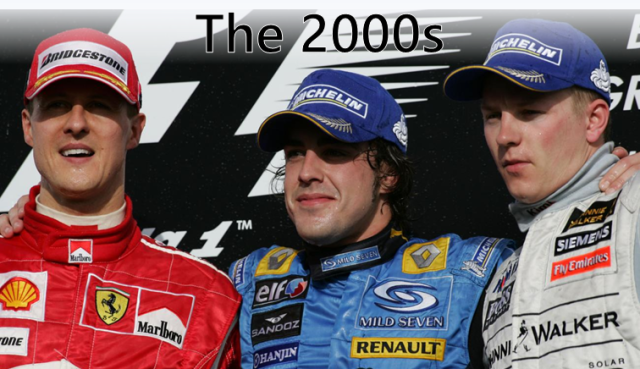
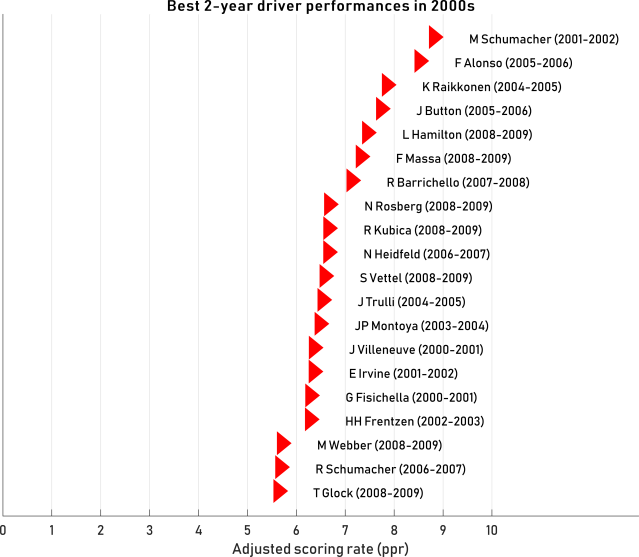
By the 2000s, the level of driving in F1 had improved as training methods became far more systematic and drivers began to adopt a fully professional approach. While there remained some very weak pay-drivers on the grid, there were 17 drivers in this decade with a performance rating >6 ppr, and 26 below this rating, meaning 40% were above the threshold.
Michael Schumacher is rated the top driver of the decade, but with a younger generation now in hot pursuit. Fernando Alonso is close behind in 2nd.
Kimi Räikkönen, though not at Schumacher or Alonso’s level, stands a clear 3rd in this era. By the model’s reckoning, Räikkönen did not capture this level again, which is explored in his driver entry in the top 100 below. Jenson Button slots in just behind Räikkönen, on the back of his impressive but largely unrewarded performances for Honda. He was somewhat a champion of circumstance for Brawn in 2009, but it was a deserved result given his abilities. Lewis Hamilton was not yet performing at his peak in this decade, being only in his third season by 2009, and having one of his weaker seasons in 2008. Despite this, he is already ranked 5th best of the decade.

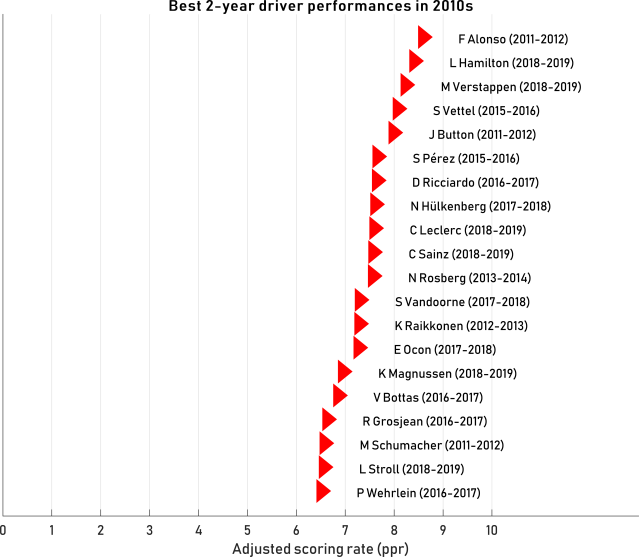
With fewer seats available due to teams folding, and with increasingly strict standards for F1 drivers (including stricter limits on superlicenses), the quality of the F1 grid reached an unprecedented level in the past decade. A total of 30 drivers in the 2010s have a performance rating >6 ppr, compared with 15 who do not, meaning 67% were above this threshold. This systematically rising (and compressing) level of driver quality is explored in more detail below.
Within this exceptional cohort, two drivers are ranked clearly at the top of the era: Fernando Alonso and Lewis Hamilton. Ranked 3rd is currently Max Verstappen, on the strength of his excellent 2018-2019 performances. Sebastian Vettel is ranked 4th, on account of not having ever strung two extremely strong seasons together consecutively for a 2-year peak. Combining any two of his 2011, 2013, 2015, or 2017 performances would elevate him to 3rd. Jenson Button rounds out the top 5 of the decade, just ahead of a closely matched throng of six drivers.
THE ALL-TIME TOP 100

Last time I made an all-time driver ranking list, I presented the top 60 drivers. I thought it would be better to expand it to the top 100 drivers this time around, given there was considerable interest in seeing lower ranked drivers.
One of the most obvious changes that we observe with the updated model is a preference shift towards modern drivers.
Of the top 30 drivers in the list, 11 were actively racing in 2019. This shift is apparent from the above ratings by era.
Whereas only six drivers in the 1950s had a performance rating >6 ppr, all of the top 20 drivers in the 2010s exceeded this threshold. While there were individual, very strong performers in earlier eras, the depth of the field was much weaker.
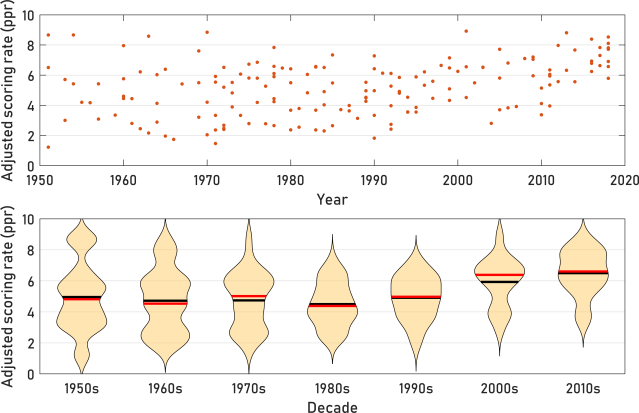
The evolving abilities of F1 drivers. Each dot in the top graph represents the 3-year peak of a single driver. The bottom graph shows the distribution of peak performances within each decade as violin plots. Note the progressive loss of the lower tail over time.
I think this finding should probably come as no great surprise in a model that correctly incorporates the roles of age and experience. The quality of training for drivers today is simply unlike that of their predecessors. At the age that Max Verstappen debuted in F1, having already trained for a decade in go-karts and honing his craft using telemetry, simracing, and other modern training tools, luminaries such as Jim Clark, Juan Manuel Fangio, and Jackie Stewart were yet to even start any type of amateur racing. While we could try to speculate how Fangio or Stewart might have performed had they been given a go-kart at age 4, answering that question is not the goal of this exercise, nor something that the model is yet capable of predicting (since pre-F1 experience is not a predictive factor in the model).
Many of the drivers of the 1950s were aged over 40, some returning from substantial career gaps. While the top drivers of that era were undoubtedly extraordinary talents, the drop off in quality of the field was clearly much steeper.

Age of drivers in the year of their championship debut. This plot uses all drivers in the f1metrics database, which requires that they completed at least 3 counting races in a single season. Darker dots represent multiple overlapping drivers.
What this means is that even the worst drivers on the grid today are comparable to drivers who we would have considered quite strong in previous eras. Given a time machine, could drivers such as Sainz and Pérez keep pace with Senna or Prost? The model answers ‘probably yes’, as we will see in the top 100 list below.
In each driver’s profile, I have included a graphic like the example for Rubens Barrichello below.

The top half of this graphic shows the driver’s estimated performance level in each season, on the normalized 0-10 scale of points per race (ppr), with the color of the line corresponding to the ppr level. For seasons where the driver completed the minimum required counting races, their ranking relative to other drivers in the same season is also displayed.
The bottom half of this graphic shows the driver’s teammate connections, revealing an approximation of how the model sees each teammate connection. Connections are shown with at least 2 counting races in the same car together. Although the model uses all the historical data, drivers are only illustrated as teammates here if they had the same chassis-engine and the same customer/non-customer status (i.e., both works or both customers). The thickness of the line is scaled by the number of races together.
The color of the teammate connection indicates the drivers’ relative performances in their seasons together, as a weighted average if they had multiple seasons together. Blue indicates that the profiled driver outperformed their teammate, gray indicates that it was close to equal, red indicates that they were outperformed by their teammate. Note that these comparisons consider each driver’s full performance in the given car that season (i.e., it may include races which only one of the drivers started, under the assumption that car performance is relatively constant across a season). The driver’s career circulates clockwise, beginning and ending at 12’o’clock.
In each driver’s entry, I have also reported some head-to-head results relative to teammates, including results in counting races (excluding non-driver DNFs for either driver, such as mechanical failures or technical disqualifications), qualifying, and points.
So, let’s start the list!

100. Chico Serra
(4.83 ppr, 1981-1983)

Before Ayrton Senna, there was Chico Serra, a Brazilian multiple-time karting champion who won British Formula Ford, followed by the British F3 title, then was promoted to F1. Unlike Senna, Serra never really caught a break in F1, spending his two full seasons at the hopelessly uncompetitive Fittipaldi team, where even teammate Keke Rosberg struggled to qualify the car. Serra was clearly outpaced by the more experienced Rosberg, scoring 1-1 in counting races but 0-14 in qualifying against the future champion.
99. Clay Regazzoni
(4.83 ppr, 1972-1974)

Clay Regazzoni raced against an impressive cast of teammates, including three champions (Mario Andretti, Niki Lauda, and Alan Jones) and one near-champion (Jacky Ickx). Regazzoni was quick enough to challenge Andretti, outqualifying him 4-1 but trailing 0-3 in counting races. During their first season as teammates (Lauda’s second full F1 season), Regazzoni beat Lauda 3-2 in counting races and 8-5 in qualifying. Once Lauda found his feet in F1, Regazzoni was outclassed: across the following three seasons, Regazzoni was beaten 6-15 in counting races and 3-40 in qualifying. It was a similar story against Jones, as Regazzoni was beaten 1-6 in counting races and 0-15 in qualifying, although by this time Regazzoni was turning 40. His F1 career was sadly ended by serious injuries after a brake failure at Long Beach the following year.
98. Érik Comas
(4.92 ppr, 1992-1994)

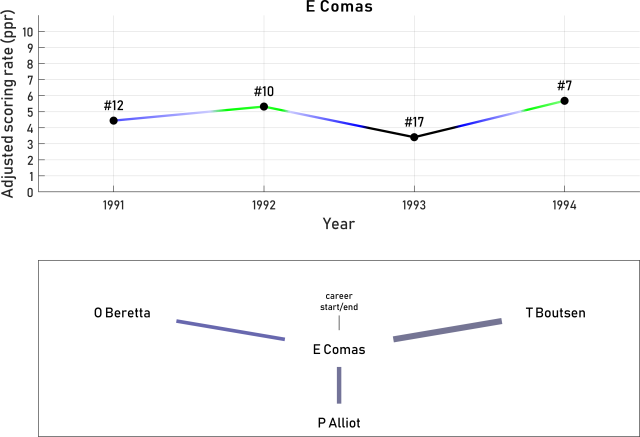
Érik Comas was a highly promising junior single-seater driver. After winning the French Formula Renault and F3 titles, he graduated to F3000, losing the title on count-back to Jean Alesi in his rookie season and easily winning the title the following year. In 1991, he debuted for Ligier in F1, where he raced for two seasons alongside the more experienced Thierry Boutsen. Although beaten 9-23 in qualifying by Boutsen, he was ahead 10-2 in counting races and 4-2 in points. The teammates collided twice in 1992, souring the relationship.
A move to Larrousse in 1993 brought no better results. In an extremely unreliable car, Comas faced teammate Philippe Alliot (ranked 144th) for 1993 and one race in 1994, scoring 6-9 in qualifying, 2-2 in counting races, and 1-2 in points. Comas spent most of 1994 alongside the rookie Olivier Beretta (no ranking), outperforming him 3-1 in counting races, 10-0 in qualifying, and 2-0 in points. No F1 seat was forthcoming for 1995, meaning Comas moved to endurance racing.
97. Michele Alboreto
(4.93 ppr, 1983-1985)

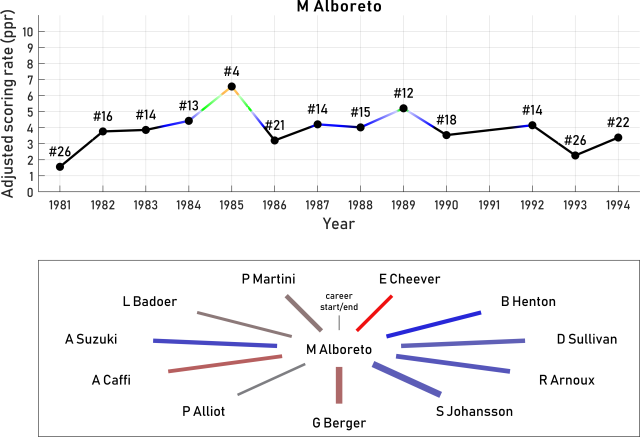
Michele Alboreto’s crowning achievement was undoubtedly his 1985 season, where he challenged Alain Prost for the title until poor reliability ended the campaign.
As a rookie, Alboreto was soundly beaten by his more experienced teammate Eddie Cheever 4-8 in qualifying, 0-3 in counting races, and 0-10 in points. Results improved over the following two years, culminating with a Ferrari seat alongside Rene Arnoux (ranked 130th) for 1984.
Critically, after arriving at Ferrari, Alboreto established his reputation by beating Arnoux 6-2 in counting races, 14-3 in qualifying, and 33.5-30 in points. With Arnoux displaced from the team in early 1985, Alboreto became the de-facto team leader, right as Ferrari produced a potential championship challenger, allowing Alboreto his most successful season. Over 1985-1986, he beat teammate Stefan Johansson (ranked 129th) 9-4 in counting races, 24-7 in qualifying, and 61-49 in points.
Subsequent results for Alboreto were very mixed. Against Gerhard Berger at Ferrari across 1987-1988, he was heavily beaten 3-10 in counting races, 4-28 in qualifying, and 41-77 in points, ending Alboreto’s relationship with the team. After Frank Williams reneged on a Williams offer for 1989, Alboreto spent the rest of his career in lower midfield and backmarker cars.
96. Thierry Boutsen
(4.97 ppr, 1988-1990)
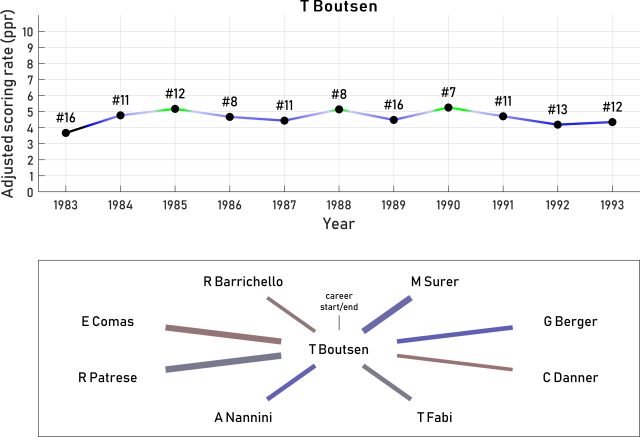
Thierry Boutsen was a reliable and quick driver who occasionally starred in the 1980s and early 1990s, most notably at Benetton and Williams, but never really broke through to the level of a top driver. The machinery he had at his disposal was only intermittently good enough to challenge for wins.
Boutsen was a wet-weather specialist, with two of his three wins coming in wet conditions. As I have shown in a previous post, Boutsen ranks among the top drivers when comparing wet-weather scoring rates to dry-weather scoring rates. By the model’s reckoning, Boutsen was at his best in 1990, when he raced alongside Riccardo Patrese and won the Hungarian GP from pole (his only dry race victory). He outscored Patrese 34-23 to finish sixth in the championship.
95. Maurício Gugelmin
(4.99 ppr, 1989-1991)
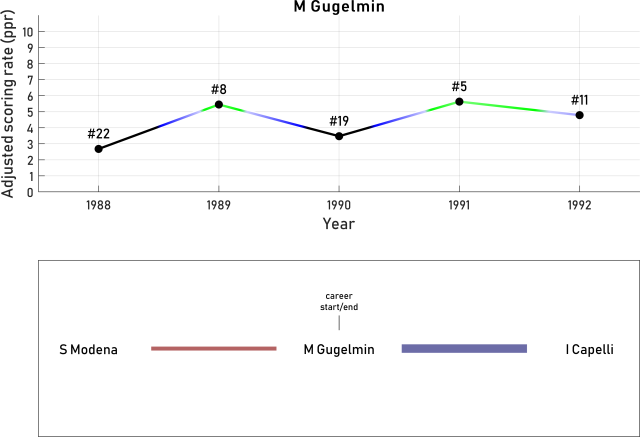
Maurício Gugelmin’s F1 career was stymied by uncompetitive and unreliable cars. Mechanical DNFs comprised 49% of his race starts. Most of his career was spent racing for Leyton House, four times finishing in the points.
Gugelmin primarily raced alongside two teammates in F1. The first was Ivan Capelli (ranked 112th), who was entering his second full season when Gugelmin debuted. Gugelmin scored 20-25 in qualifying, 6-6 in counting races, and 9-18 in points, with his record progressively improving versus Capelli as he gained experience, whereas the car’s competitiveness and points scoring opportunities faded away. This left Capelli ahead in the overall points tally, based on their first season together, but the model recognizes that Gugelmin was the slightly better performer across seasons, adjusting for car performance.
The second teammate was Stefano Modena, who raced alongside Gugelmin in the uncompetitive 1992 Jordan. Modena appeared to have a slight edge over Gugelmin, with Gugelmin scoring 2-2 in counting races, 7-9 in qualifying, and 0-1 in points.
94. Pedro Diniz
(5.08 ppr, 1998-2000)


Pedro Diniz was a pay-driver supported by a billionaire father, who proved to have respectable but not top-line pace when faced with a series of highly talented teammates.
Diniz’s junior results were underwhelming, and would not have justified a move to F1, were it not for the struggling Forti team desperately seeking investors. In his rookie year, Diniz exceeded expectations by looking competitive alongside his experienced teammate, the 35-year-old Roberto Moreno (no ranking). The overall tally for Diniz was 5-2 in counting races and 8-9 in qualifying. For 1996, Diniz jumped ship to Ligier, a team in the doldrums and very eager to receive Diniz’s financial support. Partnered with the promising Olivier Panis (now in his third season), Diniz was clearly outpaced 3-5 in counting races, 1-15 in qualifying, and 2-13 in points.
For 1997, Diniz was paired with reigning champion, Damon Hill, at Arrows. Beaten but not completely embarrassed by Hill, Diniz trailed 2-3 in counting races, 3-14 in qualifying, and 2-7 in points. Results against Jean Alesi and Mika Salo in subsequent seasons further confirmed Diniz’s status as competent, but never quick enough to reliably beat top drivers.
One of the key factors that held Diniz back from achieving more was his incredibly high crash rate. Diniz crashed out of 27.6% of his F1 starts (or 41.5% of his counting races), which is the highest crash rate of anyone in the top 100. He also holds the all-time record for the most consecutive crash-related DNFs in F1 history, with 6 consecutive crashes from Germany 1999 to Malaysia 1999.
93. Adrian Sutil
(5.12 ppr, 2009-2011)


Adrian Sutil showed occasional glimpses of promising speed, most often at Monaco. In his second full season, he memorably lost a 4th place finish with just six laps to go when hit from behind by an out-of-control Kimi Räikkönen. However, Sutil was forever held back by inconsistency. His crash rate of 19% was one of the highest of the modern era.
Sutil was clearly quicker than Vitantonio Liuzzi (ranked 118th), whom he beat 10-9 in counting races, 17-4 in qualifying, and 47-21 in points. But he clearly struggled against Giancarlo Fisichella, whom he trailed 8-12 in counting races, 14-20 in qualifying, and 0-8 in points.
92. François Cevert
(5.20 ppr, 1971-1973)


François Cevert spent his career racing alongside one of the all-time greats, Jackie Stewart. Cevert was nurtured and coached by Stewart as his protégé and heir apparent at the Tyrrell team. Unfortunately, Cevert died in a horrifying crash in qualifying for what would have been Stewart’s final grand prix, meaning he never took the leading driver role.
Overall, Cevert was dominated by Stewart, trailing him 6-24 in counting races, 5-37 in qualifying, and 83-190 in points. The qualifying gap between the pair was substantial but decreased over time, as shown below.

Percentage qualifying gaps from Cevert to Stewart. Negative values indicate that Cevert is quicker, positive values indicate that Stewart is quicker. Each data point is one qualifying session. Dashed horizontal lines indicate median values for each season.
Cevert is also linked with Ronnie Peterson in the above teammate graphic, as both drove a customer March-Ford in 1970, although for different entrants (Cevert for Tyrrell, Peterson for the less well funded Colin Crabbe racing team — a fine detail that the model does not account for).
Projecting Cevert’s likely career, had he survived, was the topic of a recent post in my historical hypothetical series. The conclusion of that analysis was that Cevert would have likely won several races for Tyrrell, but probably would not have ever won a drivers’ title.
91. Martin Brundle
(5.27 ppr, 1991-1993)

Although he never secured a top drive, Martin Brundle faced an incredible array of highly rated teammates across his career, including Michael Schumacher, Mika Häkkinen, Rubens Barrichello, Olivier Panis, and Stefano Modena. This assortment of teammates allows a strong determination of Brundle’s level relative to others. In the plot below, reproduced from my historical hypothetical series, we can see how Brundle’s qualifying performances rated relative to each of his teammates.
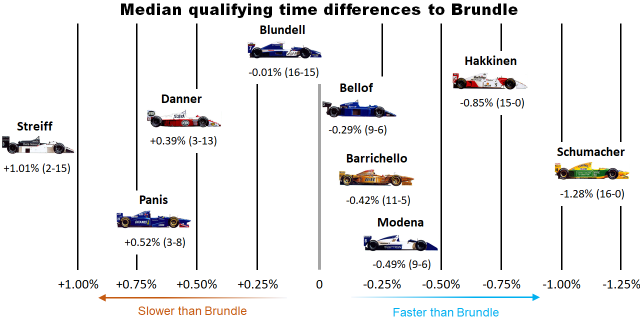
Brundle was a highly versatile driver who excelled in both F1 and sportscars. The fact that he failed to win an F1 race was more reflective of machinery than the quality of his driving. In Brundle’s 158 starts, he scored 9 podiums. His teammates scored 18 podiums, with only a single win by Michael Schumacher at Belgium 1992.
Brundle was a reliable pair of hands in race conditions, even if he lacked somewhat in ultimate pace. In the words of Ron Dennis, at the time when Brundle was being replaced by David Coulthard,
“He struggles in qualifying and does a brilliant job in the race. When you start two or three rows back from where you should be, you don’t get a chance to shine.”
A major unresolved question over Brundle’s career is whether he might have performed better had he not suffered major injury in his brutal crash at Dallas 1984, which prevented him left foot braking later in his career. Brundle survived several other major accidents, including a direct strike from a car to his helmet at Brazil 1994 resulting in severe concussion, another concussion at Monaco 1984, and a famous crash in Melbourne 1996, where his car split into two pieces. We are all fortunate that he survived such a challenging career to work in the commentary booth.
90. Hans-Joachim Stuck
(5.28 ppr, 1976-1978)


Hans-Joachim Stuck was an absolute legend in sportscars and sedans, but struggled to find the same success in F1. Stuck was not helped in single-seaters by his very large frame (194cm, 6’4″). In F1, he was also frequently driving beyond the limit, crashing out of an extraordinary 27% of the races he started.
Stuck started his F1 career at March, where he was joined by fellow rookie Vittorio Brambilla (ranked 114th). The pair raced together for three seasons, with Stuck scoring 2-6 in counting races, 14-20 in qualifying, and 13-12 in points. In his third season at March, Stuck was also joined by teammate Ronnie Peterson, against whom Stuck scored 2-2 in counting races, 2-13 in qualifying, and 5-10 in points.
Following the tragic death of Carlos Pace, Stuck raced for Brabham in 1977. There, he was paired with John Watson, against whom he scored 2-3 in counting races, 3-11 in qualifying, and 12-8 in points. Stuck’s final move in F1 was to the Shadow team, where he raced alongside Clay Regazzoni, scoring 0-2 in counting races, 6-9 in qualifying, and 2-4 in points.
89. Vitaly Petrov
(5.33 ppr, 2010-2012)


Vitaly Petrov is perhaps best known for his pivotal role in the 2010 championship decider, as he used every inch of track and more to deflect Fernando Alonso. Having taken four years to achieve 2nd in the championship in GP2, expectations were not high for Petrov when he debuted at Renault alongside the more experienced Robert Kubica in 2010. The one-sided tally of 1-13 in counting races, 2-17 in qualifying, and 27-136 in points confirmed initial expectations.
Following the unfortunate injury of Kubica, Petrov mounted a much more successful second season in 2011. Beginning the season alongside veteran Nick Heidfeld, Petrov achieved the very credible record of 4-6 in counting races, 8-3 in qualifying, and 32-34 in points. When Bruno Senna (ranked 123rd) replaced Heidfeld midseason, Petrov prevailed 5-3 in counting races, 4-4 in counting races, and 5-2 in points.
In his final season, Petrov raced alongside Heikki Kovalainen. Although neither driver scored points in the uncompetitive Caterham CT01, Petrov came out ahead 10-7 in counting races and was behind 6-13 in qualifying. Neither driver was retained for the 2013 season.
88. Johnny Herbert
(5.33 ppr, 1995-1997)

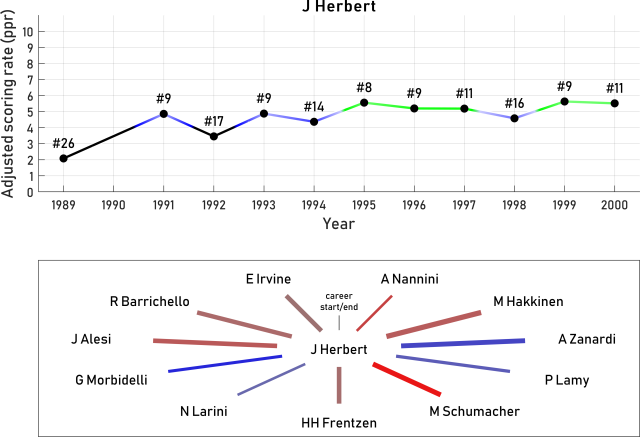
Like Martin Brundle, one wonders what more Johnny Herbert might have achieved had he not carried permanent foot injuries throughout his F1 career. After a dominant title in British F3 in 1987, beating 8 future F1 drivers, Herbert was considered an extremely hot prospect. Following a devastating crash in F3000 that almost resulted in foot amputation, he was fortunate to still find an F1 seat, scoring points incredibly on his debut for Benetton. Herbert’s performance tailed off due to difficulty braking with his damaged foot, but he found a more permanent home at Lotus. From 1991-1992, Herbert faced the younger, less experienced Mika Häkkinen. While Herbert came out ahead 14-10 in qualifying — impressively given Häkkinen’s later record in qualifying — he trailed 2-7 in counting races.
After positive results against Alex Zanardi (no ranking) and Pedro Lamy (ranked 126th), Herbert was recruited by Benetton as Michael Schumacher’s number two, supporting his title challenge in 1995. Up against one of the greatest drivers in history, Herbert was dominated 3-12 in counting races, 1-18 in qualifying, and 45-108 in points. Herbert’s victory at the British GP came as a result of Schumacher and Hill colliding, as well as Coulthard receiving a stop-go penalty after a failure of the pit speed-limiter.
Herbert’s subsequent records against Heinz-Harald Frentzen, Rubens Barrichello, Jean Alesi, and Eddie Irvine confirmed that he was a solid driver, but never among the top drivers on the grid.
87. Maurice Trintignant
(5.42 ppr, 1953-1955)

Maurice Trintignant had an impressively varied racing career, beginning in 1938 at age 21 and resuming after World War II. Unlike most pre-war racers, he was still relatively young, aged 32, at the beginning of the World Drivers’ Championship in 1950. This allowed him to enjoy a long F1 career, which stretched out until 1964. In fact, Trintignant held the record for most F1 starts from 1959 to 1966 before Jack Brabham and Graham Hill took the record. Notably, Trintignant spent 61% of his counting races in customer cars, which the model now considers in cases such as his negative records against works team drivers Jack Brabham (who beat Trintignant 4-10 in counting races) and Bruce McLaren (who beat Trintignant 2-4 in counting races).
The model rates Trintigant the season’s 3rd best performer on two occasions: in 1955, when he raced for Ferrari, outscoring teammate Giuseppe Farina, and again in 1958. Both were years in which he won the Monaco GP — curiously, the only track at which he ever won.
86. John Surtees
(5.42 ppr, 1966-1968)


John Surtees achieved the almost unbelievable distinction of winning the highest level championships on both two wheels and four wheels. That in itself is one of the greatest ever achievements in motorsports.
In F1, Surtees held a consistent advantage over his long-time number two driver, Lorenzo Bandini (ranked 167th), beating him 7-1 in counting races, 21-3 in qualifying, and 66-47 in points. Surtees also held a collective record of 9-5 in counting races against a rotating cast of moderately strong teammates, none of whom make the top 100 (Roy Salvadori, Masten Gregory, Ian Burgess, Innes Ireland, Jackie Lewis, Pedro Rodriguez, Mike Hailwood, and Willy Mairesse).
Surtees completed only a small number of races against other world champions across his career. In his rookie season for Team Lotus, Surtees was paired with fellow rookie Jim Clark, scoring 1-1 in counting races, 1-2 in qualifying, and 6-4 in points, courtesy of an impressive 2nd place in only his second race start.
In 1966, Surtees split with Ferrari, racing a Cooper alongside Jochen Rindt. Against Rindt, Surtees scored 1-1 in counting races, 6-1 in qualifying, and 19-18 in points, despite 4 mechanical DNFs to Rindt’s 1. It was only Rindt’s second full season, which the model now takes into account for this comparison. Nevertheless, given how highly the model rates Rindt, this is considered Surtees’ career-strongest performance by some margin. It is notably, however, based on a small sample, with Surtees having only four counting races in the season.
85. Peter Collins
(5.43 ppr, 1956-1958)


Peter Collins famously gave away his own chance at challenging for the 1956 title to support teammate Juan Manuel Fangio, giving his car to the team’s lead driver mid-race while the title was still alive for both drivers. The model rates 1956 as Collins’ strongest season, rating him the year’s second best performer, behind only Fangio.
His contemporary, Tony Brooks, once said that Collins drove harder than any other driver he faced. Indeed, for a driver in the 1950s, Collins had a distinctly high crash rate of 1 in 8 starts. Only two drivers who debuted in the 1950s and started at least 20 races had higher crash rates than Collins: Luigi Musso (17%) and Johnny Claes (22%). Like Musso, Collins sadly died in a crash while chasing another driver down for the race lead.
84. David Coulthard
(5.48 ppr, 2001-2003)

David Coulthard’s career was curiously entwined with that of the legendary designer, Adrian Newey. The two worked together at Williams from 1994-1995, before Coulthard moved to McLaren in 1996. Newey also moved to McLaren in 1997, where the two remained until 2005, when Coulthard transferred to Red Bull to make way for Juan Pablo Montoya’s entry at McLaren. Once again, Newey followed Coulthard’s move a year later.
Intersecting with Newey for all but two years of his career ensured Coulthard access to consistently excellent machinery and results. His total of 13 career wins ranks 22nd in the all-time record books, ahead of numerous World Drivers’ Champions. Yet, to put these results in perspective, his teammates (Damon Hill, Mika Häkkinen, and Kimi Räikkönen) collectively racked up 31 wins over the same period.
83. Riccardo Patrese
(5.49 ppr, 1984-1986)

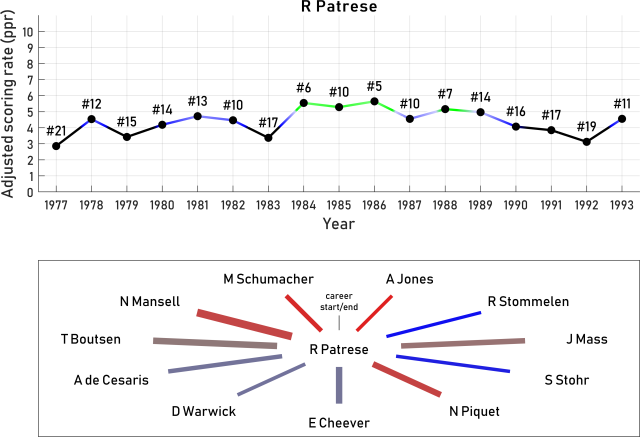
Riccardo Patrese experienced a baptism of fire, debuting alongside the more experienced Alan Jones at Shadow, and being bullied by senior drivers over his falsely represented role in Ronnie Peterson’s fatal accident in 1978. Beaten by Jones 0-5 in counting races, 3-6 in qualifying, and 1-13 in points, Patrese made a stronger impression in 1978, nearly winning in South Africa, but for an engine failure with 15 laps to go, and finishing on the podium in Sweden. He dominated his teammate Rolf Stommelen (ranked 162nd) 4-0 in counting races, 13-0 in qualifying, and 11-0 in points.
Across 1979-1980, Patrese was closely matched with teammate Jochen Mass (ranked 107th), scoring 7-6 in counting races, 20-6 in qualifying, and 9-7 in points. In 1981, he dominated the relatively weak rookie Siegfried Stohr (no ranking). 1982 was a major career move for Patrese, as he joined reigning champion Nelson Piquet at Brabham. In a turbulent season, Patrese outscored Piquet by 1 point, but very poor reliability for both cars made it a difficult comparison. In 1983, Brabham bounced back with a much stronger car, in which Piquet won his second championship, while Patrese finished only 9th in the championship, crashing out of the lead in Imola. Overall, Patrese’s head-to-head versus Piquet was 3-4 in counting races, 11-19 in qualifying, and 34-79 in points.
Frustrated by contract negotiations with Brabham team owner Bernie Ecclestone, Patrese signed for Alfa for 1984-1985, where he raced with Eddie Cheever, against whom he scored 4-1 in counting races, 20-12 in qualifying, and 8-3 in points.
Returning to Brabham, Patrese started 1986 alongside Elio de Angelis, before his teammate was tragically killed in testing. The pair finished no races together, but Patrese was leading 4-0 in qualifying and 1-0 in points after four rounds. Patrese partnered Derek Warwick for the rest of the season, beating him 2-0 in counting races, 8-3 in qualifying, and 1-0 in points. Continuing with Brabham in 1987, Patrese beat Andrea de Cesaris (ranked 122nd) 1-0 in counting races, 12-3 in qualifying, and 6-4 in points.
Patrese’s last major career move was to Williams, where he raced with Nigel Mansell and Thierry Boutsen. Patrese struggled against both drivers, losing to Mansell 5-20 in counting races, 12-34 in qualifying, and 117-192 in points, and losing to Boutsen 5-10 in counting races, 19-13 in qualifying, and 63-71 in points.
Patrese rounded out his long career, now aged 39, with a season at Benetton alongside the rapidly rising Michael Schumacher in 1993. Patrese was completely dominated, losing 1-7 in counting races, 0-16 in qualifying, and 20-52 in points.
At his best, Patrese was a driver capable of beating most others on the grid, but his limitations were evident whenever placed alongside an elite driver. The model rates 1984-1986 as Patrese’s career peak, which unfortunately coincided with some of his least competitive cars.
82. Denny Hulme
(5.50 ppr, 1968-1970)

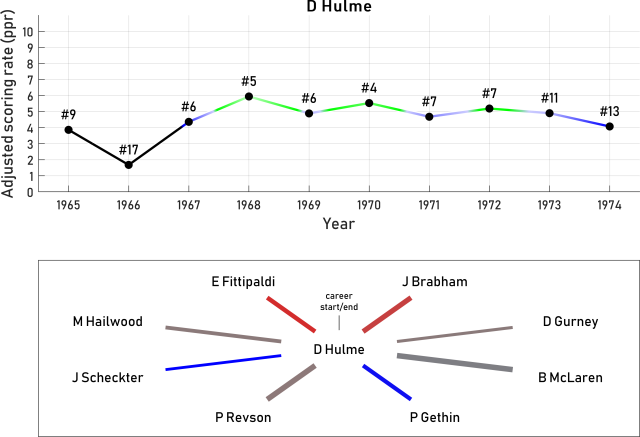
Denny Hulme was part of a trio of extremely talented drivers from New Zealand in the 1960s, the other members being Bruce McLaren and Chris Amon. Of the three, Hulme was the most successful, winning 8 races and a drivers’ title. By the model’s rankings, however, Hulme is rated lowest of the three.
Hulme was a smooth, conservative, and tenacious racer. He crashed out of only 4% of his races and scored 9 fastest laps. However, he was a relatively weak qualifier, scoring only one pole position, the fewest of any world champion, while his teammates collectively scored 7.
Hulme began his career at Brabham, alongside the double-champion team-owner, Jack Brabham. Over three seasons, Hulme was beaten 3-9 in counting races, 5-20 in qualifying, and 69-95 in points. Within this period, Brabham won the 1966 drivers’ title, while Hulme won the 1967 drivers’ title. It is often claimed that Hulme won his title largely because Brabham experienced poorer reliability due to testing experimental parts. It is not, however, so straightforward.
Both drivers were affected by mechanical issues in South Africa, with engine issues dropping Brabham from 2nd to 6th, while Hulme’s loss of brake fluid dropped him from 1st to 4th. In Monaco, Brabham qualified on pole and likely could have won, relegating Hulme to 2nd, had his engine not failed. When both cars broke down in Belgium, Brabham was running 3rd while Hulme was outside the points. In Germany, Brabham’s qualifying position was poor due to running the old car, following a terrifying, high-speed suspension failure in practice. It is not clear that this meaningfully affected the race result, however. In Italy, Hulme was leading and likely could have won, relegating Brabham to 3rd, had his car not had a head gasket failure. Finally, Brabham dropped from 4th to 5th in the US due to a puncture.
Were these misfortunes in 1967 all reversed, Hulme would have scored 63 points, of which 59 would count for the championship due to the points system in that year excluding two results. Brabham would have scored 65 points, of which 59 would also count. In this hypothetical, both drivers would have 3 wins and 4 second places, meaning the title would go to Hulme on the basis of having 3 third places to 2 third places for Brabham.
Hulme moved to McLaren in 1968, racing alongside another team-owner/driver, Bruce McLaren. Across two seasons the pair were closely matched, with Hulme scoring 6-5 in counting races, 20-5 in qualifying, and 51-54 in points. Hulme was similarly closely matched with Pete Revson (no ranking), scoring 8-9 in counting races, 14-9 in qualifying, and 53-61 in points.
In his final F1 season, Hulme faced Emerson Fittipaldi. Now aged 38, and up against Fittipaldi in his prime, Hulme was comprehensively beaten 1-8 in counting races, 1-14 in qualifying, and 20-55 in points.
81. Derek Warwick
(5.52 ppr, 1988-1990)


Derek Warwick’s F1 career was filled with misfortune, meaning his race-winning potential was never realized. At his peak, the model sees Warwick as an extremely capable driver, ranked #4 in both the 1988 and 1989 seasons.
Several factors played into Warwick’s challenging career. First, he began at the uncompetitive Toleman team, during which time their car was often not quick enough to even qualify for the race. Second, a timely move to Lotus was vetoed by lead driver Ayrton Senna, who felt the team could only support one strong driver and pushed for a weak pay-driver as number two. Warwick would likely have struggled against Senna in equal machinery, but he would at least have had an opportunity for race victories. Finally, and most significantly, Warwick rejected a move to Williams in 1985 in favor of Renault, right as Renault began to wind down their F1 effort and Williams hit the front. Williams hired Nigel Mansell instead, and the rest is history.
80. Jean-Pierre Beltoise
(5.52 ppr, 1972-1974)

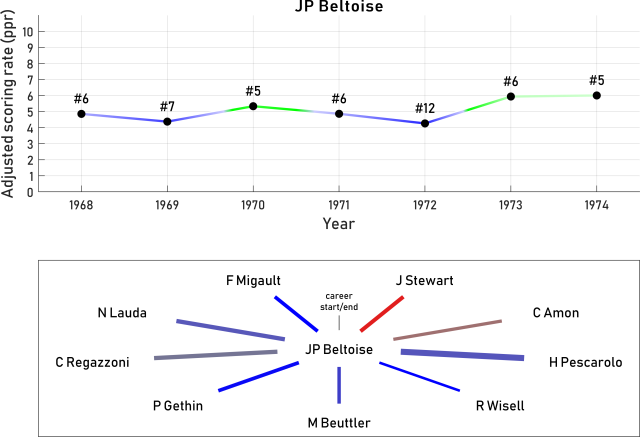
Jean-Pierre Beltoise was a highly talented driver of the early 1970s, not quite at the level of the era’s best, but consistently rated the 5th or 6th best driver on the grid by the model. Beltoise is best remembered for a single brilliant victory at Monaco in torrential rain, an outlier result that carries less weight with the model’s robust scoring system. Partly for this reason, Beltoise is rated lower than he was in the old f1metrics rating list. Another key contributor to this change is the model recognizing Niki Lauda’s inexperience when he was paired with and beaten by Beltoise.
Beginning with Matra, Beltoise was the team’s sole driver for most of 1968. He impressed with 2nd in the wet Dutch GP in only his eight start. In 1969, he was joined at Matra by Jackie Stewart, and was dominated by his outstanding teammate 1-7 in counting races, 1-10 in qualifying, and 21-63 in points. In his third season, Beltoise faced Chris Amon and was beaten 2-3 in counting races, 1-6 in qualifying, and 1-6 in points.
In all other seasons, Beltoise outperformed his teammates, including Clay Regazzoni and an inexperienced Niki Lauda. Beltoise raced in Matra’s sportcar program in parallel with F1, where an unfortunate accident in 1971 resulted in the death of Ignazio Giunti, caused by Beltoise pushing his car along the circuit after running out of fuel. Beltoise’s international racing license was suspended for three months, resulting in him missing three grands prix. Retiring from F1 in 1974, Beltoise moved into touring car racing and rallycross.
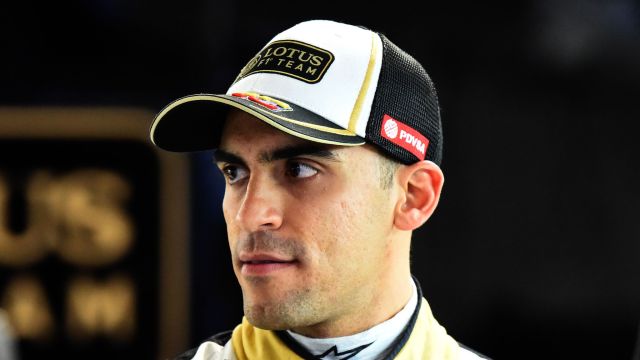
79. Pastor Maldonado
(5.54 ppr, 2013-2015)
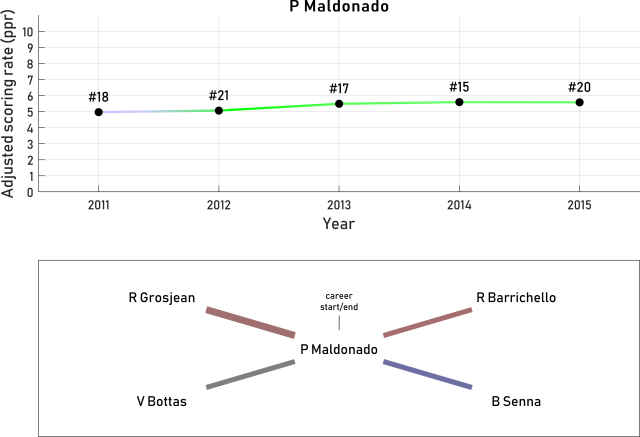
Although a race winner, Pastor Maldonado never shook off his reputation as an incredibly reckless driver whose performances ran hot-cold in every season of his career. Maldonado’s rookie season against Rubens Barrichello looked relatively promising compared to his junior single-seater career, scoring 5-9 in counting races, 9-10 in qualifying, and 1-4 in points. These were similar results to those produced by the more highly touted rookie Nico Hülkenberg, who had raced alongside Rubens Barrichello in the same seat the previous season.
Relatively close battles followed against Bruno Senna (8-8 in counting races, 17-2 in qualifying, and 43-30 in points) and against the rookie Valtteri Bottas (10-7 in counting races, 7-12 in qualifying, and 1-4 in points). Against Romain Grosjean, Maldonado’s performance level was finally more clearly benchmarked against an experienced driver. Maldonado was consistently outpaced over two seasons, scoring 8-12 in counting races, 5-28 in qualifying, and 29-59 in points. Having been sponsored by the Venezuelan government, Maldonado’s career ended when the country’s economy collapsed.
78. Gilles Villeneuve
(5.55 ppr, 1979-1981)
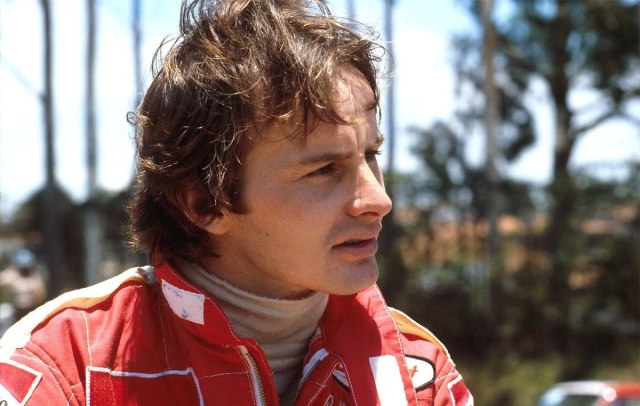
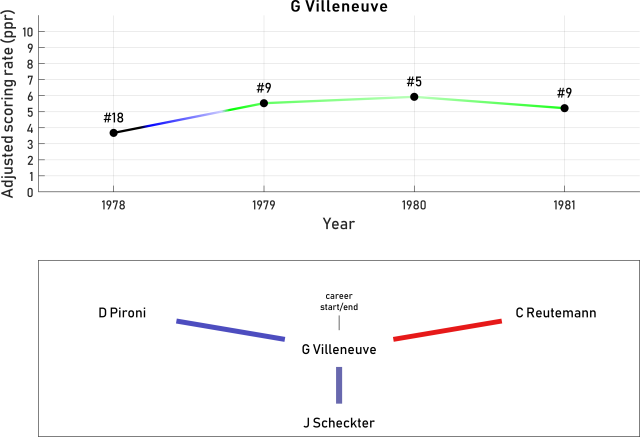
As I noted last time I wrote an all-time ranking list, if we take anecdotes over achievements, Villeneuve is surely one of the greatest of all time. With an unsentimental mathematical model that only considers race results (and doesn’t consider team orders in 1979), Villeneuve remains ranked outside the top 50.
Villeneuve was a spectacular driver with uncanny car control and wet-weather flair, but he also made frequent driver errors. In 1978, he was beaten by the more experienced Carlos Reutemann 6-7 in counting races, 4-12 in qualifying, and 17-48 in points. Against Jody Scheckter, Villeneuve scored 11-5 in counting races, 20-9 in qualifying, and 59-62 in points. In this instance, the total points tally does not tell the full story. Villeneuve was often the quicker driver in 1979, when Ferrari had the dominant car, but Scheckter emerged as the number one driver, in part due to poorer reliability for Villeneuve. In 1980, when Villeneuve was clearly beating Scheckter, the car was scarcely capable of points.
From 1981 to his fatal accident in 1982, Villeneuve raced alongside Didier Pironi at Ferrari. Pironi is not rated particularly highly by the model (128th of all-time), having been outperformed by every teammate he faced in F1 (Tambay, Jarier, Laffite, Villeneuve). Overall, against Pironi, Villeneuve scored 3-4 in counting races, 14-6 in qualifying, and 31-19 in points, which the model only considers a moderately strong result against a driver with Pironi’s record.
Villeneuve’s tragically short career is the topic of one of my recent historical hypothetical posts. The conclusion of that post is that, had he lived, Villeneuve would most likely have won the 1982 and 1983 drivers’ titles for Ferrari.
77. Paul di Resta
(5.55 ppr, 2011-2013)


The F3 Euro champion in 2006, ahead of teammate Sebastian Vettel, Paul di Resta never fully converted his early potential into results in F1. di Resta spent three seasons in F1, racing alongside Adrian Sutil in his first and third seasons. Sutil was already in his fifth season when di Resta was a rookie, and he outperformed di Resta that season. di Resta turned the tables when they met again, resulting in di Resta narrowly leading their overall head-to-head record 17-15 in counting races, 19-17 in qualifying, and 75-71 in points. Given the experience differential, the model interprets this match-up as evidence that di Resta was superior to Sutil.
In his second season, di Resta faced Nico Hülkenberg, also in his second season after returning from a year spent testing. Although di Resta started the season very strong, leading Hülkenberg 6-1 in counting races and 5-2 in qualifying, Hülkenberg dominated the second half of the season to ultimately beat di Resta 8-11 in counting races, 8-11 in qualifying, and 46-63 in counting races.
76. Jacky Ickx
(5.55 ppr, 1970-1972)


Jacky Ickx simultaneously competed for the top prizes in both F1 and sportcars, winning Le Mans 6 times and twice finishing 2nd in the World Drivers’ Championship.
The model estimates that 1968, Ickx’s first full F1 season, was his strongest career performance. An experienced endurance racer and F2 campaigner, Ickx had made his talent clear to the F1 paddock when he ran as high as 5th place in an F2 car during a combined F1/F2 race at the Nürburgring in 1967, overtaking twelve F1 cars. In 1968, Ickx raced in F1 alongside the more experienced Chris Amon, scoring 4-1 in counting races, 2-7 in qualifying, and 27-10 in points, finishing an impressive 4th in the championship.
Ickx solidified his reputation by beating Jack Brabham 3-0 in counting races, 4-4 in qualifying, and 18-14 in points. However, Brabham was by this stage 43 years old, which the model now takes into consideration. Ickx spent 1970-1973 racing for Ferrari with Mario Andretti, Clay Regazzoni, and Arturo Merzario (ranked 137th). Versus Andretti, Ickx scored 2-3 in counting races, 8-3 in qualifying, and 31-16 in points. Versus the less experienced Regazzoni, Ickx was ahead 14-3 in counting races, 16-13 in qualifying, and 86-61 in points. Versus Merzario, Ickx was ahead 4-2 in counting races, 5-4 in qualifying, and 17-7 in points.
In 1974, Ickx was comprehensively beaten by a teammate for the first time in his career. Against the highly talented Ronnie Peterson, he scored 3-7 in counting races, 3-21 in qualifying, and 15-38 in points. In the following years, Ickx made only sporadic appearances for Williams, Ensign, and Ligier before bowing out of F1.
75. Olivier Panis
(5.59 ppr, 1996-1998)


Olivier Panis was a rising star in F1, having won the 1996 Monaco GP, when he suffered a massive accident at the 1997 Canadian GP. With both legs broken, he missed the remainder of the season. On return, Panis’ results were seemingly never at the same level, though he remained a highly respected test driver. On the other hand, Panis’ teammates — including Jarno Trulli and Jacques Villeneuve — were generally stronger post-1997. So was it the injury that hampered Panis’ performances, or did better teammates simply create the illusion that Panis’ form had faded? Without a model that could track a driver’s trajectory across age and experience, these possibilities were previously difficult to disentangle.
Now, armed with a model that can account for the trajectory of performance across a driver’s career, we can reexamine the question. In the graph above, Panis’ performances were steadily rising from his rookie year up to 1997. In 1997, he is rated the 5th best performing driver on the grid. In the remainder of his career, after return from the injury, he is never again rated within the top 10. On this basis, it seems likely that the injury was indeed a career turning point, which impacted Panis’ subsequent performances.
74. Mike Hawthorn
(5.71 ppr, 1952-1954)


Mike Hawthorn was Britain’s first champion, taking the 1958 championship from Stirling Moss, after the latter sportingly pleaded Hawthorn’s case in a key race to avoid Hawthorn’s disqualification. The model sees Hawthorn as one of the stronger drivers of the 1950s, but the weakest champion of that decade, behind Giuseppe Farina, Alberto Ascari, and Juan Manuel Fangio.
Three of Hawthorn’s teammates appeared clearly quicker in equal equipment. Against Giuseppe Farina, he was beaten 2-6 in counting races and 1-10 in qualifying. Against Alberto Ascari, he was beaten 3-5 in counting races and 0-9 in qualifying. Against José Froilán González (no ranking), he was beaten 1-2 in counting races and 1-6 in qualifying.
Two of Hawthorn’s teammates had mixed records against him. Against Luigi Villoresi (no ranking), Hawthorn scored 3-3 in counting races and 2-8 in qualifying. Against Peter Collins, Hawthorn scored 3-2 in counting races and 8-3 in qualifying.
Against his other teammates, Hawthorn was generally significantly quicker. He beat Maurice Trintignant 4-3 in counting races and 12-1 in qualifying, Luigi Musso (ranked 117th) 5-3 in counting races and 7-2 in qualifying, and Wolfgang von Trips (no ranking) 3-1 in counting races and 5-0 in qualifying.
Mike Hawthorn retired at the end of 1958, reigning champion and aged 29, but suffering a terminal kidney disease. He died in a motor vehicle accident months later.
73. Jack Brabham
(5.76 ppr, 1959-1961)
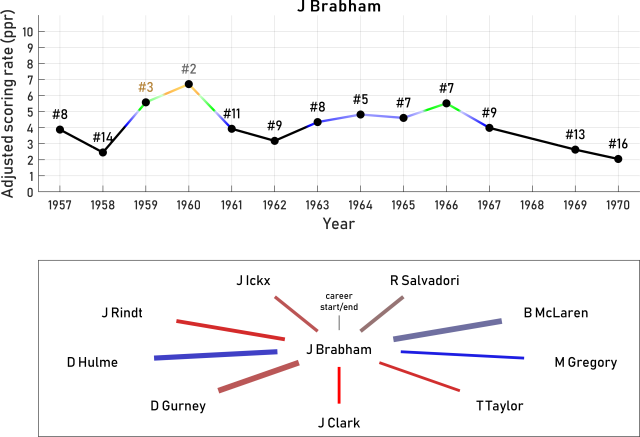
Jack Brabham was not the ultimate quickest driver of his generation, his performances wavering greatly between seasons, but the mark he left on the sport is among the most significant and indelible of any driver.
The team that Brabham developed became one of the F1 powerhouses, winning 35 races (including eight 1-2s), two constructors’ titles, and four drivers’ titles. Most remarkably, Brabham won a championship in a car of his own construction in 1966, aged 40. This is a feat unlikely to ever be replicated in F1.
Brabham’s season performances are curiously depressed across the period 1961-1965. This corresponds to the period in which F1 used a smaller engine formula, resulting in less powerful cars, perhaps not suiting Brabham’s style. However, it also a period in which Brabham was keenly focused on the development of his own team.
In direct head-to-heads, Brabham was beaten by several other greats of his era, including Jim Clark, Dan Gurney, Jochen Rindt, and Jacky Ickx. But at his absolute best, in the period 1959-1960 (when racing was his sole focus), the only driver on the grid who was clearly quicker was Stirling Moss.
72. Ralf Schumacher
(5.80 ppr, 2004-2006)


Ralf Schumacher had an impossible benchmark in his brother, but he could be unbeatably quick on his day. Previously ranked inside the top 50, Ralf’s rating has fallen due to new drivers joining the list, as well as him now receiving less credit for results against inexperienced teammates Jenson Button and Juan Pablo Montoya, and his thrashing of Alex Zanardi (no ranking) who was then on a comeback after four years out of the sport.
In his rookie year, Schumacher was slightly outperformed by Giancarlo Fisichella (in his second season), scoring 4-6 in counting races, 7-10 in qualifying, and 13-20 in points. In 1998, Schumacher partnered ex-champion Damon Hill, scoring 3-4 in counting races, 10-6 in qualifying, and 14-20 in points. This would have been a positive record had Schumacher been allowed to pass Hill for the lead at Spa.
Moving to Williams in 1999, Schumacher dominated Alex Zanardi 5-2 in counting races, 11-5 in qualifying, and 35-0 in points, putting a rapid end to Zanardi’s comeback. In 2000, Schumacher was paired with the precocious rookie Jenson Button, whom he beat 6-3 in counting races, 11-6 in qualifying, and 24-12 in points. Across 2001-2004, Schumacher was paired with new recruit Juan Pablo Montoya. Although Schumacher was more experienced, the pair were closely matched, with an overall tally of 17-20 in counting races, 28-22 in qualifying, and 173-194 in points.
In 2005, Schumacher moved to Toyota, where he spent three years racing alongside Jarno Trulli. The pair proved to be a close match, with Schumacher scoring 16-22 in counting races, 17-36 in qualifying, and 70-66 in points.
71. Carlos Pace
(5.82 ppr, 1975-1977)

Carlos Pace is often forgotten today, overshadowed by the successes of his Brazilian compatriots Emerson Fittipaldi, Nelson Piquet, and Ayrton Senna. However, he was highly rated by his contemporaries, and ranked #51 of all time by a poll of experts in F1 Racing magazine in 1997.
In his first two seasons, 1972-1973, Pace dominated teammates Henri Pescarolo (ranked 142nd) and Mike Hailwood (ranked 125th). He started 1974 with the Surtees team, outperforming Jochen Mass (ranked 107th), before moving to Brabham. He raced there alongside Carlos Reutemann from 1974-1976, scoring 6-10 in counting races, 17-15 in qualifying, and 39-63 in points. In 1975, he took his only career win at Interlagos — the track now named in his honor.
1977 got off to a promising start with 2nd place at the first round. Unfortunately, Pace was killed after the third round in a light aircraft accident.
70. Jody Scheckter
(5.85 ppr, 1974-1976)


On a good day, Scheckter was one of the best drivers of the 1970s. On a bad day, he was nowhere. Although he won the 1979 title, the model attributes this to a dominant car, ranking Scheckter only the year’s 12th best performer and his teammate Gilles Villeneuve the year’s 9th best performer. In the model’s estimation, Scheckter’s peak period came earlier than this.
Scheckter’s career began in ignominious fashion, as he DNFed from every start in 1973. On debut, he was running 3rd until he spun. He looked set for victory in his third race, but crashed into Emerson Fittipaldi, prompting the Brazilian to call Scheckter a “menace to himself and everybody else”. At the next race, Scheckter caused a massive pile-up, leading to the McLaren team resting him for four rounds. On return, he crashed again.
Witnessing the harrowing fatal crash of François Cevert at the end of 1973 led to a fundamental refinement of Scheckter’s driving, as he became a far more careful and precise competitor.
“From then on, all I was trying to do in Formula One was save my life.” – Jody Scheckter
The model ranks 1974 as Scheckter’s finest season. This was a year in which he dominated teammate Patrick Depailler 45-12 in points to finish 3rd in the championship. Racing alongside Depailler from 1974-1976, Scheckter led 19-10 in counting races, 27-18 in qualifying, and 114-65 in points.
Scheckter was a sole entrant for Wolf across most of 1977-1978, during which time he finished 2nd in the championship. Without teammates, this period is not informative to the model about Scheckter’s season or overall performance level.
In 1979, Scheckter made a canny move to Ferrari to partner Gilles Villeneuve, replacing Carlos Reutemann, who left the team at the worst possible time. After winning the title in 1979, the 1980 season was an unmitigated disaster, as Ferrari dropped in the blink of an eye from world-beaters to bottom of midfield. Scheckter’s driving that year seemed completely uninspired and he retired at the end of the year.
69. Gerhard Berger
(5.86 ppr, 1992-1994)


Gerhard Berger made his mark racing the massively powerful BMW-engined Arrows and Benetton across 1985-1986. In his first full season, Berger was beaten by the slightly more experienced Thierry Boutsen 3-6 in counting races, 4-12 in qualifying, and 3-11 in points. In 1986, his record against the more experienced Teo Fabi (no ranking) was more promising: 2-3 in counting races, 14-2 in qualifying, and 17-2 in points.
For 1987, Berger had offers from Ferrari and McLaren, choosing Ferrari. Across 1987-1988, he beat the team’s lead driver Michele Alboreto 10-3 in counting races, 28-4 in qualifying, and 77-41 in points. In 1989, Berger faced his first high-level test when Nigel Mansell joined Ferrari. It was a difficult season for Berger, marred by 50% mechanical DNFs and a horrific, fiery accident at Imola. His overall record against Mansell was 1-2 in counting races, 7-7 in qualifying, and 15-38 in points.
When Alain Prost left McLaren in 1990, Berger gladly accepted the seat alongside Ayrton Senna. Across 1990-1992, Berger served as a reliable but clearly outpaced number two to Senna, scoring 7-19 in counting races, 8-40 in qualifying, and 135-224 in points.
Berger spent the remainder of his F1 career racing alongside Jean Alesi, first at Ferrari then at Benetton. Although Berger was now aged a little past his peak, their head-to-head record was extremely close: 22-19 in counting races, 35-42 in qualifying, and 126-151 in points. While 1993 was a troubled season for Berger, marred by strange accidents, he bounced back in 1994 while dealing with the trauma of his friend Senna’s death at Imola. The model rates Berger’s 1994 season as his career-best performance. Berger had 8 mechanical DNFs in 16 starts that season, finishing 6 times on the podium, with 1 race win, ending a nearly four-year drought for Ferrari.
68. Damon Hill
(5.87 ppr, 1994-1996)


During his F1 career, Damon Hill’s success was a subject of almost constant critique. Landing in the dominant Williams-Renault in his first full season, Hill had a championship contending car for four consecutive seasons, including a dominant car with a rookie teammate in 1996. It was argued that he won his title almost by default. The previous incarnation of the f1metrics model was relatively sympathetic to Hill, ranking him #35, ahead of twelve other champions, including his father, Graham Hill. The updated model has dropped Damon’s ranking behind that of his father, and now ahead of only six other champions (Jody Scheckter, Jack Brabham, Mike Hawthorn, Denny Hulme, John Surtees, and Phil Hill who is outside the top 100 at 139th).
What are the factors that have led to a downward adjustment of Damon Hill’s performance? First, we can consider his 1993 season against Alain Prost. The model recognizes that Prost, at age 38 and coming back from a one-year sabbatical, was likely past his best. However, it also recognizes that Hill was inexperienced, making this a close to fair comparison. In the years that followed, however, Hill was at a consistent advantage to his Williams teammates. David Coulthard was a rookie, who debuted in difficult circumstances following Ayrton Senna’s death in 1994. The model now takes Coulthard’s inexperience into account when it indirectly compares Hill’s strong record against Coulthard (10-4 in counting races, 17-8 in qualifying, and 131-63 in points) to Mika Häkkinen’s record against a much more experienced Coulthard (35-26 in counting races, 68-31 in qualifying, and 360-296 in points). Similarly, the model now considers Hill’s significant experience advantage in 1996 against his rookie teammate Jacques Villeneuve.
Hill demonstrated that he had genuine talent on several occasions, including his stand-out performances for Arrows in 1997 and his brilliant drive at Suzuka 1994. But without the aid of a dominant car, the model does not see Hill challenging for titles in the 1990s.
67. Chris Amon
(5.90 ppr, 1970-1972)

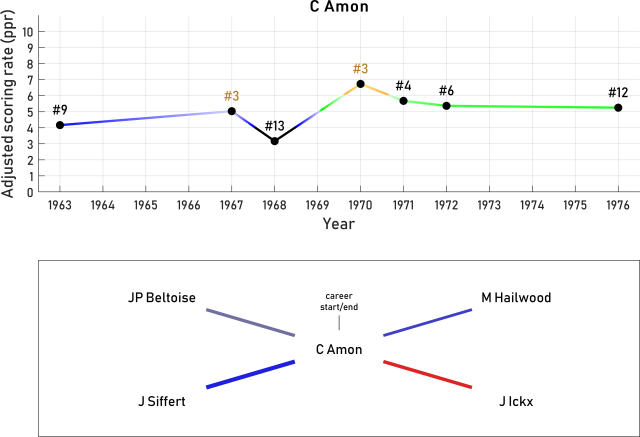
Though Chris Amon had 96 starts, 40% of those were mechanical DNFs, leaving him with 58 counting races. Famously unlucky, Amon never won an F1 race despite 19 front-row starts, 5 poles, and 183 laps led. He is commonly listed among the best drivers to never win a race. Amon’s rating by the f1metrics model has slid from #26 in the old list to #67, taking him out of contention for the model’s best ranked driver to never win a race. This change can be explained by a few factors, the most important being that the model now takes works vs. customer car status into account in teammate comparisons that were previously highly favorable to Amon.
Amon entered F1 in 1963, racing for Reg Parnell. He competed sporadically across 1963-1966 in customer cars, finishing just five races in this period. After winning the 1966 Le Mans race for Ford, Amon was invited to meet with Enzo Ferrari, leading to his signing at Ferrari for 1967. In 1967, Amon dragged Ferrari’s uncompetitive challenger into 5th in the championship and is ranked by the model the year’s 3rd strongest performer. In 1968, he showed great qualifying pace, taking 3 pole positions, but was outscored 27-10 by teammate Jacky Ickx after uncharacteristically crashing at both the Nürburgring and Monza. Reliability problems disrupted Amon’s 1969 campaign, with 5 failures in 6 starts (meaning he has no estimated performance level for the season in the above graph); he nonetheless achieved Ferrari’s best race finish of 3rd that year.
In 1970, Amon drove for the works March outfit, outscoring teammate Jo Siffert (ranked 119th) 23-0 and the customer entries of Ronnie Peterson (20-0) and François Cevert (17-1), but he was outscored by the customer entries of Mario Andretti (2-4) and Jackie Stewart (14-25). Now that the model considers the relative competitiveness of works vs. customer entries, Amon’s 1970 performance is adjusted downwards, although still ranked 3rd best of the year.
In 1971, Amon moved to the works Matra team, where he beat Jean-Pierre Beltoise 3-2 in counting races, 6-1 in qualifying, and 6-1 in points. Amon’s appearances subsequently dwindled until retirement in 1976, mostly appearing as a sole entrant for Matra, Tecno, Ensign, and the shortly-lived Amon team.
66. Patrick Depailler
(5.92 ppr, 1977-1979)


At his peak, in 1977, the model ranks Patrick Depailler as the 5th best performing driver on the grid. Ranked inside the all-time top 50 by the old f1metrics model, he is rated slightly lower in the updated list, due to the model now considering that Didier Pironi was a rookie when he faced Depailler, as well as the addition of new drivers to the list.
Depailler spent nearly his entire career at Tyrrell. From 1974-1976, he raced alongside Jody Scheckter, with both drivers having previously only started a handful of F1 races. Overall, Depailler was outperformed by Scheckter, scoring 10-19 in counting races, 16-27 in qualifying, and 65-114 in points. Depailler’s results were more impressive against the highly rated Ronnie Peterson, scoring 2-3 in counting races, 9-8 in qualifying, and 20-7 in points.
In 1978, Depailler was paired with the rookie Didier Pironi (ranked 128th), whom he soundly beat 6-2 in counting races, 14-2 in qualifying, and 34-7 in points. In 1979, Depailler raced only the first 7 rounds for Ligier before breaking both legs in a hang-gliding accident. In that half-season, he was beaten by Jacques Laffite 0-3 in counting races, 3-4 in qualifying, and 22-24 in points. Shortly after his comeback with Alfa Romeo in 1980, Depailler died in a testing crash.
65. Kamui Kobayashi
(5.92 ppr, 2010-2012)

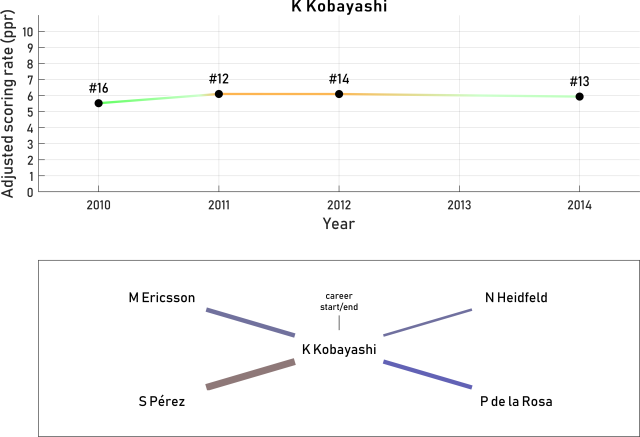
Kamui Kobayashi is remembered as an aggressive and opportunistic overtaker. He debuted for Toyota in the final two rounds of 2009, where he immediately impressed against teammate Jarno Trulli. In 2010, he continued his form, beating two veteran teammates. He beat the 39 year old Pedro de la Rosa (ranked 105th) 7-2 in counting races, 8-7 in qualifying, and 27-6 in points, including one additional race together in 2011; and Nick Heidfeld 3-1 in counting races, 4-1 in qualifying, and 11-6 in points.
In 2011, Kobayashi was joined at Sauber by the rookie Sergio Pérez. In their first season as teammates, Kobayashi was able to hold his own, scoring 7-5 in counting races, 7-11 in qualifying, and 14-14 in points. In the following season, Pérez appeared to have clearly greater pace, but was inconsistent between weekends, resulting in a closely balanced 9-8 in counting races, 9-10 in qualifying, and 60-66 in points.
After failing to find a seat in F1 for 2013, Kobayashi returned with Caterham team in 2014 alongside the rookie Marcus Ericsson. The head-to-head result was 5-3 in counting races, 7-3 in qualifying, and 0-0 in points. With Caterham folding at the end of the season, Kobayashi left F1 for good.
64. Mark Webber
(5.95 ppr, 2008-2010)
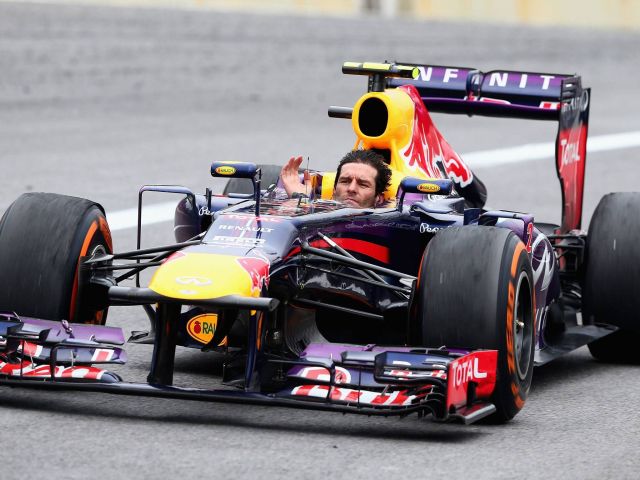

Mark Webber came within a hair’s breadth of winning a title for Red Bull in 2010. In subsequent years, he looked a distant number two to Sebastian Vettel. Was Vettel underperfoming in 2010 or was Webber briefly among the best drivers of the era? By the model’s estimation, the former is a far more probable explanation. While he was a solid performer, the model never sees Webber as a top 10 driver in the era he raced.
Always a qualifying ace, Webber made a name for himself with memorable low-fuel glory runs for Jaguar. Across his first four years in F1, Webber dominated a series of lowly rated teammates. He faced his first real challenge in 2005, when paired with Nick Heidfeld at Williams. Across their races together (before Heidfeld’s injuries), Webber scored 4-6 in counting races, 9-5 in qualifying, and 24-28 in points. The points total fell in Heidfeld’s favor despite Heidfeld losing more potential points to mechanical DNFs.
In 2006, Webber was paired with the rookie Nico Rosberg, whom he led 5-3 in counting races, 12-6 in qualifying, and 7-4 in points. Accounting for Webber’s age and experience advantage, the model considers this a result slightly in Rosberg’s favor (i.e., Rosberg would be expected to outperform Webber if at equivalent age and experience). Moving to Red Bull, Webber paired with David Coulthard for the final two seasons of Coulthard’s career. Webber held a clear edge, scoring 19-4 in counting races, 31-4 in qualifying, and 31-22 in points.
The final phase of Webber’s career began in 2009, when he was paired with the 21 year old Sebastian Vettel. Immediately, Webber appeared to have a major challenge on his hands, as Vettel brought the 2009 Red Bull into championship contention. In 2010, Webber was potentially on track for the title until his unforced error in Korea. Teammate Vettel had a quite imperfect season as well, narrowly taking the title at the final round in what the f1metrics model considers a dominant car that should have easily taken both titles, taking drivers out of the equation.
Beyond 2010, as Vettel came into his prime, Webber was largely a non-entity, despite driving championship-winning cars. While Vettel completely dominated the 2011 and 2013 seasons with 24 race victories, Webber finished 3rd in each championship, collecting just a single, lucky race victory when Vettel encountered gearbox issues at the 2011 Brazilian GP. Hampered by major off-season injuries and consistently poor starts in cars that were engineered to lead races not cut through traffic, Webber achieved close to what the model considers the bare minimum those Red Bulls were capable of achieving in the hands of any other driver on the grid.
63. Heikki Kovalainen
(6.03 ppr 2010-2012)
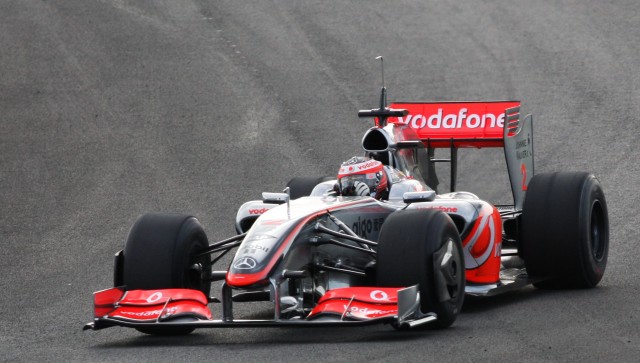

Given the appreciation these days for Lewis Hamilton as one of the all-time greats, Heikki Kovalainen’s performances perhaps deserve a reappraisal. Kovalainen was pilloried for his inability to get anywhere close to Hamilton at McLaren from 2008-2009. Yet, the model suggests many other drivers of the era, including Mark Webber, would have suffered a similar fate.
Kovalainen had a very promising rookie season, defeating the more experienced Giancarlo Fisichella 10-4 in counting races, 9-8 in qualifying, and 30-21 in points. In his second season, he was drafted to McLaren as a replacement for the suddenly outgoing Fernando Alonso, joining Lewis Hamilton in his own second season. Kovalainen’s failure to meaningfully challenge Hamilton effectively ended interest in him from top teams, as he was replaced for 2010 by Jenson Button.
Versus Hamilton, Kovalainen trailed by a median 0.13% of lap-time, better than the 0.28% of Jenson Button and the 0.19% of Valtteri Bottas, but worse than the 0.07% of Nico Rosberg and 0.05% of Fernando Alonso. But it should be noted that this comparison is made difficult by Kovalainen racing in the refueling era, with race fuel loads in qualifying. In counting races, Kovalainen scored 10-18 against Hamilton (ahead 36% of races), better than Bottas’ tally of 15-39 (28%), but worse than Button (43%), Rosberg (44%), and Alonso (59%). In summary, Kovalainen ranks behind all of Hamilton’s teammates except perhaps Bottas in a direct head-to-head comparison. Given the quality of that group, which contains three world champions, this is no major slight on Kovalainen.
62. Bruce McLaren
(6.04 ppr, 1963-1965)

Bruce McLaren was one of the finest drivers of the 1960s. Debuting in 1958, McLaren spent his first two full seasons (1959-1960) at Cooper alongside Jack Brabham, winning his first race in 1959 at age 22. Brabham won the drivers’ title on both occasions, though the younger, less experienced McLaren pushed Brabham hard for the 1960 title. McLaren’s overall record against Brabham across 1958-1961 was 5-10 in counting races, 3-22 in qualifying, and 64.5-75 in points.
McLaren continued to race for Cooper until 1965, while establishing his own racing team. Over this time period, the model rates McLaren among the top 3 performing drivers on the grid. However, Ferrari and Team Lotus were now the dominant forces. McLaren was no longer in the right place to challenge for titles. The team he founded continued to gain pace, ultimately becoming one of the most successful teams in F1 history, but Bruce was sadly killed in a testing crash in 1970, aged 32.
61. Eddie Cheever
(6.05 ppr, 1981-1983)


Note: Only 8 American drivers have completed the necessary seasons to have a 3-year peak. See the Honorable Mentions section for another highly rated American driver.
Previously the highest-rated American driver, Eddie Cheever is third under the new model rankings, slightly behind Mario Andretti and Dan Gurney. Cheever never won an F1 race, but in his defense he only spent one season in a car worthy of wins. His career mechanical DNF rate was 54%, the second highest of any driver in the top 100.
Although born in the US, Cheever grew up in Rome and took a traditional pathway through European single-seaters to reach F1. After a spell in the extremely unreliable and slow Osella and Theodore cars, he secured a full-time drive at Tyrrell for 1981, spending most of the season alongside the rookie Michele Alboreto. Cheever finished ahead 3-0 in counting races, 8-4 in qualifying, and 8-0 in points.
In 1982, Cheever joined Ligier, alongside Jacques Laffite. Cheever prevailed against his teammate 2-1 in counting races, 8-7 in qualifying, and 15-5 in points, finishing three times on the podium. It was a tumultuous season, and the model narrowly rates Cheever the season’s best performing driver, just ahead of Elio de Angelis, Nelson Piquet, and John Watson.
The 1983 season, racing alongside Alain Prost, provided Cheever a reality check. Cheever was beaten 1-4 in counting races, 2-13 in qualifying, and 22-57 in points (although Cheever suffered 8 mechanical DNFs to Prost’s 2). Cheever then slumped at Alfa Romeo from 1984-1985 in an incredibly unreliable and slow car, finishing only 7 races in 32 starts. He was beaten by teammate Riccardo Patrese over this period 1-4 in counting races, 12-20 in qualifying, and 3-8 in points. With no full-time drive for 1986, Cheever returned with Arrows alongside Derek Warwick from 1987-1989. Overall, the two drivers were closely matched, with Cheever scoring 10-9 in counting races, 12-34 in qualifying, and 20-27 in points.
60. Pierre Gasly
(6.06 ppr, 2017-2019)
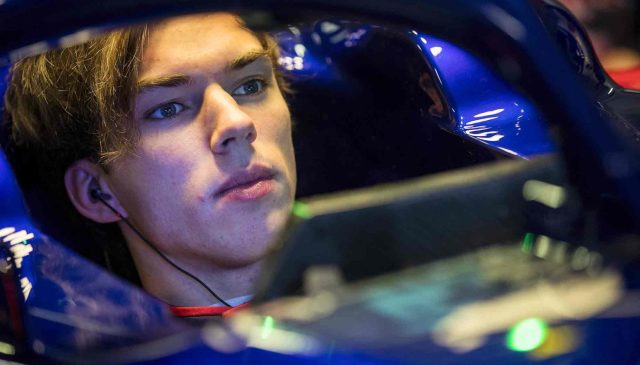

As a junior single-seater driver, Pierre Gasly was evidently very quick. His GP2 title ahead of Antonio Giovinazzi was enough to seal a Toro Rosso drive. Yet it was apparent that Gasly often had difficulties converting his pace to top-level results. For over two years as a junior, he went without winning a race, despite 4 poles, 12 podiums, and even finishing 2nd in the championship in one of those seasons. He could certainly produce strong results, but that killer instinct required to reach the pinnacle eluded him.
A related pattern seems to have emerged in Gasly’s driving since joining F1. In a midfield Toro Rosso car, Gasly consistently punches above his weight, driving deep into the points. His records against both Brendon Hartley (no ranking) and Daniil Kvyat are in the positive. Yet, given a potential race-winning car at Red Bull, Gasly utterly floundered. He was dominated by teammate Max Verstappen 1-10 in counting races, 1-10 in qualifying, and 63-181 in points. Gasly’s results against Kvyat will continue to inform his uncertain ranking.
59. Carlos Reutemann
(6.09 ppr, 1973-1975)


Always a bridesmaid, never a bride, Carlos Reutemann finished the championship in the top 3 four times, but never claimed a title. His potential impact on F1 was reduced by his relatively late start, as he did not race a car until he was already 23 and did not debut in F1 until he was a few months shy of 30.
Reutemann made an immediate impact in F1, with pole position in his first grand prix. Home fans were soon calling him the next Fangio. As a rookie, he showed strong pace against his 43-year-old teammate Graham Hill, scoring 2-1 in counting races, 9-1 in qualifying, and 3-4 in points. He also dominated fellow rookie teammate Wilson Fittipaldi (no ranking) across their first two seasons together.
From 1974-1976, Reutemann raced alongside the Brazilian hero Carlos Pace at Brabham. Both drivers were effectively at their peak. Reutemann proved generally the superior driver to Pace, scoring 10-6 in counting races, 15-17 in qualifying, and 63-39 in points. While 1974 was an extremely strong season for Reutemann, by 1976 he was disillusioned with the team’s switch to unreliable Alfa Romeo engines and negotiated his release.
In 1977, Reutemann moved to a full-time seat at Ferrari, joining Niki Lauda, after initially being signed to fill-in for the injured Lauda in 1976. Now pitted against the best driver on the grid, Reutemann was completely overshadowed. While Lauda stormed to the title, Reutemann finished 4th in the championship with only a single win. In head-to-head stats, Reutemann trailed Lauda 1-11 in counting races, 7-8 in qualifying, and 36-72 in points. For the last two races of 1977 and all of 1978, Reutemann was joined by the rookie Gilles Villeneuve. Reutemann saw off the challenge, beating Villeneuve 6-6 in counting races, 15-3 in qualifying, and 54-17 in points.
Reutemann moved from Ferrari to Lotus for 1979, which proved an unfortunate switch, as Lotus fell into sudden decline, while Ferrari delivered the year’s best car and a title for his replacement, Jody Scheckter. Reutemann was closely matched with reigning champion Mario Andretti, but neither were in the title battle. Against Andretti, Reutemann scored 2-3 in counting races, 7-8 in qualifying, and 20-14 in points. Reutemann was helped by a much lower mechanical DNF rate than Andretti (10 vs. 4), meaning Andretti scored more points per counting race.
Reutemann made a better strategic move in 1980, joining Williams just as they became a serious championship-winning force. However, he was signed on terms of being Alan Jones’ number two, an issue which led to considerable friction since the two drivers were closely matched. Although aged 38-40, Reutemann scored 9-12 in counting races, 16-13 in qualifying, and 98-117 in points. Reutemann came painfully close to a championship in 1981, missing out by a single point after leading going into the final round and starting on pole, hampered by gearbox problems in the race. After just two races with Williams in 1982, he abruptly retired due to ongoing disputes with the team. Williams went on to win that year’s drivers’ title with teammate Keke Rosberg, whom Reutemann was leading by 4 points when he quit.
58. Mario Andretti
(6.11 ppr, 1977-1979)


Just like Carlos Reutemann, Mario Andretti made an impressive debut, taking pole position for Lotus at the 1968 US GP. He continued to make occasional appearances in F1 over the following years, while racing in IndyCar, including a victory for Ferrari in only his eleventh start. It wasn’t until 1975 that Andretti committed to a full F1 season.
After an unsuccessful season racing as the sole entrant for Parnelli in 1975, Andretti moved to Lotus. From 1976-1977, he was paired with newcomer Gunnar Nilsson (no ranking), whom he beat 7-5 in counting races, 25-4 in qualifying, 68-31 in points.
Lotus had become a seriously competitive team again in 1977, with Andretti taking four wins and 3rd in the championship. In 1978, Lotus introduced the dominant ground-effect Lotus 79 model, which proved the year’s best car. Lotus also had a superb driver line-up, with Andretti alongside Ronnie Peterson. Peterson was considered the quicker driver by many, yet Andretti came out ahead 8-2 in counting races, 11-3 in qualifying, and 64-51 in points, although Peterson twice appeared to obey team orders by not challenging Andretti for the lead. Adjusting for the dominance of the car, Andretti is rated the 3rd best performing driver in 1978, the peak performance of his career.
Lotus were less competitive in 1979, meaning even Andretti and Carlos Reutemann could not finish higher than 12th and 7th in the championship, respectively. In 1980, Andretti was joined by Elio de Angelis in just his second F1 season. Andretti was often outpaced by de Angelis, scoring 3-2 in counting races, 6-8 in qualifying, and 1-13 in points. After a difficult season with Alfa Romeo in 1981, Andretti made only brief appearances for Ferrari and Williams in 1982 before closing the curtain on his F1 career to pursue IndyCar titles, winning one in 1984.
57. Jean Alesi
(6.12 ppr, 1991-1993)


The fact that Jean Alesi achieved only 1 win in his 201 starts is a grave injustice. His ratio of sixteen 2nd places to a single win is the highest among all race winners. The next highest is François Cevert with his ten 2nd places and a single win.
After success in junior series, Alesi finished 4th on debut for Tyrrell and immediately dominated his more experienced teammate Jonathan Palmer (ranked 121st) 3-0 in counting races, 6-2 in qualifying, and 8-0 in points. Alesi’s star continued to rise in 1990 when he twice finished 2nd — including a memorable duel with Ayrton Senna at Phoenix — and again dominated his teammate, this time Satoru Nakajima (ranked 141st) by 6-2 in counting races, 15-1 in qualifying, and 13-3 in points.
Tyrrell, Williams, and Ferrari were all interested in signing Alesi for 1991. Ultimately, with the help of Nelson Piquet in negotiating a contract, Alesi replaced Nigel Mansell at Ferrari, while Mansell moved to Williams. Mansell’s move was fortuitous, as Williams delivered a top car, while Ferrari’s performance dipped. Alesi was beaten by teammate Alain Prost 4-2 in counting races, 13-2 in qualifying, and 34-21 in points. Ferrari’s performance drastically declined in 1992, but Alesi impressed with consistent points, beating teammate Ivan Capelli (ranked 112th) 2-1 in counting races, 13-1 in qualifying, and 18-3 in points. The old f1metrics model rated Alesi the best performer in 1992; he is now rated the 2nd best performer, due to the more robust scoring method.
From 1993-1997, Alesi partnered Gerhard Berger, first at Ferrari, then at Benetton. The two formed one of the closest partnerships in Formula 1. Across their 77 races together, Alesi’s record vs. Berger was 19-22 in counting races, 42-35 in qualifying, and 151-126 in points. Within this period, 1993 and 1996 are rated Alesi’s two strongest seasons. Alesi had a poor season in 1994 after a severe injury in testing.
The final years of Alesi’s career were spent racing for Sauber, Prost, and Jordan. By the model’s estimation, 1998-1999 was one of the strongest periods of Alesi’s career, as he outperformed first Johnny Herbert and then Pedro Diniz.
56. Stefano Modena
(6.14 ppr, 1990-1992)


Stefano Modena was an extraordinary natural talent, likened to Jean Alesi and Ayrton Senna when he first arrived in the sport. By the model’s estimation, he would have been a good match for Alesi in equal machinery. However, he never escaped the lower midfield to show his true potential in a top car.
After a rookie title win in F3000, Modena was given a one-off drive for Brabham in the last round of 1987. He retired from physical exhaustion, unable to handle the heavier controls and more powerful car. His first full season was for the backmarker EuroBrun team. Both drivers struggled to escape prequalifying, but Modena outqualified his teammate Oscar Larrauri (no ranking) 10-2. A return to Brabham placed Modena alongside the more experienced Martin Brundle. The two drivers were very closely matched. Modena outqualified Brundle 9-7, while the two were equal 3-3 in counting races and 4-4 in points, Modena’s points courtesy of a brilliant 3rd place at Monaco. In 1990, Brabham were less competitive, with Modena taking the team’s only points. He dominated teammate David Brabham (no ranking) 14-0 in qualifying, averaging over 1 second per lap faster.
A move to Tyrrell for 1991 brought occasionally competitive machinery. Modena dragged the car to 8th in the championship, finishing 2nd in Canada, and thrashing teammate Satoru Nakajima (ranked 141st) 8-0 in counting races, 15-1 in qualifying, and 10-2 in points. Modena then made a regrettable move to Jordan for 1992. The new Jordan 192 chassis was catastrophically bad, with the two drivers finishing only 9 times in the season. Modena was beaten 9-7 in qualifying by teammate Mauricio Gugelmin, and even failed to qualify four times. However, Modena scored 2-2 in counting races and 1-0 in points, scoring the team’s only point with a valuable 6th place in the final round. Unable to find any competitive drives in F1, Modena moved on to DTM.
55. Mika Salo
(6.22 ppr, 1995-1997)


In the previous f1metrics all-time ranking list, Mika Salo appeared at rank #53, slightly ahead of his fellow countryman Mika Häkkinen at #56. Häkkinen’s position has improved with the newest refinements to the model, whereas Salo remains in a similar position.
While Salo never faced a truly elite teammate, his results against the competition he had were extremely strong. In the top 10 list of most one-sided teammate battles in F1 history, for drivers who spent at least 15 counting races together (see Table in Fernando Alonso’s entry), Mika Salo appears twice. Once for beating Ukyo Katayama (ranked 134th) 13-2 in counting races, 23-9 in qualifying, and 10-0 in points. The other for beating Pedro Diniz 13-2 in counting races, 22-11 in qualifying, and 9-6 in points. In addition, he beat Jos Verstappen (ranked 109th) 6-0 in counting races, 10-7 in qualifying, and 2-0 in points.
Salo is rated by the model among the top 5 performers in four years of his F1 career. With access to a top car, the model predicts Salo could have been at least as competitive as Damon Hill, Jean Alesi, and Gerhard Berger. Unfortunately, Salo’s F1 career was severely delayed by a drink-driving charge in 1990, without which he might have more rapidly escaped the midfield like his F3 rival Häkkinen. Instead, Salo made only a brief appearance for Ferrari, filling in for the injured Michael Schumacher, where he gave away his one chance at a race victory to support teammate Eddie Irvine’s championship campaign.
54. Dan Gurney
(6.22 ppr, 1961-1963)
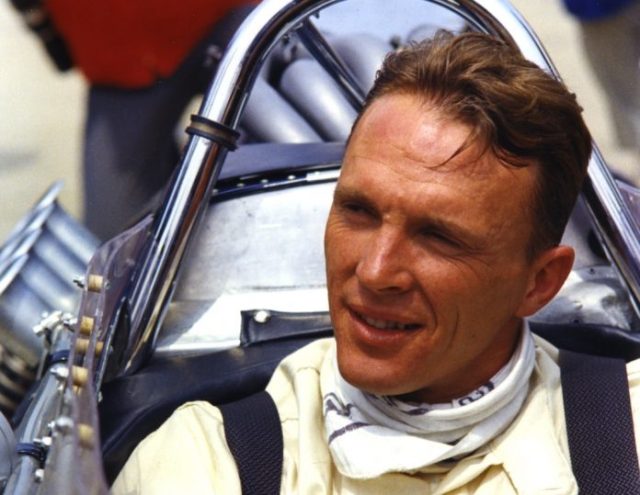

Dan Gurney never quite made a serious challenge for the WDC, but he was just as quick as title winners of the era and his abilities were deeply respected by his peers. His career began at Ferrari in 1959 before a move to BRM alongside Graham Hill and Jo Bonnier (ranked 102nd) in 1960. While he was initially outperformed by Hill, 1961 saw an improvement in form, as Gurney dominated Bonnier at Porsche. He carried this momentum into 1962, again outperforming Bonnier. Across 1960-1962, he beat Bonnier 6-2 in counting races, 13-9 in qualifying, and 36-10 in points.
From 1963-1965, Gurney demonstrated his potential by facing and beating double-champion Jack Brabham 5-5 in counting races, 19-7 in qualifying, and 54-34 in points. Gurney was also joined by the rookie Denny Hulme in 1965, beating him 1-0 in counting races, 5-0 in qualifying, and 13-5 in points.
Gurney left to start his own team with the new 1966 regulations, just as the Brabham team became front-runners, carrying Brabham and Hulme to titles. The model predicts that Gurney would have been favorite to take both the 1966 and 1967 titles, had he remained at Brabham. Gurney spent 1966-1967 as sole driver at his new team, with a crippling 14 mechanical DNFs in 19 starts. In the remaining five races, he finished four in the points, including a win at the 1967 Belgian GP. Thereafter, Gurney made only occasional race appearances in F1.
One of Gurney’s key attributes was his incredibly clean driving. In 86 starts, he had only two crash-related DNFs, one of those in wet conditions. His crash rate of just 1.4% in the dry is the lowest of any driver who started at least 50 races (see the Table in Jackie Stewart’s entry below for rankings).
53. Giancarlo Fisichella
(6.24 ppr, 1999-2001)


Fisichella was tipped for championships early in his career, the claim being that he needed only a great car to show off his talent. This reputation was cultivated by positive results against Pedro Lamy (ranked 126th), Ralf Schumacher, Jenson Button, Alex Wurz (ranked 111th), Takuma Sato (ranked 124th), and Ralph Firman (no ranking). However, none of these drivers had faced another teammate for a full season before facing Fisichella, and most of them were rookies. This made it difficult to objectively assess Fisichella’s potential against the recognized top drivers in the field. By the model’s estimates, Fisichella was never among the absolute elite, but at his best (in the period 2000-2001), he was a top 6 driver.
In 2005, Fisichella finally got his big chance to drive in a championship-worthy car, pairing with one of the sport’s best, Fernando Alonso. In Fisichella’s own words,
“This year I have the best car in my career, and hopefully I can show people who say I am the best that they are right.” – Giancarlo Fisichella
Unfortunately, Fisichella proved completely unable to get on terms with Alonso, trailing 5-26 in counting races, 11-26 in qualifying, and 130-267 in points. Unlike the higher rated Jarno Trulli, who had posed Alonso some serious challenges, Fisichella lived in the number one driver’s shadow.
Fisichella continued to struggle at Renault in 2007, being beaten by the rookie Heikki Kovalainen 4-10 in counting races, 8-9 in qualifying, and 21-30 in points. In 2008 and 2009, Fisichella partnered Adrian Sutil at Force India. Fisichella beat Sutil 12-8 in counting races, 16-14 in qualifying, and 8-0 in points. Following Felipe Massa’s accident, Fisichella had a brief but disappointing appearance with Ferrari to end his F1 career.
52. Daniil Kvyat
(6.28 ppr, 2015-2017)


Daniil Kvyat is the canonical example of what happens when a junior driver program sets its sights on finding only generational talents, discarding anyone else along the way. The maxim of Helmut Marko has always been to find great at the cost of good. This means rapid promotions from junior categories, rapid promotions from Toro Rosso to Red Bull if drivers are performing, and callous demotions if they do not continue to follow the expected trajectory. Kvyat has experienced every part of that arc.
Following an impressive rookie title in GP3, Kvyat was promoted straight to F1, alongside Jean-Eric Vergne. Although outscored 8-22, Kvyat demonstrated clear potential against a more experienced teammate, scoring 6-6 in counting races and 12-7 in qualifying. With Sebastian Vettel unexpectedly leaving Red Bull, Kvyat was promoted ahead of Vergne, with Marko pursuing potential over proven competence.
As teammate to Daniel Ricciardo, Kvyat delivered a very respectable first season. Ricciardo’s stronger pace was not translated due to a messy season, meaning Kvyat outscored the Australian 95-92. However, Kvyat failed to deliver the expected constant upward trajectory in 2016. Even in China, where a podium for Kvyat appeared to be a saving grace, he had averaged approximately half a second per lap slower than Ricciardo in phases of the race where a fair comparison could be made. An accident-strewn race in Russia was the final straw. Red Bull shockingly demoted Kvyat to Toro Rosso. Kvyat appeared a broken driver, desperately struggling alongside Carlos Sainz, who beat him 5-17 in counting races, 12-18 in qualifying, and 8-90 in points.
After a year out of F1, Kvyat was called back to Toro Rosso for 2019, starting the season alongside the rookie Alex Albon (no ranking). Kvyat scored 7-5 in counting races, 5-6 in qualifying, and 27-16 in points, achieving the points advantage with a lucky podium in Germany. Red Bull promoted Albon mid-season, leaving Kvyat in limbo at Toro Rosso.
51. Timo Glock
(6.33 ppr, 2010-2012)
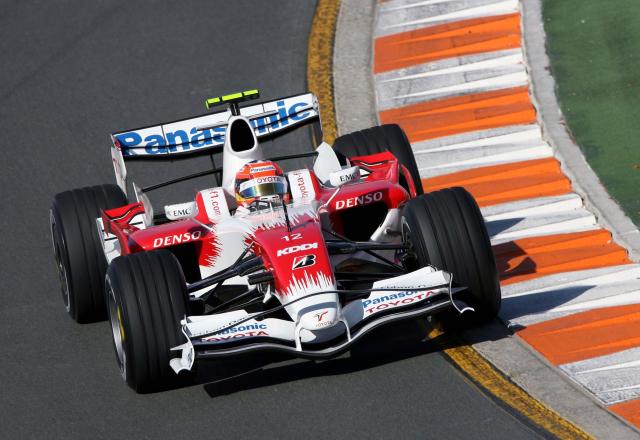
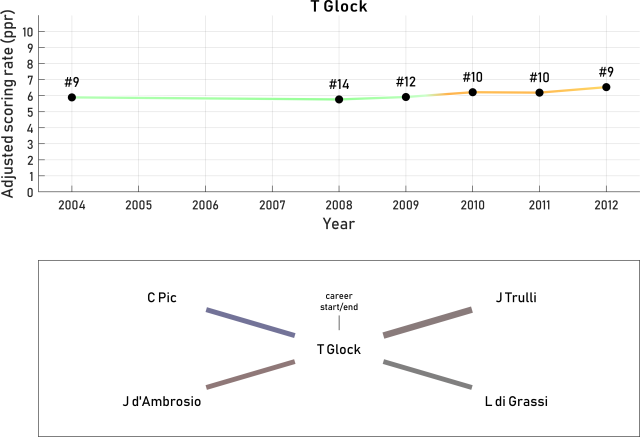
Glock had an unusual F1 career. After a great success in junior series, he was signed as test driver for Jordan in 2004. When regular driver Giorgio Pantano (no ranking) failed to impress, Glock made a four-race appearance, with 7th on debut ahead of teammate Nick Heidfeld.
Without a regular F1 seat for 2005, Glock spent the year in Champ Car. In 2006 and 2007, he competed in GP2, winning the title on the latter attempt. In 2008, he returned to F1, alongside the prodigiously fast Jarno Trulli at Toyota. Trulli dominated qualifying 4-14, but Glock’s race pace was competitive, scoring 7-9 in counting races and 25-31 in points. In 2009, Trulli again outqualified Glock, this time 4-11, but Glock held the advantage 8-5 in counting races and 24-22.5 in points.
Glock crashed very heavily in qualifying for the 2009 Japanese GP, causing leg and back injuries, ending his season prematurely. This event, combined with Toyota pulling out of F1, put his career into a downward spiral. With an uncertain future in F1, Glock raced for backmarkers Virgin and Marussia across 2010-2012. Although he finished no higher than 12th in a race in this period, he had the edge on each of his teammates. In 2010, he beat Lucas di Grassi (no ranking) 4-3 in counting races and 17-2 in qualifying. In 2011, he beat Jerome d’Ambrosio (no ranking) 7-6 in counting races and 14-5 in qualifying. In 2012, he beat Charles Pic (no ranking) 7-5 in counting races and 14-5 in qualifying.
50. Jean-Eric Vergne
(6.35 ppr, 2012-2014)

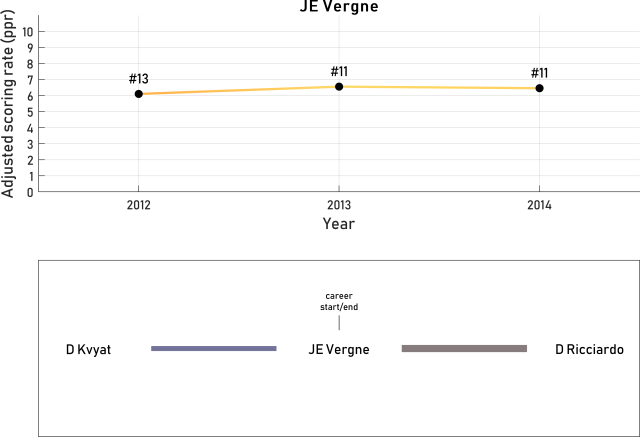
Jean-Eric Vergne was a close competitor with Daniel Ricciardo through the junior ranks, with less than a year between their F1 debuts. Racing together at Toro Rosso, Ricciardo was clearly the quicker driver over one lap, whereas Vergne’s race pace often brought him back into contention on Sundays. Vergne’s overall tally against Ricciardo was 12-17 in counting races, 10-29 in qualifying, and 29-30 in points.
When Ricciardo narrowly got the nod ahead of Vergne for the 2014 Red Bull seat, there were many who felt the less experienced Vergne had been hard done by. Yet Ricciardo’s incredible 2014 season, combined with Vergne’s mixed performance against his rookie teammate Daniil Kvyat, seemed to suggest Red Bull had chosen correctly. The overall tally against Kvyat was 6-6 in counting races, 7-12 in qualifying, and 22-8 in points. Left without a 2015 seat as Carlos Sainz and Max Verstappen joined Toro Rosso, Vergne has gone on to a very successful Formula E career, winning two consecutive titles.
Previously, the f1metrics model ranked Vergne very highly, just behind Ricciardo. Now that the model considers Kvyat’s age and experience in 2014, along with further data on Kvyat’s performances, Vergne’s rating has fallen. Vergne is notably, however, still ranked higher than some of the Red Bull graduates who have followed him, including Daniil Kvyat and Pierre Gasly.
49. Graham Hill
(6.40 ppr, 1964-1966)

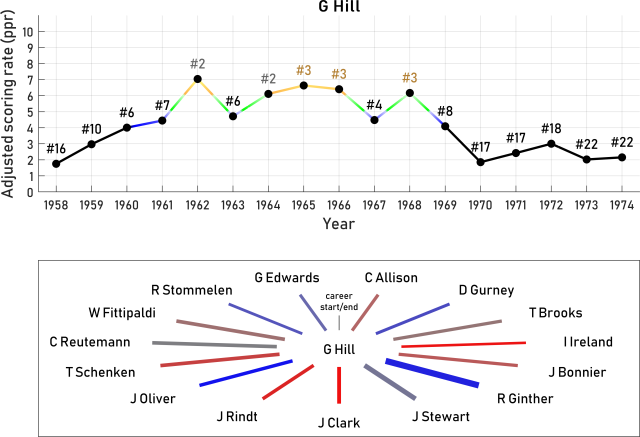
Rated the fourth best driver of the 1960s, Graham Hill was undoubtedly much better than the majority of his peers, but fell short of the true virtuosos of the era: Jim Clark, Stirling Moss, Jackie Stewart, and later Jochen Rindt. Hill faced three of those drivers in equal equipment during his career. Against Clark he scored 0-2 in counting races and 3-8 in qualifying. Against Stewart (in Stewart’s first two seasons) he had the advantage of experience and was closely matched, 5-5 in counting races and 11-7 in qualifying. Against Rindt, he scored 0-2 in counting races and 0-9 in qualifying.
Hill’s career was lengthy, continuing out to the age of 45, and his results in later years were understandably not as strong. Among other teammates he faced for multiple counting races in equal equipment before the age of 40 were Tony Brooks and Richie Ginther. Against Tony Brooks (ranked 108th), he scored 1-1 in counting races and 6-2 in qualifying. Against Richie Ginther (ranked 147th), he was dominant, scoring 15-3 in counting races and 28-1 in qualifying.
48. Nigel Mansell
(6.42 ppr, 1989-1991)


When Nigel Mansell intended to leave the sport in 1990, following his retirement announcement, he had scored just 16 wins, having narrowly failed to win titles with dominant cars in both 1986 and 1987. By signing with Williams for another two years, as contractual number one to teammate Riccardo Patrese, Mansell rapidly doubled his career win tally, reaping the benefits of the dominant FW14B to finally score his first title.
Mansell was a polarizing figure within the paddock, but widely admired by fans as a dogged and fearless performer who was always willing to take chances. A parallel to Juan Pablo Montoya can be easily drawn. Although Mansell is always very highly rated by fans, he is consistently lower rated by models. For most of his career, the new f1metrics model sees Mansell as consistently the 3rd to 5th best driver on the grid.
Mansell began his career at Lotus in 1980, racing alongside the slightly more experienced Elio de Angelis until 1984. The only year in which Mansell outscored de Angelis was 1983, when de Angelis suffered 12 mechanical DNFs in 15 rounds to Mansell’s 4. Overall, Mansell was beaten 6-12 in counting races, 15-46 in qualifying, and 38-76 in points.
In 1985, Mansell moved to Williams. In his first season there, he was closely matched with teammate Keke Rosberg, scoring 5-2 in counting races, 7-9 in qualifying, and 31-40 in points. From 1986-1987, Mansell raced with Nelson Piquet, scoring 11-8 in counting races, 17-13 in qualifying, and 124-145 in points. He faced an easier task beating Riccardo Patrese in 1988 and from 1991-1992, scoring 20-5 in counting races, 34-12 in qualifying, and 192-117 in points.
Mansell spent 1989-1990 at Ferrari. Against Gerhard Berger in 1989, he scored 2-1 in counting races, 7-7 in qualifying, and 38-15 in points. Against Alain Prost in 1990, fortunes were reversed, scoring 3-4 in counting races, 8-8 in qualifying, and 37-73 in points.
47. John Watson
(6.43 ppr, 1979-1981)


John Watson’s new all-time ranking is one of the most dramatic changes from the original f1metrics list, where he was rated a surprisingly high #15, ahead of Alain Prost. I wrote at the time,
In 1997, a panel of experts assembled by F1 Racing magazine rated Watson 61st. There are good reasons to think that the model has overrated Watson and that experts have underrated Watson — the truth likely lies somewhere in the middle.
The new model appears to have struck such a balance.
As I have noted previously, Watson was a beneficiary of facing Niki Lauda on return from a two-year career break, as well as Alain Prost in his rookie season. Now that the model takes age and experience into account, it sees that Lauda and Prost would not have been at their peak in these periods, lowering its estimate of Watson’s performances accordingly.
Nevertheless, Watson is rated among the best drivers on the grid at his peak. He is placed among the top 5 drivers for four of the five years from 1979-1983. Watson’s career ended abruptly at the end of 1983, aged 37, when contract negotiations broke down with McLaren and Brabham.
46. Lance Stroll
(6.47 ppr, 2017-2019)
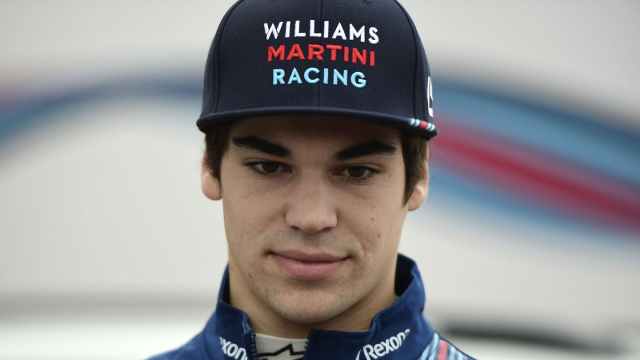

Lance Stroll currently ranks #46 in the all-time list, slightly ahead of contemporaries Pierre Gasly and Daniil Kvyat. As for any driver with a short career and an uneven distribution of race results, this should be taken with a fairly high degree of uncertainty, pending more data. As a rookie, Stroll clearly struggled against the veteran Felipe Massa, losing 5-11 in counting races, 2-17 in qualifying, and 40-43 in points. As I have noted previously, Stroll’s season was rescued to a large extent by a lucky podium, gained after his teammate encountered mechanical trouble while running ahead.
In 2018, Stroll was paired with the rookie Sergei Sirotkin (no ranking), scoring 10-8 in counting races, 8-12 in qualifying, and 6-1 in points. Consistent with his other seasons, Stroll demonstrated poor performance over a single lap, but offset this with his success in gaining places on the first lap. As far as the model goes, this season was uninformative for Stroll’s rating, since Sirotkin was an unknown.
In 2019, Stroll faced his strongest competition to date in Sergio Pérez. Whilst not embarrassed by this comparison, it clearly highlighted Stroll’s current limitations and areas that he will need to improve if he wants to become one of the sport’s stronger drivers. Still aged 20, there is potential for Stroll to improve. And, at least for now, he has the unusual safety net of his father partly owning the team for which he races.
45. Mika Häkkinen
(6.48 ppr, 1998-2000)


Mika Häkkinen is rated slightly higher by the new model than his rank of #56 by the original f1metrics model. This improvement can be largely attributed to the model taking Häkkinen’s relative inexperience into account against Johnny Herbert in his first two seasons of F1.
As before, the model sees Häkkinen as one of a group of drivers in the 1990s who occupied a class that was vying for the top 5, but clearly below Michael Schumacher. Although he was Schumacher’s chief rival in the late 1990s, the model concludes that this fight was mostly sustained by Häkkinen’s superior, Newey-designed equipment, much as Damon Hill and Jacques Villeneuve were sustained by their dominant cars at Williams.
Häkkinen’s record against David Coulthard (35-26 in counting races, 68-31 in qualifying) was much less one-sided than Schumacher’s records against Eddie Irvine (38-7 in counting races, 55-4 in qualifying), Rubens Barrichello (62-16 in counting races, 79-25 in qualifying), and Felipe Massa (12-3 in counting races, 14-4 in qualifying), all drivers that the model rates somewhat higher than Coulthard. Notably, Kimi Räikkönen also held a superior record against David Coulthard (19-7 in counting races, 32-19 in qualifying), which contributes to Häkkinen being rated lower than Räikkönen.
Schumacher and Häkkinen shared two common teammates during their F1 careers: Martin Brundle and Johnny Herbert. The results of these comparisons weigh more in Schumacher’s favor. Brundle faced Häkkinen in Häkkinen’s third full season, whereas he faced Schumacher in Schumacher’s first full season. Häkkinen beat Brundle 5-1 in counting races and 15-0 in qualifying, with an average time difference of 0.85%. Schumacher beat Brundle 6-4 in counting races and 16-0 in qualifying, with an average time difference of 1.30%. Herbert faced Häkkinen in Häkkinen’s first two seasons, whereas he faced Schumacher in Schumacher’s third and fourth full seasons. Häkkinen beat Herbert 7-2 in counting races, but was behind 10-14 in qualifying. Schumacher beat Herbert 12-3 in counting races and 18-1 in qualifying.
44. Alan Jones
(6.48 ppr, 1978-1980)

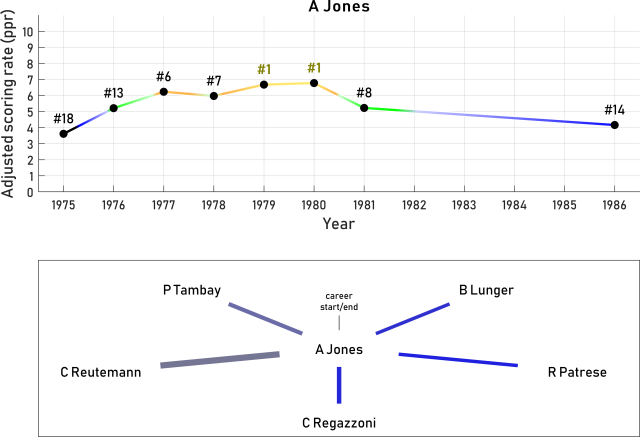
Alan Jones was previously rated #22 by the f1metrics model, making him the highest rated Australian driver. He has now lost that mantle to Daniel Ricciardo. This change can be chiefly attributed to the model now factoring in the older age of Jones’ teammate Carlos Reutemann, the only teammate that Jones faced for more than 7 counting races. Jones raced alongside Reutemann at Williams in the years 1980-1981, as they fought viciously for drivers’ titles. During this time, Reutemann was aged 38-40, significantly past the peak driver performance, whereas Jones was aged 34-36. Had Reutemann been 4 years younger, the model sees him as the clear favorite for the 1981 title, and putting up at least a stiffer fight in 1980.
At his peak, the model sees Jones as the best driver on the grid, ranking him the top performer in both 1979 and 1980. This was a relatively fallow period, during Niki Lauda‘s first retirement and before Alain Prost, Nelson Piquet, Elio de Angelis, Nigel Mansell, and Keke Rosberg had reached their best. Nevertheless, it was an impressive period of high-level performance from Jones, which helped bring Williams into its period of great success.
Jones’ ill-conceived comeback for Haas aged almost 40 is rated much lower by the model than his peak period, but commensurate with his age and lack of recent experience.
43. Marcus Ericsson
(6.50 ppr, 2016-2018)


Marcus Ericsson has a relatively high rating compared to where common wisdom (and my own subjective judgment) would place him. Like Lance Stroll above, the rating is based on a small amount of data, and is still actively fluctuating, varying by over 20 places across races within the 2019 season, as graphed below.

Evolution in Marcus Ericsson’s all-time ranking across the 2019 season, showing high volatility compared to almost all other drivers. Current up to round 17 (Japan 2019).
Teammate Felipe Nasr (no ranking) only ever raced alongside Ericsson, meaning he provides no independent information regarding Ericsson’s level. Ericsson’s teammate Pascal Wehrlein (no ranking) raced half a season alongside Esteban Ocon, but is otherwise not connected via teammates to the rest of the grid.
Ericsson’s rating prior to 2019 was therefore based largely on his rookie season with Kamui Kobayashi. Against Kobayashi, Ericsson was beaten 2-5 in counting races and 4-10 in qualifying, with neither driver scoring points in the uncompetitive Caterham CT05. Kobayashi was clearly the better performer, although Ericsson delivered an impressive 11th place at Monaco and seemed to relatively gain on Kobayashi towards the end of the season as he gained experience.
Against Charles Leclerc (no ranking), Ericsson was beaten 6-10 in counting races, 4-14 in qualifying, and 9-39 in points. In view of Leclerc’s impressive performance alongside Sebastian Vettel in 2019 at Ferrari, the model views Ericsson’s performance in 2018 as solid, even considering Leclerc’s rookie status. A more confident ranking of Ericsson should emerge in coming years as Leclerc’s level becomes better characterized.
Addendum: Due to the many graphs and tables, preparation of this top 100 list had to begin several weeks in advance, meaning no new data were input after Japan 2019. However, a check of the model rankings after Brazil 2019 confirms that Ericsson’s rating continues to evolve, falling to 48th. In parallel, Stroll’s rating fell to 49th, while Gasly’s moved up to 38th, indicating high volatility of their current rankings. No other drivers’ ratings in the top 100 changed by more than three positions.
42. Ronnie Peterson
(6.50 ppr, 1971-1973)


During his F1 career, Ronnie Peterson was widely considered one of the greatest raw talents in the sport’s history. His exceptional car control and devastating qualifying pace made him an obvious fan favorite. At his peak (1971-1974), the model sees Peterson as one of the best on the grid. In this period, he dominated the rookie Niki Lauda 6-1 in counting races, 10-2 in qualifying, and 12-0 in points. He closely matched reigning world champion Emerson Fittipaldi 3-3 in counting races, 11-4 in qualifying, and 52-55 in points (despite worse reliability). Across 1974-1975, he also dominated Jacky Ickx 7-3 in counting races, 21-3 in qualifying, and 38-15 in points.
From the mid-1970s onwards, Peterson’s driving performance clearly tailed off. In 1977, racing the uncompetitive Tyrrell P34B, he scored against teammate Patrick Depailler 3-2 in counting races, 8-9 in qualifying, and 7-20 in points. The following season, in the dominant Lotus, he was a clear number two to Mario Andretti, beaten 2-8 in counting races, 3-11 in qualifying, and 51-64 in points, before he sadly died following an injury sustained at the 1978 Italian GP.
Peterson’s decline cannot really be attributed to age. In 1975 he was still just 31 years old. The shift in his performances could plausibly be linked to the rapidly increasing levels of downforce as teams began to exploit ground effects to a larger and larger degree. As a driver who clearly enjoyed racing at large slip angles, this shift may have hurt his performance more than others.
41. Juan Pablo Montoya
(6.50 ppr, 2002-2004)


A love of oversteer and a willingness to take risks in wheel-to-wheel combat made Juan Pablo Montoya an immediate fan favorite. Montoya had a successful junior career, finishing a close runner-up to Ricardo Zonta (no ranking) in his rookie F3000 season, and beating Nick Heidfeld to the title in an epic contest the following year. While Montoya looked set for a 1999 seat at Williams, a driver swap with Alex Zanardi (no ranking) saw him move to CART, where he won the title as a rookie.
In 2001, Montoya returned to Williams as a replacement for Jenson Button, partnering Ralf Schumacher there for four seasons. Although Ralf was entering his fifth F1 season, the pair proved to be closely matched. The model takes this as evidence that Montoya was a superior driver to Ralf.
Both Williams drivers were presented with a potential shot at the championship in 2003, when they had clearly the most powerful engine, and the model thinks the best package overall. While each Williams driver had periods of excellence, neither was consistent enough to capitalize on the opportunity. Montoya’s 2003 season is rated the best of his career, though he made key errors at the beginning and end of the season, and was genuinely outpaced by Ralf during Williams’ most competitive spell in the middle of the season.
In 2005, Montoya moved to McLaren, where he was immediately presented with the year’s quickest car. However, he struggled to keep pace with Kimi Räikkönen, and any chance at the title disintegrated when he missed two races due to a recreational injury. In 2006, Montoya continued to trail Räikkönen and he was dropped midway through the season after crashing into the back of his teammate at the start of the US GP. Overall, he was beaten by Räikkönen 7-10 in counting races, 8-19 in qualifying, and 86-145 in points.
Montoya is sometimes considered a driver who was denied a chance of showing his true potential in F1. In reality, he was a strong driver who was measured against other well-known benchmarks and did not quite rise to greatness when opportunities to succeed at top teams arose.
40. Keke Rosberg
(6.51 ppr, 1983-1985)


Keke Rosberg won the championship under perhaps the strangest circumstances in Formula 1 history, winning only 1 race in the season. Across his career, he took 5 wins in total, but this was a poor reflection of his talent.
Rosberg proved his potential in 1980 by beating Emerson Fittipaldi 3-2 in counting races, 10-4 in qualifying, and 6-5 in points. In 1981, the Fittipaldi car was an abomination, with both drivers struggling to qualify. Race results were near to meaningless, but Rosberg outqualified teammate Chico Serra 14-0. After further impressing the Williams team in testing, he was hired in 1982 to fill the seat vacated by Alan Jones. When Carlos Reutemann unexpectedly quit after two races, Rosberg became the team leader. This set Rosberg on course to score an improbable drivers’ title, as the dominant Ferrari team took the constructors’ title but lost the drivers’ title due to Gilles Villeneuve’s death and Didier Pironi’s career-ending injury. Across the year, Rosberg dominated teammate Derek Daly (ranked 156th) 9-1 in counting races, 12-1 in qualifying, and 42-8 in points.
Rosberg continued at Williams with Jacques Laffite from 1983-1984 (now aged 39-41), beating him 9-2 in counting races, 27-3 in qualifying, and 47.5-16 in points. In 1985, Rosberg partnered with Nigel Mansell. Overall, the pair were closely matched, with Rosberg scoring 2-5 in counting races, 9-7 in qualifying, and 40-31 in points, despite 7 mechanical DNFs to Mansell’s 5.
In his final year, Rosberg raced alongside Alain Prost at McLaren. The more calculating Prost dominated Rosberg 5-1 in counting races, 12-4 in qualifying, and 74-22 in total points. In Rosberg’s view, the car had too much understeer for him to tame it. In Prost’s view, Rosberg “didn’t have quite the necessary finesse to get the very best out of the turbocharged fuel consumption era of racing we were in at the time”.
39. Giuseppe Farina
(6.51 ppr, 1950-1952)
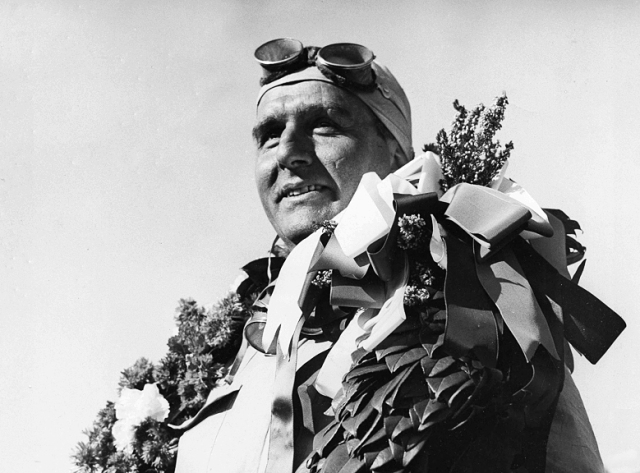

Farina, the first World Drivers’ Champion, has risen from 85th in the original driver rankings to just inside the top 50. Considering Farina was already 43 years old in 1950, meaning we never saw his true peak years during the World Drivers’ Championship, this is an impressive ranking. Had he been ten years younger, the model speculates that Farina could have been closely matched with Juan Manuel Fangio as one of the all-time greats. As it was, Fangio had a clear edge during their time as teammates, as Farina trailed 1-5 in counting races and 2-11 in qualifying. Farina’s 1950 title itself was largely a product of fortunate reliability compared to teammate Fangio across a short, six-race F1 season.
By the time Farina faced the other great driver of the era, the much younger Alberto Ascari, Farina was aged 45-47 and clearly past his peak, losing 2-11 in counting races and 2-13 in qualifying. Farina’s one-sided positive results against other strong drivers of the era in equal equipment demonstrate his quality. Against Piero Taruffi (no ranking), he was ahead 5-1 in counting races and 7-0 in qualifying. Against Luigi Villoresi (no ranking), he was ahead 5-2 in counting races and 7-3 in qualifying. And against fellow champion Mike Hawthorn, he was ahead 6-2 in counting races and 10-1 in qualifying.
38. Jarno Trulli
(6.52 ppr, 2002-2004)


Jarno Trulli at his peak was one of the fastest qualifiers in F1 history. He beat every teammate he faced in qualifying, including Fernando Alonso, until his uninspired final stint with Lotus alongside Heikki Kovalainen, during which he severely struggled with the car’s power-steering system.

Even in an era in which overtaking was exceedingly difficult, Trulli’s qualifying talent was not typically enough to compensate for deficits in his ability to maintain a consistent race pace. Overall, he beat his teammates 161-96 in qualifying (148-72 excluding his final Lotus spell), but went 73-70 against them in counting races. A very respectable record given the quality of his teammates, but not a match for his Senna-esque qualifying performances. As testament to his relatively higher qualifying than race pace, of all drivers to have won a race, Trulli maintains the greatest ratio of poles to wins, with 4 poles and 1 win.
Trulli’s career high-point was undoubtedly his 2004 season, which also proved a career turning point. In 2003, facing the less experienced Fernando Alonso, Trulli was beaten 2-7 in counting races, 8-8 in qualifying, and 33-55 in points. In 2004, Trulli bounced back to challenge Alonso 6-4 in counting races, 8-7 in qualifying, and 46-50 in points. Trulli was sacked by Flavio Briatore (team manager and Alonso’s manager) before the end of the season, supposedly as a result of Trulli’s last-lap error on the team’s home soil in the French GP, but competitive tension with his teammate surely played into the decision. Trulli spent the remainder of his career with Toyota and Lotus.
37. Jacques Villeneuve
(6.55 ppr, 2000-2002)
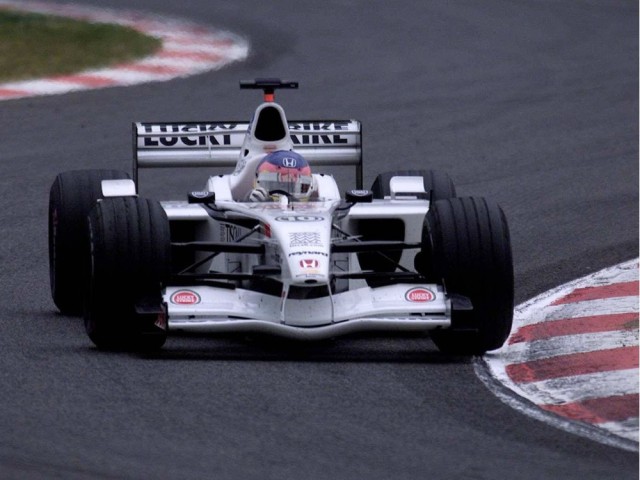

Jacques Villeneuve’s career was one of three acts. In the first act (his first three seasons), he raced for Williams, landing immediately in the spotlight as Williams competed for titles in 1996 and 1997. In the second act, he gave away a seat at a top team to race for the BAR team, which was co-founded by his personal manager Craig Pollock. At BAR he toiled away in the midfield for five seasons, delivering some of his best driving performances but only reaching the podium twice. In the third act, he lost the faith of his own team and floated from Renault to Sauber, looking nothing like the driver that had once been among the best on the grid.
In his first year at Williams, Villeneuve surprised incumbent teammate Damon Hill by taking the championship fight to the final round. In 1997, Williams was still the best car, but not by quite the same margin as it had been in 1996. Hill had been replaced by Heinz-Harald Frentzen, who was being touted as the next Michael Schumacher.
“When Williams signed him, they signed him to be the next champion, and that’s how they promoted it. That was enough to just make me mean. At that point I just knew that I had to destroy him. And that’s what I did. I didn’t want to fight him in the championship, as I had to fight Michael [Schumacher].” – Jacques Villeneuve
Villeneuve turned opinion on its head by beating Frentzen 6-5 in counting races, 13-4 in qualifying, and 81-42 in points on his way to winning the title, causing permanent reputational damage for Frentzen. In 1998, when the Williams car was no longer as competitive. Villeneuve was more closely matched with Frentzen, scoring 7-7 in counting races, 10-6 in qualifying, and 21-17 in points.
After his move to BAR, Villeneuve’s performance was thought by many to have dropped off along with the results. However, his performances alongside teammates indicate that he was still driving at a very high level, and the model rates 2000-2002 his 3-year peak interval. From 1999-2000, Villeneuve was paired with Ricardo Zonta (no ranking), who arrived with a strong junior record, including titles in Brazilian F3, South American F3, F3000, and the FIA GT Championship. Villeneuve dominated Zonta 10-2 in counting races, 26-3 in qualifying, and 17-3 in points. From 2001-2002, Villeneuve was paired with Olivier Panis. This was a closer match, but Villeneuve again came out on top, 8-5 in counting races, 21-13 in qualifying, and 15-8 in points.
By 2003, Villeneuve’s performances appeared to wane. Not taking his extremely talented teammate Jenson Button seriously at first, he was beaten 2-3 in counting races, 7-8 in qualifying, and 6-12 in points. Villeneuve’s performances continued to deteriorate with his dimming motivations. After a poor 3-race cameo for Renault in 2004, Villeneuve returned for a full season with Sauber in 2005. He was beaten by Felipe Massa 3-10 in counting races, 6-13 in qualifying, and 9-11 in points. In 2006, Villeneuve was beaten by Nick Heidfeld 2-6 in counting races, 7-5 in qualifying, and 7-13 in points, at which point he was replaced by Robert Kubica.
36. Nelson Piquet
(6.56 ppr, 1982-1984)


Nelson Piquet’s rating has improved relative to the previous f1metrics list, although still falls short of where he is typically rated by experts, given his history-book status as a three-time champion. With the model now accounting for age and experience related changes in driver performance, Piquet’s results as a rookie against Niki Lauda are considered far more impressive, and leniency is given to the results later in his career, when he was approaching 40.
While Piquet’s overall rating has improved, he is still not quite rated #1 by the model in any individual season. The model considers 1982-1987 as Piquet’s period of sustained peak performances. His decline from 1988 is partially age-related, but also approximately corresponds to the timing of his severe injury at Imola 1987, which resulted in permanent visual deficits. Prior to the accident, Piquet’s record against Nigel Mansell was 6-6 in counting races, 8-9 in qualifying, and 75-73 in points. After the accident, Piquet’s record against Mansell was 2-5 in counting races, 5-8 in qualifying, and 70-51 in points (helped by Mansell’s 4 mechanical DNFs to Piquet’s zero).
35. Jacques Laffite
(6.57 ppr, 1977-1979)

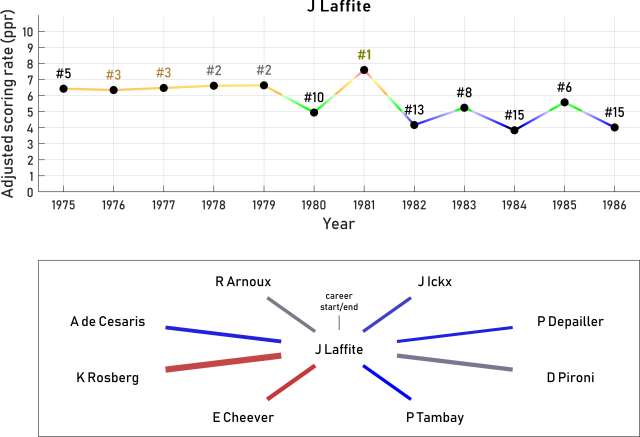
Jacques Laffite was a late entrant to motor racing, winning the French F3 title at 29 and starting his first full F1 season at 31. He continued racing until his career was ended by leg injuries in a serious accident in 1986, aged 42. As a result, the first half of Laffite’s career featured excellent results, whereas later years tailed off due to age-related decline. Now that the model explicitly takes Laffite’s age into account, his rating has risen from #60 in the old list to #36.
Laffite debuted for Frank Williams alongside Arturo Merzario (ranked 137th). The two drivers were of similar age, but Merzario had two seasons more experience. Due to poor car reliability, the two drivers never shared a counting race, but in qualifying they were closely matched at 4-5.
Laffite then moved to Ligier, where he would spend most of his F1 career. He was a sole entrant for the team across 1976-1978, meaning the model has no additional information about Laffite’s performance via teammates in these years. Based on performances in other years, the model surmises that he was likely about the third best driver on the grid in this period. Joined by strong teammates in 1979, Laffite demonstrated the pace was there. Against Jacky Ickx, he led 1-0 in counting races, 8-0 in qualifying, and 12-3 in points. Against Patrick Depailler, he led 3-0 in counting races, 4-3 in qualifying, and 24-22 in points.
The 1980 season was Laffite’s first major stumble. Against 28 year old Didier Pironi (ranked 128th), Laffite trailed 3-5 in counting races and 6-8 in qualifying, narrowly outscoring the lower-rated Pironi 34-32. In 1981, he bounced back in formidable fashion, scoring all 44 of Ligier’s points against a rotating cast of teammates, including Jean-Pierre Jarier (ranked 153rd; filling in for an injured Jabouille), Jean-Pierre Jabouille (no ranking; still not at full fitness), and Patrick Tambay (ranked 113th). Since the model does not account for Jabouille’s injury, it may be overrating Laffite’s performance in 1981, which it rates the year’s strongest performance.
After 1981, Laffite’s performances began to decline. In 1982, now aged 38, Laffite faced a strong challenge from the widely underrated Eddie Cheever, scoring 1-2 in counting races, 7-8 in qualifying, and 5-15 in points. Difficult seasons followed against Keke Rosberg (2-9 in counting races, 3-27 in qualifying, 16-47.5 in points) and Rene Arnoux (ranked 130th; 2-4 in counting races, 1-8 in qualifying, 14-11 in points), but by now Laffite was well into his 40s.
34. Elio de Angelis
(6.59 ppr, 1982-1984)
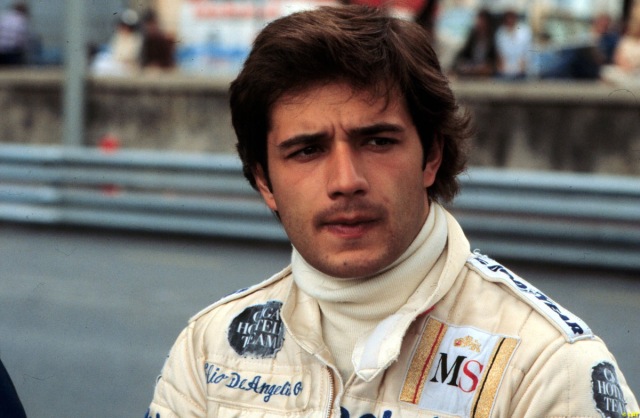

 Elio de Angelis is a largely forgotten star of the 1980s, with only two race wins to his credit. At his peak, he was one of the best drivers on the planet. In fact, the model considers him the best performing driver in 1984, and rates him the second best Italian driver in history.
During his career, de Angelis faced three titans of the era: Mario Andretti, Nigel Mansell, and Ayrton Senna. He clearly beat Mansell in equal equipment, was closely matched with Andretti, and gave Senna a strong challenge. Against Andretti, de Angelis scored 2-3 in counting races, 8-6 in qualifying, and 13-1 in points. Against Mansell, de Angelis scored 12-6 in counting races, 46-15 in qualifying, and 76-38 in points. Against Senna, de Angelis scored 3-5 in counting races, 3-13 in qualifying, and 33-38 in points.
Expert rankings have typically placed de Angelis outside the top 40, yet all driver ranking models have previously placed de Angelis between 18th and 27th in the all-time rankings. The updated f1metrics model ranks de Angelis 8 places lower than the old f1metrics model, owing to it now considering de Angelis’ advantage in terms of experience over both Mansell and Senna, as well as due to new additions to the list. But de Angelis remains one of the top-rated drivers of the 1980s, ranked only behind Ayrton Senna and Alain Prost in this top 100.
33. Eddie Irvine
(6.64 ppr, 1997-1999)


When the occasion presented itself for Eddie Irvine to potentially claim the 1999 title, he proved not quite ready for the challenge. Ultimately, Irvine was never in the league of teammate Michael Schumacher, but he admitted that fact openly. His results against other teammates lead the model to conclude he was among the throng of next-best drivers in the 1990s after Ayrton Senna and Alain Prost retired, and before the next generation of greats arrived in the early 2000s.
Against Johnny Herbert at Jaguar, Irvine scored 4-4 in counting races, 13-3 in qualifying, and 4-0 in points. Against Mika Salo at Ferrari, he scored 4-1 in counting races, 4-2 in qualifying, and 28-10 in points, although on one occasion Salo surrendered a win to Irvine; the tally would otherwise have stood at 3-2 in counting races and 24-16 in points. Against Pedro de la Rosa (ranked 105th) at Jaguar, he scored 7-3 in counting races, 17-13 in qualifying, and 14-3 in points.
The only driver besides Schumacher who had an edge on Irvine in equal machinery was Rubens Barrichello. Irvine joined Jordan late in 1993, Barrichello’s rookie season. The pair continued together across 1994-1995. Overall, Irvine scored 5-9 in counting races, 18-14 in qualifying, and 17-28 in points.
32. Emerson Fittipaldi
(6.73 ppr, 1974-1976)


Emerson Fittipaldi had a meteoric beginning to his F1 career, followed by a long whimper of a finish. Fittipaldi was thrust into a team leader position when teammate Jochen Rindt was unexpectedly killed in 1970. He immediately delivered the goods, winning a race in his fourth start and winning the title just two years later. At the time, he was the youngest champion in history.
In 1971, Fittipaldi beat teammate Reine Wisell (no ranking) 2-1 in counting races, 5-2 in qualifying, and 12-9 in points. He then partnered David Walker (no ranking) in one of the most mismatched driver pairings in history. Fittipaldi took the 1972 championship in convincing fashion, winning 5 of 12 races, while Walker scored zero points, never finishing higher than 9th. In qualifying, Walker was never within 1.3 seconds of Fittipaldi. The model rates this one of the lowest season performances ever.
Fittipaldi was joined by a similarly strong driver, Ronnie Peterson, in 1973, with the team now having no clear number one. Fittipaldi finished ahead 55-52 in points, but with 4 mechanical DNFs versus 6 for Peterson. Seeking another title and clearer number one status, Fittipaldi moved to McLaren for 1974. He dominated his two teammates on his way to a second title, beating Denny Hulme 8-1 in counting races, 14-1 in qualifying, and 55-20 in points, and Mike Hailwood (ranked 125th) 6-3 in counting races, 10-1 in qualifying, and 37-12 in points. Following this, he beat Jochen Mass (ranked 107th) 9-2 in counting races, 13-2 in qualifying, and 57-20 in points.
From 1976 onwards, Fittipaldi raced for his own Fittipaldi Automotive team. The team was never competitive and he scored just 37 points across 5 years — fewer than he scored in each year from 1972-1975. He was the team’s sole driver for most races. After a disappointing year in 1980, where he was outpaced by young teammate Keke Rosberg, Fittipaldi called time on his F1 career.
Although Fittipaldi took only 6 career poles, he won 14 races. Known for his extremely smooth, controlled driving style that was relatively kind on tyres, Fittipaldi came into his own in races, often gaining the lead later in the race. As a result, he averaged only 34 laps led per race win, the second lowest number in F1 history (Tony Brooks holds the record at 22 laps led per race win).
31. Romain Grosjean
(6.76 ppr, 2015-2017)
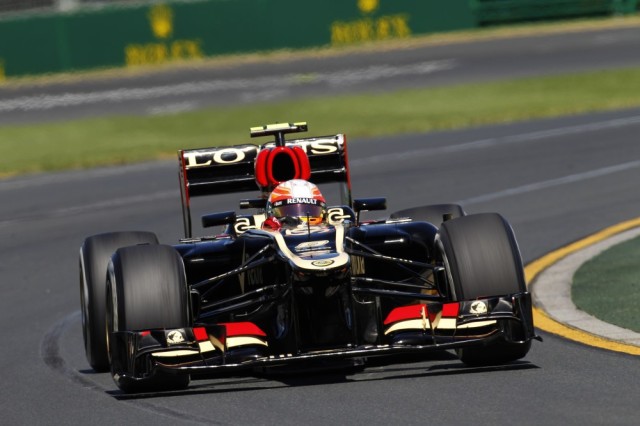

Romain Grosjean’s F1 career is probably most aptly described as chaotic. His performances plummet whenever he is not comfortable with the car’s behavior under braking. His record is also littered with incomprehensible accidents, with crash DNFs in 43% of his starts under wet conditions. Yet, when on song, he has a higher ceiling than most modern midfield drivers.
After a brief debut for Renault alongside Fernando Alonso in 2009, Grosjean would have to wait until 2012 to return to F1, gaining a seat at Lotus. Over two seasons alongside the returning Kimi Räikkönen, he soon evidenced his basic characteristics as a driver. Able to match Räikkönen’s pace on a good day, but prone to destroying the car. Overall, he trailed Räikkönen 7-23 in counting races, 15-20 in qualifying, and 204-372 in points.
Subsequent seasons alongside weaker drivers, Pastor Maldonado and Esteban Gutiérrez (no ranking), further demonstrated that Grosjean is capable of great results on his day — he outscored Pastor Maldonado 21-13 and Esteban Gutiérrez 29-0. But, he doesn’t deliver as consistently as a top driver should — in counting races, he was ahead only 12-8 against Maldonado and tied 7-7 against Gutiérrez.
The same pattern has repeated against Kevin Magnussen at Haas. He appears to have a higher peak than Magnussen, especially in qualifying. Yet, this does not always suffice against such a consistent points scorer as Magnussen.
30. Nick Heidfeld
(6.79 ppr, 2005-2007)


Nick Heidfeld finished his F1 career without a race win, though he possibly could have won Canada 2008 against his teammate, had he been more ruthless. In a way, this summarizes Heidfeld. Extremely quick and consistent, certainly talented enough to deserve race wins, and perhaps even titles in the right car in the right era, but seemingly lacking the killer instinct of a champion.
Heidfeld’s name often arises in discussions of who was the best driver in F1 history without a race win. He remains a very credible historical choice based on this list. The only drivers ranked ahead of him without a race win are drivers active on the 2019 or 2020 grid.
Compared to the old f1metrics model, this new one rates Heidfeld slightly lower. This can be attributed to the fact that the model now accounts for Heidfeld’s experience advantage over several of his strongest teammates, including Robert Kubica, Kimi Räikkönen, and Felipe Massa. Indeed, it was precisely this advantage that held top teams back from making a play for Heidfeld. Although Heidfeld led his battle against Räikkönen 6-5 in counting races, 10-7 in qualifying, and 12-9 in points (noting that Heidfeld had better reliability), it was recognized that Räikkönen’s potential was higher than Heidfeld’s, as a less experienced driver, when he was scooped up by McLaren.
29. James Hunt
(6.87 ppr, 1975-1977)
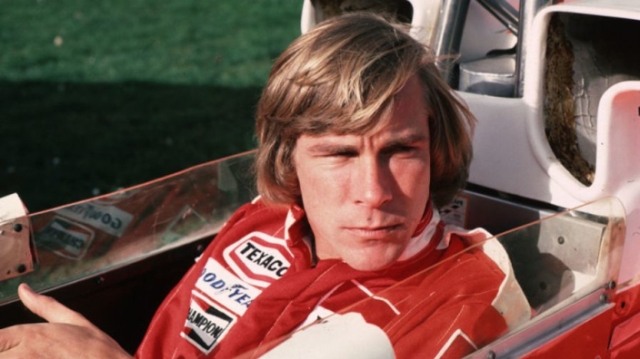

In my previously published all-time ranking list, James Hunt occupied a bold 6th position (a ranking I described as ‘jarring’), far ahead of where experts and fans typically rate him. Hunt usually doesn’t even get a mention in the top 20 in expert rating lists. At the time I published the 2014 list, I dug deep into the data to try to better understand the reasons for the model’s rating and concluded that it was not simply a spurious result. I found that Hunt indeed had an extremely strong head-to-head record against teammates, having outperformed every teammate in points per counting race. Across his career, Hunt won 10 races while his teammates collectively won zero.
Yet, a later comparison among published driver ranking models indicated significant volatility in Hunt’s rating. While my model had him at #6 and the earlier model of Eichenberger and Stadelmann had him at #14, the model of Bell and colleagues did not rate Hunt inside the top 50. This volatility could be attributed to Hunt’s relatively short career (with a lot of DNFs), coupled with the fact that he was a sole driver entrant for much of 1974 and 1975, meaning he had relatively few reliable teammate connections in his career. The strongest connections were with Jochen Mass (19 shared counting races), Brett Lunger (11 shared counting races), and Patrick Tambay (9 shared counting races).
So what are the model factors that lead to a more conservative ranking of James Hunt, nearer to expert consensus? The answer is not customer cars, although Lunger was at the disadvantage of having a customer car for the majority of his shared races with Hunt. Removing the customer car effect from the model leaves Hunt’s all-time ranking unaltered. It is instead down to age and experience effects. Without those factors included in the model, Hunt rises back to #13 in the list. This can be explained by Hunt’s relatively greater experience compared to several drivers with whom he shared machinery in the same season, including Patrick Tambay (who was in his second season), Keke Rosberg (second season), Gilles Villeneuve (rookie), Brett Lunger (rookie), Harald Ertl (rookie), and Alan Jones (rookie and customer car). Although many of these overlapping periods were brief, they add up to a sizeable effect given Hunt’s relatively few long-term teammates. On average, across all counting races, Hunt had an average of 1.4 years more experience than his teammates.
Despite this downward adjustment, Hunt remains ranked among the top 3 drivers of the 1970s, ahead of contemporaries Emerson Fittipaldi, Jacques Laffite, Ronnie Peterson, and Mario Andretti. The model awards him runner up in the championship in 1973, 1975, and 1976.
28. Valtteri Bottas
(6.92 ppr, 2015-2017)


Note: Only 7 Finnish drivers have a 3-year peak.
Valtteri Bottas has proven the ideal number two to Lewis Hamilton at Mercedes. A fast enough qualifier to ensure front-row lock-outs, and a fast enough racer to provide useful strategic support. Yet, not fast enough to cause Hamilton any consistent headaches as the higher rated Nico Rosberg and Jenson Button did. Crucially, Bottas is also a highly reliable performer who is willing to follow team orders. His DNF crash rate of 3% is among the lowest in F1 history.
Measuring Bottas against Hamilton’s other teammates, we can see that he is a stronger qualifier than either Jenson Button or Heikki Kovalainen, but in races he is Hamilton’s least challenging teammate to date. In contrast, Button was the furthest behind in qualifying, but performed relatively much better in races, almost matching Rosberg’s performance there despite his grid-place disadvantage. Nico Rosberg’s and Fernando Alonso’s relationships with Hamilton both ended in serious fireworks — almost inevitable when driver head-to-heads approach 50:50 with championships on the line — which is something Mercedes now seek to avoid.

Comparative performance of Lewis Hamilton’s teammates in qualifying and races. Note that Heikki Kovalainen raced alongside Hamilton in the refueling era, meaning qualifying was completed on race fuel loads, which introduces an additional source of variability.
27. Kevin Magnussen
(6.93 ppr, 2017-2019)

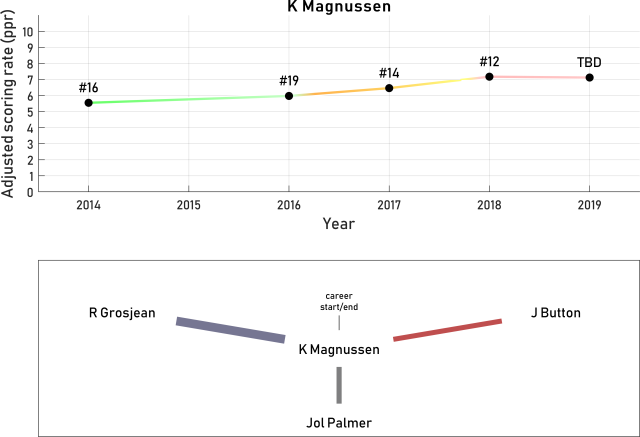
As a McLaren junior, Kevin Magnussen was given the near-impossible task of outgunning Jenson Button in a fight for the 2015 McLaren seat. Beaten 3-14 in counting races, 9-10 in qualifying, and 55-126 in points, Magnussen was considered insufficiently promising to retain and was dropped from the program. History appeared to be repeating itself, as Kevin’s father Jan Magnussen (no ranking) had also appeared extremely promising only to be trialed and dropped by McLaren back in 1995.
Just as Jan received a second chance a year later with Stewart Grand Prix, so did Kevin with Renault in 2016. There, he failed to really impress against the rookie Jolyon Palmer (no ranking), scoring 8-8 in counting races, 11-8 in qualifying, and 7-1 in points.
With Haas joining the grid and limiting their search to drivers with previous F1 experience, Magnussen was selected to partner Romain Grosjean. While not always able to keep pace with Grosjean, Magnussen has become the team’s primary points earner based on consistency and his hard-edged defensive driving.
26. Felipe Massa
(7.04 ppr, 2008-2010)

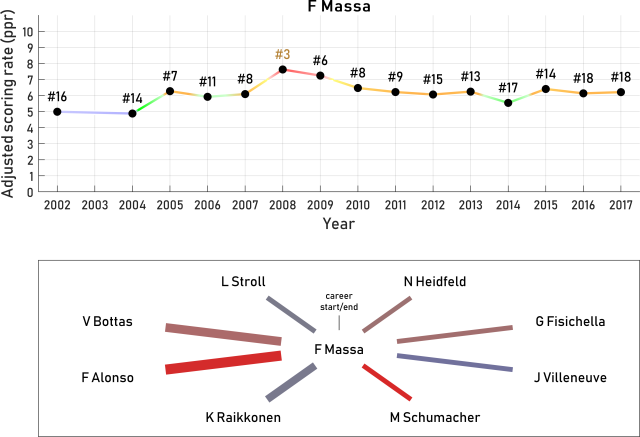
As foil to both Fernando Alonso and Michael Schumacher, Felipe Massa was measured directly against the sport’s absolute best. Although he could not compete with those all-time greats, he proved his abilities against Kimi Räikkönen.
Massa began his career fast but crash-prone. In his debut year, Massa crashed out 5 times and was outperformed by Nick Heidfeld. After a year of testing, he returned alongside Giancarlo Fisichella. Massa showed signs of improvement, but was again outperformed by his teammate. In 2005, he raced alongside Jacques Villeneuve and outperformed his teammate for the first time.
In 2006, Massa moved to Ferrari, where he was taken under the guidance of teammate Michael Schumacher. Massa was beaten 3-12 in counting races, 4-13 in qualifying, and 80-134 in points. Nevertheless, he showed significant improvement towards the end of the year and stayed at Ferrari to partner Kimi Räikkönen from 2007-2009. While Räikkönen prevailed to win the title in 2007, Massa overall held a small edge against Räikkönen, scoring 18-16 in counting races, 25-19 in qualifying, and 213-195 in points. In 2008, Massa very narrowly missed out on the title to Lewis Hamilton, being rated the year’s 3rd best performer by the model.
Massa’s strong form continued into 2009, but his career nearly ended at Hungary when he was struck in the head by an errant spring. On returning to race at Ferrari, he found a different environment, controlled by the hyper-competitive Fernando Alonso. Across 2010-2013, he was dominated 12-62 in counting races, 19-57 in qualifying, and 1029-496 in points.
Massa saw out his career at Williams, racing alongside Valtteri Bottas for three seasons, against whom he scored 23-26 in counting races, 18-39 in qualifying, and 308-407 in points.
25. Rubens Barrichello
(7.08 ppr, 2007-2009)

 Rubens Barrichello’s early career was filled with promise, beginning with a memorable drive in the wet at Donington 1993, where he retired running 3rd in only his third grand prix. This was the same race dominated by Ayrton Senna, and for a time it seemed Brazil had found its next champion. Yet, Barrichello took 123 starts to win a grand prix, and although he had championship-winning cars at his disposal, he was overshadowed by teammates Michael Schumacher and Jenson Button.
From 1993-1998, Barrichello outperformed teammates Thierry Boutsen, Eddie Irvine, Martin Brundle, Jan Magnussen (no ranking), and Jos Verstappen (ranked 109th). He gave the Stewart Grand Prix team their first podium in 1997 and in the chaotic 1999 European GP, he narrowly missed out on the honor of taking the team’s first win to teammate Johnny Herbert, against the run of play.
In 2000, Barrichello was hired by Ferrari to partner Michael Schumacher. While Barrichello was in a contractual number two role from 2000-2005, he was also clearly outpaced by his teammate, scoring 21-64 in counting races, 25-79 in qualifying, and 412-606 in points.
Moving to Honda, Barrichello spent 2006-2009 alongside Jenson Button, where he had a championship shot with Brawn. In qualifying, the pair were closely matched at 36-34, but Button was the more consistent performer in races, leading Barrichello 21-34.
24. Heinz-Harald Frentzen
(7.14 ppr, 1998-2000)

Heinz-Harald Frentzen rarely rates a mention by F1 pundits when the best drivers of the 1990s are considered these days. The reason is quite simple: in 1997, the only year of his career where he was in a championship-winning car, he dramatically failed to deliver. This performance single-handedly undid Frentzen’s other achievements, which were less visible by way of being in less competitive cars.
On net, Jacques Villeneuve beat Frentzen 12-13 in counting races, 10-23 in qualifying, and 59-102 in points. The only other driver to beat Frentzen in a head-to-head race tally was Nick Heidfeld, against whom Frentzen scored 3-6 in counting races and 7-9 in qualifying, but Frentzen led 13-6 in points.
Frentzen’s results against his other teammates were extremely strong, as shown in the teammate wheel above. Against Johnny Herbert, Frentzen was ahead 5-2 in counting races, 13-3 in qualifying, and 7-4 in points. Against Damon Hill, Frentzen was ahead 10-1 in counting races, 14-2 in qualifying, and 54-7 in points. Against Jarno Trulli, Frentzen scored 7-4 in counting races, 9-18 in qualifying, and 17-15 in points.
Based on his career data, the model sees Frentzen as an extremely strong driver who underperformed when it counted most. The model ranks Frentzen the 2nd best driver in 1995 and 2000, and the best driver in 1999, when he won two races for Jordan. Since the model now accounts for Hill’s age in that season, Frentzen’s rating has moved down from #17 in the old f1metrics list. Yet he remains much higher rated by the model than by most experts.
23. Robert Kubica
(7.19 ppr, 2008-2010)


We sadly missed out on the peak period of Robert Kubica’s career. In 2010, he was competitive with the sport’s elite. Had he continued racing into 2011-2012, his three-year peak would likely drag him higher up this list. As I showed in one of my historical hypothetical articles, Robert Kubica would have been one of the strongest drivers on the grid in the following years, albeit not quite at the level of Lewis Hamilton or Fernando Alonso.
Across 2006-2009, Kubica raced alongside Nick Heidfeld. The overall head-to-head tally was extremely close: 24-24 in counting races, 29-28 in qualifying, and 137-150 in points. An impressive result for Kubica when one considers that Heidfeld was effectively at his peak. In 2010, Kubica moved to Renault, where he raced alongside rookie Vitaly Petrov. Kubica dominated Petrov 13-1 in counting races, 17-2 in qualifying, and 136-27 in points. Kubica was then severely injured in a rally crash before the 2011 season, nearly losing his right arm.
After many years of recovery, Kubica returned for Williams in 2019, where he seemed to altogether lack his former speed. Shortly before Robert Kubica’s F1 comeback, I used the f1metrics model to accurately predict that Kubica would likely be among the 5 worst performing drivers on the grid. It was, unfortunately, not the Kubica we had seen before. Ultimately, the fact that Kubica returned at all, given the challenges he faced, was extraordinary.
22. Esteban Ocon
(7.27 ppr, 2016-2018)


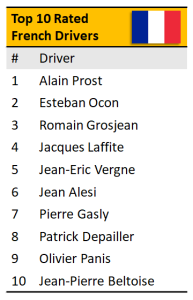 Esteban Ocon first made his name as Max Verstappen’s major rival in F3. Ocon prevailed to win the championship, although he had more single-seater experience than his rival, who was nearly fresh out of karts. Ocon followed his rookie F3 title with a rookie GP3 title, before a sideways step into DTM for half a season as service to Mercedes while he awaited an F1 drive.
Joining F1 midseason in 2016, he was placed alongside fellow Mercedes junior, Pascal Wehrlein (no ranking), in effectively a direct shootout. Although Wehrlein had 12 races more experience, Ocon was closely matched with his teammate, leading 5-3 in counting races and trailing 2-6 in qualifying. On this basis, Mercedes put their money behind Ocon, promoting him to Force India.
There, Ocon faced the more experienced Sergio Pérez for two seasons. Ocon made clear progress against Pérez over this time period, from 8-12 in counting races in 2017 to 9-7 in 2018, and from 7-13 in qualifying in 2017 to 15-5 in 2018. The overall tally stood at 17-19 in counting races, 22-18 in qualifying, and 136-162 in points.
Without a drive for 2019, Ocon secured a Renault seat for 2020, displacing Nico Hülkenberg. His partnership with Daniel Ricciardo there will shed further light on the relative abilities of the Ocon-Pérez-Hülkenberg-Ricciardo cluster, which remains somewhat uncertain to date.
21. Ayrton Senna
(7.29 ppr, 1989-1991)

Ayrton Senna is the driver who most often sits #1 in both fan and expert rankings of the greatest F1 drivers. Cynics attribute this to his tragic death at the height of his powers in 1994. As a childhood fan of Ayrton Senna myself, I can obviously see the appeal of his qualities as a driver. He was arguably the greatest qualifier of all time and certainly one of the finest wet weather drivers. In total, 14.7% of races in F1 history have had wet conditions, but 14 of Senna’s 41 wins (34%) came in wet conditions. As shown in the graph below, he is a clear outlier in this respect.

Wet wins vs. dry wins for all race winners in F1 history. The dashed line indicates the expected wet:dry ratio, given that 14.7% of races have been wet in F1 history. Drivers who are notable outliers from the overall trend are labeled. Results current at time of writing (Japan 2019).
Yet, as brilliant as Senna was in certain key areas, there were admittedly gaps in his skillset; gaps that are difficult to identify for a Jackie Stewart, a Lewis Hamilton, or a Michael Schumacher. Senna’s extremely aggressive racecraft led too often into flawed decisions or unforced errors. His race pace was also revealed as beatable by Alain Prost during their time together at McLaren.
As was the case in the model’s previous incarnation, the f1metrics model does not see a strong case for Senna being among the all-time top 10 drivers. Senna is part of a generation that most older fans fondly remember, perhaps making it difficult to objectively rate. As a general rule, the model rates the greats of the 1980s lower than most experts and fans do. Why is this? See the box below for an explanation.
The drivers of the 1980s

While there are 8 drivers in the f1metrics top 50 whose peak years overlap the 1980s, only one driver from the 1980s makes the top 20, and none make the top 10. This is intriguing given that fan ratings typically place both Senna and Prost among the top 10, and frequently also put Piquet and Mansell in the top 20. To what can we attribute this finding?
Being the first era that was widely televised, the 1980s is the most mythologized era in F1 history, and subject to some of the deepest misconceptions. Yet, there could be model-related factors that lead to lower ratings of drivers in this era. To understand this phenomenon, I investigated several factors.
1) Reliability: It is plausible that the higher mechanical DNF rate in the 1980s could affect model driver ratings. If so, this would show up as a bias in the model’s season competition term, which is dependent on both quality and quantity of the opposition. However, if I omit that predictor altogether from the model, the driver rankings are only slightly rejigged. Ayrton Senna remains down at #14.
2) Two competing greats: The 1980s is notable in having two very closely matched top drivers, who also spent two years as teammates: Ayrton Senna and Alain Prost. This is quite different from other eras. Juan Manuel Fangio and Alberto Ascari never raced as teammates in the 1950s. Stirling Moss, Jim Clark, Jackie Stewart, and Niki Lauda all peaked over different periods in the 1960s to 1970s. Michael Schumacher was clear number one in the 1990s. Fernando Alonso reached his peak after Schumacher and spent only one season alongside Lewis Hamilton, when Hamilton was a rookie. Could Senna and Prost’s overlap be responsible for dragging them both down, since neither could really dominate the other? We can test the plausibility of this argument by wiping either Senna or Prost from F1 history, leaving the other to stand alone as the clear top driver of the era. Running this experiment, it makes almost no difference. Erasing Prost raises Senna to #20. Erasing Senna lowers Prost to #22.
3) Weak links: Although unlikely, it is plausible that a driver from the 1980s with many key teammate connections could have lowered the ratings of others as a result of particularly poor results against drivers of the incoming generation. For example, Senna had a disastrous start to 1994, alongside Damon Hill. However, omitting Senna’s 1994 results does not change his ranking. Systematically erasing other drivers from F1 history, I find that there is no driver whose results are singly responsible for holding Senna and Prost outside the top 10. For 95% of possible driver removals, Prost’s ranking stays between #18 and #21, while Senna’s stays between #19 and #24. The single driver whose removal has the biggest positive impact on both Senna’s and Prost’s rankings is Stirling Moss via a butterfly-type effect. His removal raises Prost to #13 and Senna to #15. Still not enough to get either driver into the top 10, and certainly not enough to put them in contention for #1.
The conclusion is that drivers of the 1990s appear to have systematically outmatched their 1980s predecessors, by more than one would expect based on age and experience alone. There are many possible interpretations for this observation. One potential explanation is that training standards (e.g., earlier karting, more systematic use of data) rose significantly over this period, leading to higher driver skill levels, leaving the previous generation behind. Another potential explanation is that the skills of drivers in the 1980s, who were familiar with manual transmissions and unpowered steering, did not translate so well to the more technologically advanced cars of the early 1990s. However, I note that a similar phenomenon is not observed for drivers of the 1970s, who had to adapt to a fundamental change in driving styles with suddenly increasing downforce generation. A remaining possibility that is difficult to reject is that the 1980s was simply a relatively weaker cohort.
20. Alain Prost
(7.35 ppr, 1984-1986)


Alain Prost, The Professor, is rated the top-performing driver of the 1980s, but is not in the all-time top 10. For an exploration of reasons why, see the box immediately above.
Prost was in many ways the natural complement to Senna. Not as fearsome over a single lap, nor anywhere near as adept as Ayrton Senna in wet conditions, but surer of head and a more consistent and relentless performer under race conditions. The fact that the two drivers were so finely balanced despite their clearly differing skills and deficits was an exemplar of the boxing adage ‘styles make fights’. Had either driver been the complete package, their match-up would have been far less interesting.

Alain Prost’s frequency of mechanical DNFs (represented as red squares) compared to his teammates.
Looking at Prost’s teammate wheel above, it is remarkable to note that he was never outperformed by any regular teammate in terms of points per counting race. This is a particularly impressive record, considering he faced five other champions.
Something Prost does not get full credit for in this list is his mechanical sympathy. As I have shown previously, Prost is the only driver in F1 history who clearly influenced his own car’s reliability. Since mechanical DNFs are mainly down to chance, they are excluded from analysis. This specifically hurts Prost compared to other drivers in this list.
19. Jochen Rindt
(7.60 ppr, 1968-1970)


Jochen Rindt took 9 wins in his short F1 career. This is a small number for a champion, but nobody won a race while they were Rindt’s teammate.
Rindt’s career ended in tragic circumstances, as he was killed in practice for the 1970 Italian GP. His performance that season was so dominant that he won the title posthumously in spite of only competing in 9 of the 13 races. In those 9 races, he had 4 mechanical DNFs and 5 victories, meaning a 100% win rate in counting races. This is one of only seven such cases in history, the others being:
Such cases theoretically correspond to a perfect scoring rate and are therefore challenging to statistically handle. The way they are currently handled by the model is by padding the results with an additional hypothetical 2nd place. This has the effect of distinguishing longer runs of perfect results (e.g., 6/6 wins) from shorter runs of perfect results (e.g., 1/1 wins), as the 2nd place has more impact on the scoring rate for shorter runs.
In Rindt’s case, the 1970 season was undoubtedly a brilliant driver performance. His win at Monaco was particularly impressive, coming from 8th on the grid while running an older model Lotus 49. But, the mechanical DNFs fell at convenient times with respect to maintaining a 100% win rate in counting races. In South Africa, Rindt caused a first-lap accident, ruining his own race, only to later retire with an engine failure. In Monaco, Rindt had started 8th when he retired early in race. Due to retirements of others he may have finished 2nd or possibly challenged Stewart for victory. In Belgium, Rindt had started 2nd but was running 4th (and would likely have finished 3rd due to Jackie Stewart‘s engine failure) when his engine failed. In Austria, Rindt had started on pole, but was not leading when his engine failed.
Rindt’s fatal accident at Monza was caused by a brake failure as he came into Parabolica. In retrospect, there were many signs of Team Lotus having lax engineering standards in safety-critical areas in the pursuit of outright pace before Rindt’s death. A suspension failure in practice at Belgium had been caused by someone forgetting to drill a breather hole in the hub upright casting. A steering failure in practice for France had left Rindt shaken, and upon return to the pits he prophetically declared,
“If this happens again and I survive, I will kill all of you!”
These were not isolated incidents. A year before, Rindt had publicly berated Colin Chapman after multiple wing failures caused accidents, ultimately injuring Rindt and track marshals.
At his best, Rindt was undoubtedly one of the top drivers on the grid, having convincingly outperformed both Jack Brabham and Graham Hill in equal equipment. Of the drivers in the top 100, Rindt has the highest rate of mechanical DNFs, at 55% of his starts. As a result, there were only 27 counting races in his career, making his performance rating less certain compared to drivers with longer careers. Rindt’s high rating (based largely on his 1970 season) has the knock-on effect of greatly boosting the estimate of John Surtees’ performance in 1966 when he was Rindt’s teammate.
18. Nico Rosberg
(7.64 ppr, 2013-2015)

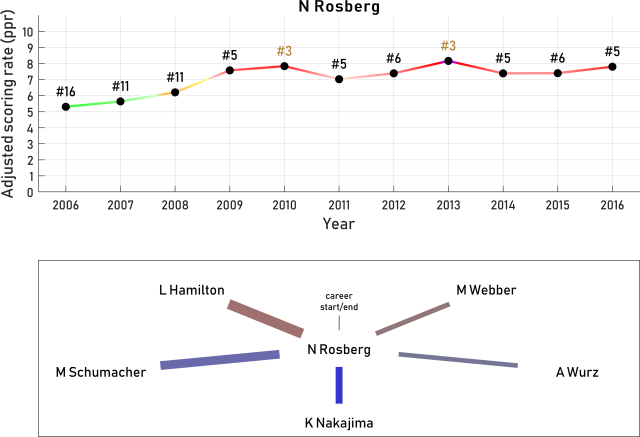
Nico Rosberg’s rating sees a significant drop from #7 in my previous list published in 2014. Rosberg’s inevitable fall in this ranking list was pretty well telegraphed by my finding at the time:
I tried excluding Schumacher’s results from 2010 when fitting the model. Rosberg’s ranking fell to 15th, with no change in Schumacher’s ranking. This highlights an important area for future improvement of the model: accounting for changes in ability across the career arc.
The model of Bell and colleagues released a year later ranked Rosberg only 48th in the all-time list, once they effectively discounted all his results against Michael Schumacher from 2010-2012 (by treating Schumacher in that period as a separate, new driver).
A clearer picture of Nico Rosberg’s abilities was painted by his performance alongside Lewis Hamilton across four seasons at Mercedes, with both drivers near to their peak. Rosberg’s overall record against Hamilton stood at 29-37 in counting races, 24-30 in qualifying, and 1195-1334 in points. Any driver that can keep pace with an all-time great over a single lap and fight him for championships (even if assisted by good fortune) is obviously very talented. Where Rosberg fell down against Hamilton was clearly in race craft, tyre management, and wet-weather abilities.
Wet races were a particular Achilles’ heel for Rosberg. Among all drivers in F1 history, he holds the record for most race wins without a win in wet conditions, scoring 23 dry wins and 0 wet wins. In dry races, Rosberg’s head-to-head tally was 29-29 versus Hamilton. In wet races, it was 0-8 to Hamilton. This was enough to clearly tip the balance.
Whilst he pushed Hamilton hard, Rosberg was ultimately fully in his shadow, as reflected in the updated ratings. After adjusting for car performance (and recognizing the differences in mechanical reliability), the model ranks Rosberg #5 in 2016, his championship season, below his teammate Hamilton.
17. Nico Hülkenberg
(7.68 ppr, 2017-2019)

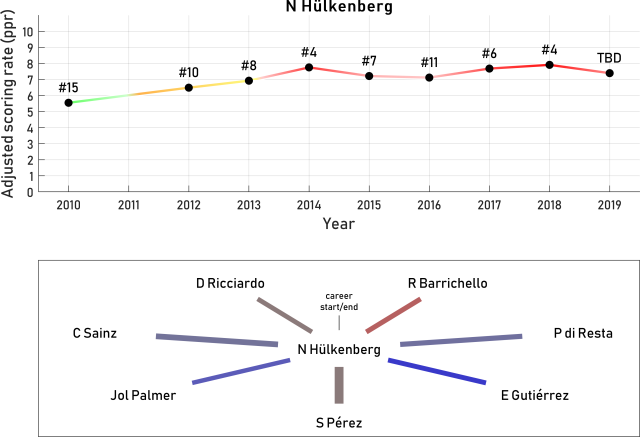
 Nico Hülkenberg entered F1 as one of the most impressive junior prospects of all time, winning titles in Formula BMW ADAC (first season), A1 GP (first season), Formula 3 Euro (second season), the Masters of F3 race (first attempt), and a very dominant GP2 title (first season) beating 9 other future F1 drivers, including Sergio Pérez, Romain Grosjean, Vitaly Petrov, Kamui Kobayashi, and teammate Pastor Maldonado.
In previous posts, where I have attempted to score the quality of junior careers, Hülkenberg scores the highest of any F1 driver, past or present, in terms of his junior career achievements.
In F1, Hülkenberg has consistently been a member of a group suspected to be a little below the absolute elite, including drivers such as Sergio Pérez, Carlos Sainz, and Valtteri Bottas. That suspicion was more or less confirmed by his 2019 results against Daniel Ricciardo, who himself is a potential but not definite member of the upper echelon. On that basis, and certainly never helped by his large frame, Hülkenberg never quite broke through to a seat with a top team.
In the same position as Nico Rosberg at Mercedes, the model predicts that Hülkenberg would have achieved very similar successes. The fact that he never scored a podium or win was not befitting of his abilities. Indeed, he is currently rated by the model as the best driver to have never scored a podium (as of Brazil 2019) and the third best driver to have never scored a win.
16. Kimi Räikkönen
(7.71 ppr, 2004-2006)


It is often argued that Kimi Räikkönen was performing at a distinctly higher level in the years from about 2003-2007 than at any other stage in his career, with motivation and various other factors cited as reasons for an abnormally early decline. With the latest upgrades to the f1metrics model, the season rankings suggest there is indeed some truth to this claim. The 2005 season is rated Räikkönen’s absolute peak by the model, a year in which he dominated his popular teammate Juan Pablo Montoya in an unbeatably quick, but often fragile, McLaren. Overall, he beat Montoya 10-7 in counting races, 19-8 in qualifying, and 145-86 in points.
After 2005, the 2004, 2007, and 2009 seasons are rated Räikkönen’s next best, all being among the top 3 driver performances of the year. But in no season is Räikkönen rated the outright best performing driver, losing out in each case to one of the generation’s greats: Michael Schumacher, Fernando Alonso, and Lewis Hamilton.
By the time Räikkönen did share a team alongside elite drivers Fernando Alonso and Sebastian Vettel, he was no longer performing at his absolute best. Against Vettel, he was occasionally closely matched, but overall beaten 19-48 in counting races, 22-56 in qualifying, and 792-1127 in points. Against Alonso, Räikkönen was absolutely demolished, scoring 1-16 in counting races, 3-16 in qualifying, and 55-161 in points. Had Räikkönen faced those two greats at his peak, the model predicts it would have been closer, but he still would not have been the favorite to prevail in either match-up.
15. Daniel Ricciardo
(7.76 ppr, 2017-2019)

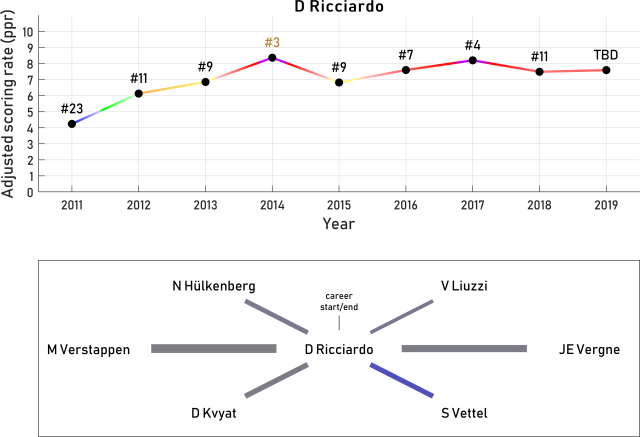
Daniel Ricciardo seems to have been poised for several seasons — perhaps for too long — on the edge of potential greatness. His domination of Sebastian Vettel in 2014, in a team built around the reigning four-time consecutive champion, was a statement that cannot easily be forgotten: 11-3 in counting races, 12-7 in qualifying, and 238-167 in points. Yet, subsequent results from Vettel have generated plausibility that this was one of his off-form seasons, and that is what the model currently considers the most probable interpretation.
After proving himself as a rookie against Vitantonio Liuzzi (ranked 118th), Ricciardo was paired with Jean-Eric Vergne at Toro Rosso. After beating Vergne 17-12 in counting races, 29-10 in qualifying, and 30-29 in points, Ricciardo was promoted to Red Bull to replace the outgoing Mark Webber.
Following Vettel’s unexpected departure from the team, Ricciardo was joined by the inexperienced Daniil Kvyat. Ricciardo was leading Kvyat 9-8 in counting races, 15-7 in qualifying, and 128-116 in points when Kvyat was in turn surprisingly replaced by Max Verstappen.
Joining Red Bull in just his second season of F1 and third year since go-karts, Verstappen was clearly still maturing as a driver at this stage, but impressed by immediately challenging Ricciardo. As Verstappen gained age and experience, his advantage over Ricciardo gradually appeared to increase, as shown in the qualifying gap graphic below. In their first season together, Ricciardo had a median qualifying lap-time advantage of 0.14%, but this had swung to 0.21% in Verstappen’s favor by 2017, which he maintained in 2018. Across the whole of 2016-2018, Ricciardo was narrowly behind in the overall head-to-head tallies, 17-22 in counting races, 22-28 in qualifying, and 590-608 in points.

Percentage qualifying gaps from Ricciardo to Verstappen. Negative values indicate that Ricciardo is quicker, positive values indicate that Verstappen is quicker. Each data point is one qualifying session, using the quickest times set by either driver across Q1-Q3 sessions that both drivers started. Sessions where either driver was hampered by mechanical issues or did not set a representative time due to mechanical issues are excluded. Dashed horizontal lines indicate median values for each season.
The 2019 season gave Ricciardo the opportunity to prove himself against Nico Hülkenberg, a driver who is considered strong but not among the absolute elite. The result was not quite what would be expected from a driver at the absolute pinnacle of the field, such as Lewis Hamilton. While Ricciardo appeared to have a clear advantage in terms of one-lap pace, it was not always translated into useful race results, with Ricciardo holding a narrow lead. For now, Ricciardo appears capable of greatness, but is not assuredly among the all-time greats.
14. Sergio Pérez
(7.81 ppr, 2016-2018)


Sergio Pérez has plied an impressive trade as the so-called ‘king of the midfield’. His career total of 7 podiums to his teammates’ collective 1 podium makes him a rather notable outlier. The only drivers in F1 history with a higher self-to-teammate podium ratio are drivers with <5 podiums whose teammates never placed on the podium (such as Eugenio Castellotti, with a record of 4-0).
Despite Pérez’s evident talent and consistent points scoring, he has never broken through to a race-winning team. Never quite quick enough to consistently challenge the greats such as Lewis Hamilton, but too quick and not compliant enough to be a reliable number two in the mould of Valtteri Bottas. His first chance came via his association with the Ferrari driver academy. His second chance came via his 2013 signing at McLaren, replacing the outgoing Hamilton. However, this move coincided with the first year of McLaren’s major slump from 2013-2018.
Pérez debuted at age 21 for Sauber in 2011, driving alongside Kamui Kobayashi, who was 24 and starting his second full season. The pair competed together across two seasons. Although Kobayashi was more experienced, Pérez achieved a very close head-to-head record against his teammate: 13-16 in counting races, 21-16 in qualifying, and 80-84 in points. In 2011, Pérez missed two races after a concussion in a massive accident at Monaco. Pérez’s performances for Sauber in the first half of 2012 gained particular acclaim, including nearly winning the wet Malaysian GP.
Given Pérez’s signs of potential in 2012, and lacking a ready junior to fill the gap left by Hamilton’s departure, McLaren signed Pérez for 2013. Pérez was now facing high-level opposition in the form of Jenson Button as teammate. Across the season, Button demonstrated his superiority over Pérez, beating him 5-11 in counting races, 10-9 in qualifying, and 49-73 in points. With tensions building between Pérez and the team, and with McLaren juniors Kevin Magnussen and Stoffel Vandoorne (no ranking) now ready for F1, Pérez was let go for 2014.
Moving to Force India, Pérez was paired with Nico Hülkenberg from 2014-2016. Going into 2014, Hülkenberg’s reputation was at its zenith, having brutally beaten Esteban Gutiérrez and putting in impressive giant-killing drives for Sauber in 2013. Over three years, Pérez gave Hülkenberg’s reputation a reality check, ultimately scoring 26-24 in counting races, 24-34 in qualifying, and 238-226 in points. The updated f1metrics model rates Pérez the 3rd best-performing driver in 2016 (considerably higher than the #12 he was awarded in my end-of-season report by the old model).
In 2017, Pérez was paired with the highly rated Mercedes-junior Esteban Ocon. This was a fiery teammate battle as Pérez sought to prove his superiority over a less experienced driver, while Ocon tried to demonstrate his worth to the Mercedes top brass. The pair made contact with each other five times on track in the 2017 season. Across 2017-2018, the head-to-head tallies were extremely close, with Pérez scoring 19-17 in counting races, 18-22 in qualifying, and 162-136 in points. But there were clear signs of the momentum shifting from Pérez to Ocon as Ocon gained experience.
In 2019, Pérez raced alongside Lance Stroll at the newly rebranded Racing Point team. There, he has established himself as a clear team leader. Without an opening at a top team, he may stay there for the foreseeable future.
13. Carlos Sainz Jr.
(7.84 ppr, 2017-2019)


For a while around 2017, the f1metrics model was highly enamored of Carlos Sainz Jr., rating him #1 in the f1metrics end-of-season report. Seeing Sainz’s performances against Nico Hülkenberg has tempered his rating, bringing him down to rank #5 in 2017.
Sainz began his career within the Red Bull program, but is one of three drivers to recently leave the program and attempt to forge their own way, the others being Daniel Ricciardo and Sebastian Vettel.
Sainz had a successful junior career and raced several times alongside Daniil Kvyat. In their first year of single-seaters, Sainz and Kvyat raced together for EuroInternational in the Formula BMW Europe and Pacific 2010 series. Overall, Sainz beat Kvyat 15-9 in races. They continued as teammates in Formula Renault 2.0 in 2010-2011, racing in multiple European series for Koiranen. The overall record this time was 21-17 to Sainz. The pair were then reunited as teammates at MW Arden in GP3 in 2013. This time Kvyat won the battle 10-5 in races and took an impressive rookie series title, while Sainz finished the championship 10th. Kvyat was thus promoted straight to Formula 1 in 2014, while Sainz recovered his reputation in Formula Renault 3.5 to earn his promotion in 2015. Sainz won Formula Renault 3.5 ahead of Pierre Gasly and Roberto Merhi, albeit with half a season more experience in the series.
Graduating to F1 in 2015 at age 20, Sainz was paired with the extremely promising rookie Max Verstappen, who debuted at 17 with only one year of experience in single-seaters. Despite Sainz’s advantage in terms of age (which the model considers) and junior single-seater experience (which the model doesn’t consider), it was Verstappen who held the edge. Across just over one season as teammates, Sainz was beaten 6-7 in counting races, 9-11 in qualifying, and 22-62 in points.
When Verstappen was promoted to Red Bull, Sainz was paired with his erstwhile teammate Daniil Kvyat. Although their head-to-head record in junior series had been a close 41-36 in races, Sainz dominated their F1 match-up 17-5 in counting races, 18-12 in qualifying, and 90-8 in points. While junior series results are only partially predictive of F1 performance, Kvyat’s poor performance was likely at least partially attributable to being psychologically crushed after his sudden demotion to Toro Rosso. On this basis, the model may currently be relatively overestimating Sainz’s performance level, and relatively underestimating Kvyat’s and Ricciardo’s performance levels.

Hülkenberg and Sainz as Renault teammates.
When Sainz moved to Renault in late 2017, he was tested for the first time against a driver from outside the Red Bull program. Against Nico Hülkenberg, Sainz appeared to be slightly outpaced, especially in qualifying where Hülkenberg typically excels, scoring 8-10 in counting races, 6-14 in qualifying, and 59-78 in points.
Joining McLaren when Ricciardo took his seat for 2019 turned out to be a blessing in disguise for Sainz, as McLaren’s performance took a major step forward while Renault fell down the competitive order. Sainz currently holds the advantage over his promising rookie teammate Lando Norris (no ranking), but we will see whether he can maintain that into the future.
12. Niki Lauda
(7.84 ppr, 1976-1978)


Niki Lauda has the impressive distinction of winning world titles nine years apart, despite an intervening two-year retirement. He proved himself one of the top drivers of the 1970s and then came back to narrowly clinch a title against Alain Prost, the top-rated driver of the 1980s.
Starting his career as a pay-driver, Lauda took some time to get on terms with an F1 car, not being rated inside the top 10 by the model until his third season. In 1972, his rookie season, he was beaten by Ronnie Peterson (in his third season) 1-6 in counting races, 2-10 in qualifying, and 0-12 in points. In 1973, he raced alongside both Clay Regazzoni and Jean-Pierre Beltoise. Against Regazzoni, he scored 2-3 in counting races, 5-8 in qualifying, and 2-1 in points. Against Beltoise, he scored 2-1 in counting races, 4-10 in qualifying, and 2-7 in points.
Beyond 1973, Lauda rapidly improved. Ferrari (who were in a rebuilding phase, having failed to even score a podium in 1973) saw enough promise to sign him for 1974. By 1976 he was the best driver on the grid and Ferrari’s investment paid dividends. Since Regazzoni and Lauda moved to Ferrari together, Lauda’s improvement can be tracked across this time period by comparing his pace to Regazzoni.

Percentage qualifying gaps from Regazzoni to Lauda. Negative values indicate that Regazzoni is quicker, positive values indicate that Lauda is quicker. Each data point is one qualifying session. Dashed horizontal lines indicate median values for each season.
In 1973, Regazzoni was clearly the quicker driver over one lap, with a median advantage of 0.71% of lap-time over Lauda. By 1974, Lauda had completely turned the tables, leading Regazzoni by 0.43%. This advantage increased to 0.57% in 1975 and 0.54% in 1976. Notably, there was no apparent dip in Lauda’s performance following his horrific accident in 1976.
By the model’s estimation, Lauda reached his absolute best in the period 1977-1978. In the 1977 season, he was paired with Carlos Reutemann at Ferrari. Lauda emerged as the clear team leader, winning the championship despite missing three races, while Reutemann, in full attendance, finished 4th in the championship. In 1978, Lauda moved to Brabham. The car was not quite competitive or reliable enough to make Lauda’s attempt at a championship defense viable, but he was still clearly driving at a very high level. He beat teammate John Watson 6-1 in counting races, 10-6 in qualifying, and 44-25 in points (despite 7 mechanical DNFs for Lauda vs. 3 for Watson).

Lauda on his way to victory for the Brabham team at the 1978 Swedish GP.
Lauda was paired with the promising rookie Nelson Piquet from the last race of 1978 into 1979, beating him by the relatively narrow margin of 2-1 in counting races, 8-6 in qualifying, and 4-3 in points. Neither driver was helped by a hopelessly unreliable car, making a direct comparison difficult. As a highly pragmatic driver, Lauda was always focused on achieving ultimate goals, with little interest in individual qualifying sessions or races if they did not serve that purpose. As an example, he simply did not turn up for the last two races of 1977, having already won the championship. Demotivated by fighting for a paltry amount of points at Brabham in 1979, Lauda shocked the team by abruptly retiring from F1 in the middle of practice for the Canadian GP, aged 30.
Lured out of retirement by a $3 million contract (equivalent to $8 million today, and among the top driver salaries at the time), Lauda returned to race for McLaren in 1982. Initially, the contract was on a three-race basis, as Marlboro were reticent to commit to a full contract until Lauda could demonstrate his abilities. He won the third race and the contract was immediately extended.
Against teammate John Watson across 1982-1983, Lauda’s advantage in qualifying was actually more convincing than it had been in 1978, with a 23-6 lead. But in races, Lauda was not as competitive as he had been before his retirement, leading 7-6 in counting races, and trailing 42-57 in points.

Alain Prost and Niki Lauda racing together at McLaren.
In the final few races of 1983, under pressure from Lauda, McLaren experimented with their new turbo TAG engine developed by Porsche, which formed the basis for their 1984 championship campaign. In 1984, Lauda was joined at McLaren by Alain Prost. What became immediately clear was that Lauda could not compete with Prost in qualifying, when the turbo engines were dialed up. Across the season, Lauda was outqualified 1-15 by Prost and never qualified on the front row. He won the title despite an average grid position of 8th.
“You had for one lap you have 1,200 horsepower and for the race you have 600. I hated this system, so I didn’t really like these stupid engines. And therefore Alain outqualified me all the time. At the first race he was five tenths quicker. Then when I improved my speed he was three tenths quicker. And this went on through the whole season.”
“I realised I wasn’t going to beat him in qualifying and decided I had to try something else. So from Friday I worked on race set-ups and on Sunday I was generally in better shape, could look after the tyres and so on.” – Niki Lauda
Switching his focus purely to races, Lauda very narrowly won the championship, scoring 4-5 in counting races and 72-71.5 points.
In 1985, Lauda was again dominated by Prost in qualifying, 1-14. In races, he was completely derailed by 10 mechanical DNFs in 14 starts. With little left to prove, Lauda retired for a second and final time.
11. Jenson Button
(7.95 ppr, 2011-2013)

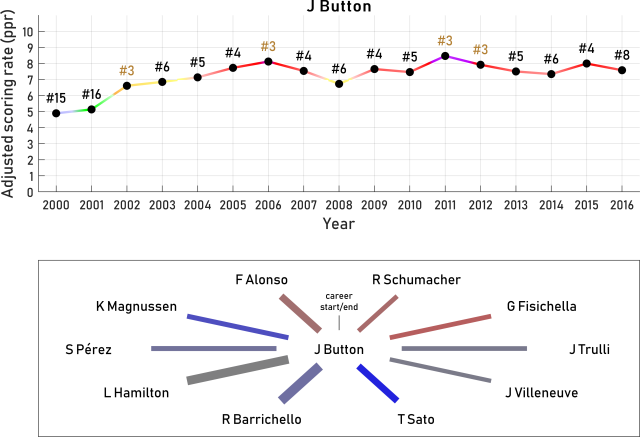
Jenson Button is frequently not given the full credit he deserves. This is because Button spent the majority of his career in cars that simply were not good enough to challenge for podiums, let alone wins. As a gauge of this, his teammates scored podiums in only 10.1% of races together, lower than Fernando Alonso’s percentage at 10.3%. The only champion since 1990 with a lower teammate podium percentage is Jacques Villeneuve at 9.1%, owing to his disastrous decision to leave Williams and drive for BAR.
Button demonstrated his high quality in equal machinery against two of the all-time greats: Lewis Hamilton and Fernando Alonso. The model predicts that only a handful of drivers in F1 history could have semi-regularly beaten both of those opponents on merit.

One of Button’s strongest attributes was his skill in wet weather, most evident in mixed conditions. Button’s smooth style and exceptional sensitivity allowed him to find time where others could not when grip levels were variable due to rain or a drying surface. It also allowed him to make intuitive strategic decisions. Following whatever Button did was once considered a viable wet race strategy. Of his 15 race victories, 7 were achieved in wet races, giving him one of the highest wet win ratios in history (see Ayrton Senna’s entry above for a graph).
In 2000, Button was a surprise pick for Williams, after just two years in single-seaters. No driver had arrived in Formula 1 with so little experience before. The closest was Mike Thackwell (no ranking), who debuted in 1980 aged 19 in the midst of his third year of car racing. Button’s superlicense application went to committee, requiring 17 votes out of 26 to pass. He received 18.
Button’s first two years in Formula 1 were difficult. In his own opinion, he was “nowhere near ready for Formula 1.” In his first season, he was beaten by his more experienced teammate Ralf Schumacher 3-6 in counting races, 6-11 in qualifying, and 12-24 in points. Then, he moved to Benetton and was convincingly beaten by Giancarlo Fisichella 0-7 in counting races, 4-13 in qualifying, and 12-18 in points.
By 2002, Button was clearly improving. Against Jarno Trulli, he scored 2-4 in counting races, 5-12 in qualifying, and 14-9 in points, although helped by Trulli’s 8 mechanical DNFs to Button’s 5. In 2003, Button joined BAR and immediately outpaced ex-champion Jacques Villeneuve, who had been dismissive of Button’s arrival, beating him 3-2 in counting races, 8-7 in qualifying, and 12-6 in points. As a result, Villeneuve was effectively ousted from his own team.
From the last race of 2003 to the end of 2005, Button raced alongside Takuma Sato (ranked 124th) at BAR. Sato was a fan-favorite, but he was utterly crushed by the more experienced Button in one of the most one-sided head-to-heads in F1 history, 21-1 in counting races, 28-8 in qualifying, and 127-38 in points.

Button’s first win, achieved in his 113th race start.
The next few years were a rollercoaster for Button’s career. Investment from Honda in a works team suggested better results could be on the way, but instead the team slumped, scoring just 6 points in 2007 and 14 points in 2008. When Honda pulled out before the 2009 season due to the global financial crisis, it appeared Button’s career might be finished. Instead, Ross Brawn bought the team and led it to both 2009 titles in one of the sport’s most incredible fairy-tale stories. Although Button won the drivers’ title, it is not rated as one of his strongest season performances, with 2011 rated his absolute peak.
From 2006-2009, Button was paired with Rubens Barrichello, against whom he scored 34-21 in counting races, 34-36 in qualifying, and 160-118 in points. After winning the title, Button moved to McLaren to face the brilliant Lewis Hamilton, in what was considered at best a brave move, at worst a foolhardy one. Over one lap, Hamilton indeed had a unwavering advantage, beating Button 44-14. However, Button’s race pace, consistency, and wet-weather skills saw him match Hamilton more closely than most anticipated, scoring 20-27 in counting races and 657-672 in points (helped by better fortune in the points tally).
As McLaren fell into decline, Button continued to demonstrate his quality, beating teammate Sergio Pérez 11-5 in counting races, 9-10 in qualifying, and 73-49 in points, and beating Kevin Magnussen 14-3 in counting races, 10-9 in qualifying, and 126-55 in points.
Button’s final clear demonstration of his status among the all-time greats was in his performance alongside Fernando Alonso at McLaren-Honda. In a difficult and unreliable car, against a teammate who was fresh off decimating Kimi Räikkönen, the overall tally stood at 9-14 in counting races, 9-22 in qualifying, and 37-65 in points.
10. Stirling Moss
(7.96 ppr, 1959-1961)

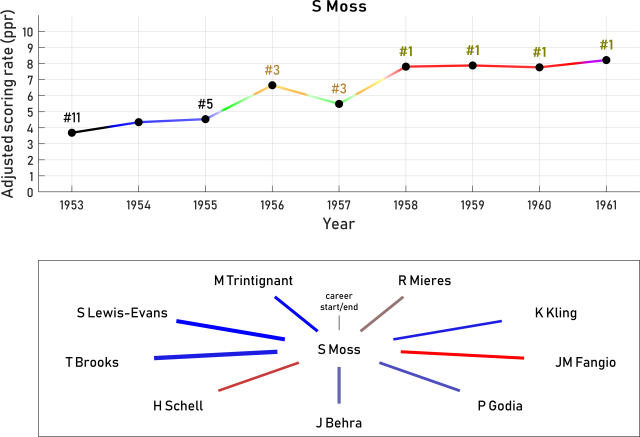
With good reason, Stirling Moss is often cited as the greatest non-champion driver in F1 history. The upgraded f1metrics model supports this claim. Only one (currently active) driver leads Moss in this ranking list, and many expect that driver to ultimately join the list of champions. By the model’s estimates, Moss was the best-performing driver in F1 in 1958, 1959, 1960, and 1961, earning him four titles. As shown in the table below, only six drivers are awarded more titles based on model rankings than Moss. Had his career not been cut short there by a devastating accident, Moss’ peak would have briefly intersected with Jim Clark’s, leading to perhaps one of the greatest driver rivalries in F1 history.

The only teammate that Moss could seemingly not better was the great Juan Manuel Fangio, to whom he lost 1-5 in counting races and 2-5 in qualifying. Notably, the losses in counting races included a race where Moss broke down and then took over another car, as well as the 1957 Argentine GP where Moss started from pole but had a very long pit-stop to fix a throttle linkage problem. Fangio’s slight edge over Moss, although from a small sample, cannot really be explained by age (Moss was 26) or by experience (Moss had raced in grands prix since 1948).
9. Max Verstappen
(8.10 ppr, 2017-2019)

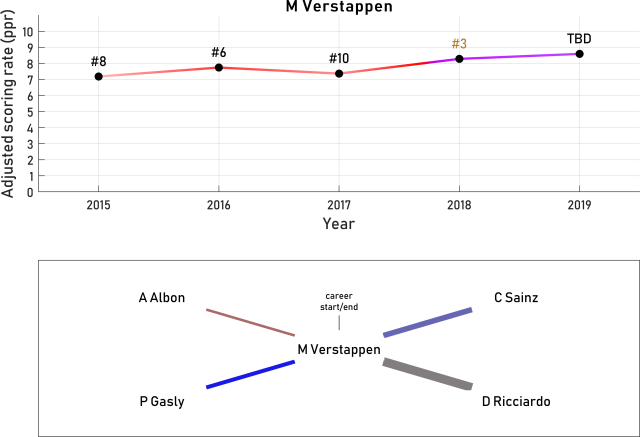
Max Verstappen is currently the model’s highest rated non-champion driver. Given his extraordinary talent and young age, many feel it is only a matter of time before Verstappen lands in the right car to challenge for titles.
One of the clearest indicators of Verstappen’s talent is his wet weather ability. His brilliant drive at Brazil 2016 was a declaration of intent, and in Germany 2019 he became the first driver other than Lewis Hamilton to win a wet race since 2014. On the other hand, Verstappen has crashed out of 3 of his 9 wet starts to date, demonstrating that there are still rough edges to be refined. This is one of the few respects in which Max can be compared to his father Jos Verstappen (ranked 109th), who could also shine in the wet but crashed out of 8 of his 20 wet starts. By comparison, Hamilton has crashed out of just 3 of his 35 wet starts.
Verstappen debuted in F1 at the age of 17, making him the youngest driver to start an F1 race. His junior career was the one of the shortest in F1 history, spanning only one full year in single-seaters between go-karts and F1. As happened previously with Kimi Räikkönen and Jenson Button, the early debut of Verstappen led to significant debate about driver entry criteria and refinement of the superlicense rules for entry to F1, with future drivers now required to be at least 18 years old. Verstappen’s age-experience trajectory is therefore unique, as shown below. Verstappen will complete his fifth F1 season at just 22. The youngest age at which any other driver has reached this level of experience is 24. Verstappen’s career therefore has unique potential for longevity.
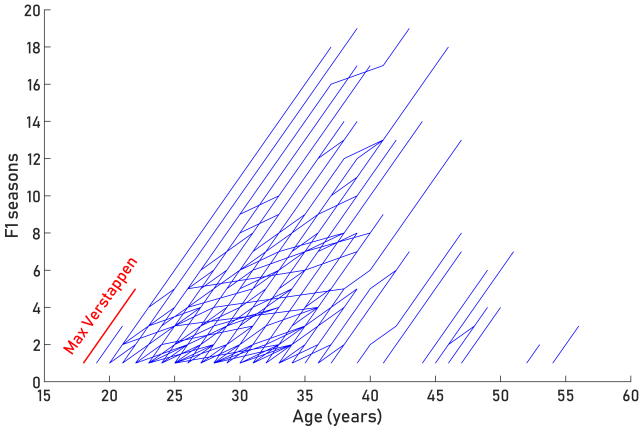
Number of F1 seasons vs. Age for each driver in the f1metrics database. Each line corresponds to a driver’s trajectory. Age is recorded at the end of the calendar year. Max Verstappen’s trajectory is highlighted in red.
Verstappen’s F1 debut saw him pitted against Carlos Sainz, a 20 year old who had taken a more traditional 5-year path through junior single-seater categories, winning Formula Renault 3.5. Across 2015-2016, Verstappen emerged the slightly stronger driver, with an overall head-to-head record of 7-6 in counting races, 11-9 in qualifying, and 62-22 in points.
Early in his second season, Verstappen received a surprise call-up to replace Daniil Kvyat at the Red Bull team, where he won in his first start. His older, more experienced teammate Daniel Ricciardo proved a significant challenge, but over time the battle seemed to slightly swing in Verstappen’s favor. At the end of their 2016-2018 tenure as teammates, the head-to-head record for Verstappen stood at 22-17 in counting races, 28-22 in qualifying, and 608-590 in points. With Ricciardo feeling the team’s momentum and focus had shifted to his younger teammate, he migrated to Renault.
Verstappen rapidly gained a reputation as an extremely hard defender, who would skirt or cross the line regarding the two-move rule, exceeding what is generally considered acceptable racecraft. The accident he caused at Baku 2018 was in part the catalyst for Ricciardo’s move to Renault.
In 2019, Verstappen faced two less experienced drivers recently promoted from Toro Rosso. Pierre Gasly in his second full season proved completely unready for the task. The rookie Alex Albon (no ranking) performed better, but Verstappen appears to maintain a significant pace advantage. Without a serious internal challenge, Verstappen’s fortunes will depend almost entirely on Red Bull’s future competitiveness.
8. Sebastian Vettel
(8.38 ppr, 2015-2017)


As indicated in the graph above, Sebastian Vettel’s career has been marked by considerable season-to-season variability. At his absolute best (2011-2013 and 2015-2017), the model rates Vettel as one of the finest drivers in the history of the sport. To date, he shares the record of most wins in a season with Michael Schumacher at 13, and holds the record for most consecutive race wins. Yet, there have been questionable periods too, such as his 2014 drubbing by Daniel Ricciardo (possibly influenced by a lack of mileage compared to his teammate) and his clumsy past two seasons at Ferrari.
Vettel began his F1 career at Toro Rosso, alongside the more experienced Vitantonio Liuzzi (ranked 118th), against whom he scored 1-3 in counting races (after throwing away a strong result in Fuji), 3-4 in qualifying, and 6-3 in points. Although Vettel was still very rough around the edges, he had obvious potential. Toro Rosso retained Vettel for 2008, this time alongside the rookie Sebastien Bourdais (no ranking), who was fresh off winning four consecutive Champ Car titles. Vettel dominated his new teammate 11-2 in counting races, 13-4 in qualifying, and 35-4 in points, earning a promotion to Red Bull.
In just his third season, aged 21, Vettel now found himself in a championship-contending car, alongside the 32-year-old Mark Webber. After narrowly losing the 2009 title to Jenson Button, Vettel proceeded to win the title four consecutive times, as Red Bull produced the clear best car four years running. While Webber offered a strong challenge in 2010, he was a distant competitor in following years. Overall, Vettel won the teammate duel 61-20 in counting races, 73-23 in qualifying, and 1410-947.5 in points.
In 2014, Vettel was thoroughly outclassed by Daniel Ricciardo — a result that the model primarily attributes to a poor season performance from Vettel, rather than a systematic performance advantage to Ricciardo.
Escaping Red Bull for a more comfortable number one driver role alongside Kimi Räikkönen at Ferrari, Vettel aimed to emulate his hero Michael Schumacher in taking Ferrari from a difficult position to championships. To date, he has failed in that quest. While the model rates his performances in 2015 and 2017 very highly, his performance was relatively poor in 2018 when Ferrari had their best chance of directly challenging the dominant Mercedes team. Overall, Vettel beat Räikkönen 48-19 in counting races, 56-22 in qualifying, and 1127-792 in points.
As a driver, Vettel is close to a complete package. He is a superb qualifier, able to deliver extremely fast and consistent race stints, a clever tactician, and capable in the wet although not particularly strong there. Yet, there is clearly one chink in the armor, which relates to Vettel’s race-craft and ability to handle direct pressure from another driver without making unforced errors. When able to control a race from the front, Vettel is indomitable. His run of 105 races (Turkey 2010 to Mexico 2015) without a crash-related DNF is the longest in F1 history, encompassing 44% of his starts. But it is a run that he has struggled to replicate in cars that infrequently compete for pole position and must battle wheel-to-wheel.

Sebastian Vettel’s crash-related DNFs across his career, indicated by red crosses. Current at time of writing (Japan 2019).
Charles Leclerc now represents the threat of a new generation, and only the second time Vettel has faced a talent similar to his own. How Vettel handles that threat will in large part determine his long-term legacy.
The top 7 all-time greats
At this point in the top 100 list, it would be fair to say we have reached drivers with no obvious gaps remaining in their game. Indeed, the peak performances of the top 7 drivers in the list are all within statistical uncertainty of the #1 driver in the list, meaning we cannot say with any great confidence how the top 7 should be ordered.
7. Lewis Hamilton
(8.48 ppr, 2017-2019)

Lewis Hamilton was a notable omission from the top 10 in the f1metrics ranking list five years ago. With an improved model, which takes into account his rookie status against Fernando Alonso, as well as additional data from his match-ups with Nico Rosberg and Valtteri Bottas, that issue has been redressed.
Like each of the other drivers in the top 7, Hamilton is among the best in every meaningful area of driver assessment. He is among the best of his era in wheel-to-wheel combat, he is an exceptional qualifier, a consistent and intelligent race driver, and to top it off, one of the all-time best wet-weather drivers.
As shown in the season performance graph above, Hamilton’s performances have been incredibly strong and consistent across his career. Even in his weakest seasons (2008 and 2011), he is rated a top 4 driver. This is notably different from contemporary Sebastian Vettel, who took several seasons to approach his peak level, and has been ranked outside the top 5 three times since 2010. At their respective peaks, the model sees Hamilton and Vettel as comparable, but Hamilton has been a far more relentless performer over time.

The top 10 performance ratings in a rookie F1 season. Inclusion in this list requires at least 3 counting races in the rookie season and excludes drivers in the early 1950s if they had competed in grands prix prior to 1950.
In an absolute sense, Hamilton’s brilliant 2018 season (aged 33) is currently rated his best to date. But if we adjust each season performance for age and experience (i.e., determining the predicted equivalent performance if the driver had been at both peak age and experience), the model rates Hamilton’s 2007 debut season as his most impressive, narrowly ahead of his 2018 performance. While the model recognizes that 2007 was far from Fernando Alonso’s strongest year, beating a reigning world champion as a rookie remains an absolutely extraordinary feat. Indeed, the model now rates Hamilton’s 2007 season as the strongest absolute performance in a rookie season in F1 history, as shown in the table alongside. This is a list that is increasingly populated by new drivers as training standards continue to rise, but Hamilton stands clearly at the top. The second highest rated rookie season is James Hunt’s exceptional 1973 season, where he finished 8th in the championship despite starting only half of the races.
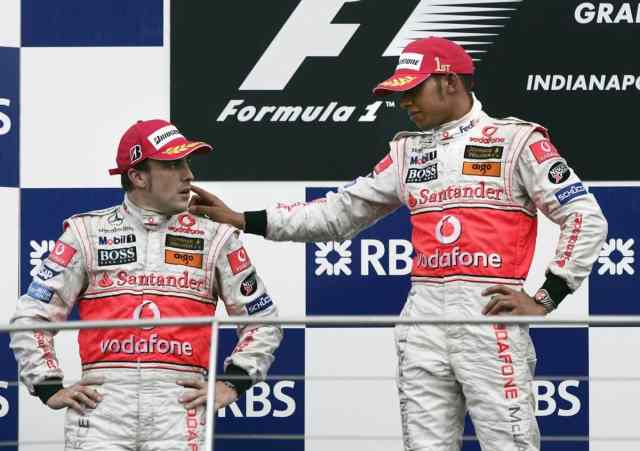
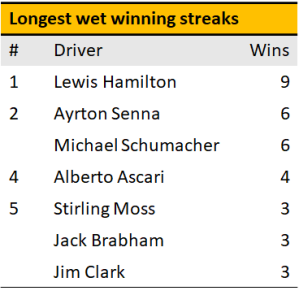
Drivers with the most consecutive wins in wet races A wet race is defined here as a race where the surface was visibly wet at any stage during the race, including races that began on a clearly damp surface.
In wet weather, it has become almost a given that Hamilton in recent times will win the race. While his percentage win rate in wet starts of 43% is lower than Alberto Ascari’s 67% (from 6 races), Ayrton Senna’s 64% (from 22 races), and Juan Manuel Fangio’s 50% (from 8 races), his winning streak in wet races from 2014-2019 was by far the longest in F1 history.
Hamilton’s team switch from McLaren to Mercedes must be considered one of the best-timed and most shrewd moves in F1 history, enabling him to spend all of his F1 career in one of the top 3 cars on the grid, and several seasons in a dominant car. This combination of car and driver has propelled Hamilton to near the top of the sporting record books. He now has the second highest rate of scoring F1 podiums in F1 history, behind only Juan Manuel Fangio (excluding drivers with fewer than 10 starts), and the fourth highest rate of winning races, behind only Juan Manuel Fangio, Alberto Ascari, and Jim Clark. Moreover, Hamilton is now closing on Michael Schumacher’s records for total drivers’ titles, race victories, and podiums. Records that seemed virtually untouchable at the time they were laid down.

Race wins vs. race starts for the seven drivers in F1 history with at least 30 total wins. Current at time of writing (Japan 2019).
6. Jim Clark
(8.58 ppr, 1962-1964)


Jim Clark topped my previous all-time driver list when I published it in 2014. There can be no doubt that he is among the greatest talents the sport has ever seen. His slight stumble down the list (although still within uncertainty of #1, as noted above) can be largely attributed to the model now incorporating the role of customer cars. As a result, Clark’s undeniable advantage as a works Team Lotus driver over Lotus customers is now corrected. Confirming this, if I simply exclude the customer car factor from the model, Clark jumps back up the list to #2.
 Clark initially took a couple of seasons to really find his feet, but after that, he was practically unstoppable. It is worth noting that Clark was still working on the family farm at the age that Max Verstappen debuted in F1. Clark did not begin his first race until 1956, when he started in amateur hillclimb events. Four years later, he was debuting at the pinnacle of motorsports. By 1962, the model sees Clark as the strongest performing driver on the grid.
Clark’s streak from 1963 to 1965 was a demonstration of his complete superiority over the competition. Of the 29 championship races he started in this period, he either experienced mechanical issues (13 races), in some cases causing a DNF, or he won (16 races). In the 16 races that he won, his average lead over 2nd place at the checkered flag was 58 seconds. He amassed a total of 159 points to his works-team teammates’ collective 28 points.
 If we look at win streaks in F1 only including counting races (i.e., excluding any intervening mechanical DNFs), Jim Clark has the longest in history at 11 consecutive counting races. Of course, this was enabled by a combination of Clark’s driving skills and often dominant machinery. In the words of John Surtees, “Jimmy was good—very good—but a lot of the time also had the best car.”
When he died in an almost meaningless F2 race in 1968, while leading the F1 championship, Clark was 32 years old and at the height of his powers. Two drivers’ titles did not do justice to his potential. It is natural to wonder what more he could have achieved. I investigated this topic using a recent version of the f1metrics model in a post from my historical hypothetical series.
The model predictions indicate that Clark could have realistically been a top driver (perhaps even the best driver on the grid in some seasons) up to about 1974. Imagining Clark dicing for position with the likes of Carlos Reutemann and Emerson Fittipaldi is jarring, since they tend to be mentally compartmentalized into different eras, but that is what could have unfolded. Based on his projected performance levels, Clark would have likely remained capable of taking race wins and even potentially titles in a strong car up to about 1977 (aged 41).
5. Alberto Ascari
(8.66 ppr, 1950-1952)
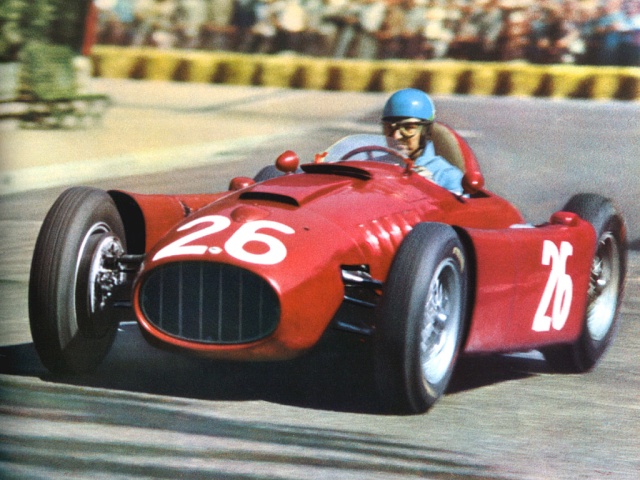

Alberto Ascari was one of the two giants of F1 in the early 1950s, alongside Juan Manuel Fangio. Ascari’s streak of consecutive race victories achieved as he won his two titles across 1952-1953 was not matched again in F1 for over 50 years. And it is worth noting that had the 1949 F1 season had an organized championship, Ascari would also have won that title, yielding him three drivers’ titles.
While it is fair to say that the depth of the field that Ascari faced was nothing like that of modern F1, and that he enjoyed one of the most dominant F1 cars in history in 1952, Ascari maximized just about every opportunity he was given. Ascari has the second-highest win rate in F1 history, behind only Juan Manuel Fangio. He also holds, to this day, the record for the most consecutive race laps led at 304, achieved during a period in which his teammates included Giuseppe Farina and Piero Taruffi (no ranking).
Significantly, Ascari holds the highest Grand Chelem rate in F1 history (race win, pole, led every lap, fastest lap), at 15.6% of race starts. The only other driver to get within one-third of Ascari’s Grand Chelem rate is Jim Clark at 11.1% of race starts. It is of course harder to achieve Grand Chelems since pit stops became routine in the 1980s, due to the likelihood of losing the lead on a pit-stop. However, Ascari stands out clearly relative to his own peers on this metric. Juan Manuel Fangio never achieved a Grand Chelem.
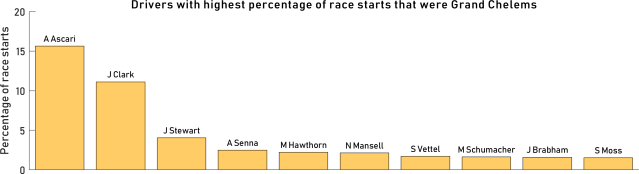
Ascari achieved strong positive records against the two other champions with which he raced as teammates. Against Giuseppe Farina, he was ahead 11-2 in counting races and 13-2 in qualifying. Against Mike Hawthorn, he was ahead 5-3 in counting races and 9-0 in qualifying
The only driver in the above teammate graphic who shows up as a red connection for Ascari is José Froilán González (no ranking), but it should be noted that they spent only four races as teammates, in one of which Ascari had a mechanical DNF. The pair were closely matched in their races together, with Ascari scoring 2-1 in counting races, 3-1 in qualifying, and 19-24 in points, with González having a slightly higher scoring rate across the season.
When Ascari died in a sportscar crash, testing purely for fun with a friend in 1955, he was aged 36 with considerable remaining potential. By this time, Juan Manuel Fangio was already 43 years old and Stirling Moss was yet to reach his peak. Had he continued to race, the model projects that Ascari would likely have been the strongest performing driver in 1956; the second strongest performing driver in 1957 (behind Fangio) and 1958-1959 (behind Moss); the third strongest performing driver in 1960 (behind Moss and Jack Brabham); and the fourth strongest performing driver in 1961 (behind Moss, Innes Ireland, and Dan Gurney). Had he continued to race for Ferrari, the model considers Ascari the favorite to win the title in 1956, 1958, 1959, and 1961, which could potentially have taken him to six titles.
4. Juan Manuel Fangio
(8.67 ppr, 1953-1955)


Juan Manuel Fangio’s position in the top 5, just ahead of his contemporary Alberto Ascari, will be no great surprise for any historians of the sport. Fangio’s haul of five world titles stood as the record until it was eclipsed 46 years later by Michael Schumacher in 2003.
Fangio accumulated his wins at a rate never repeated again in F1 history. Among drivers who started at least 10 races, Fangio dominates most percentage statistics, including the highest win rate of 47% (24 wins in 51 starts) and the highest podium rate of 69% (35 podiums in 51 starts). Looking at the graph below, we can see that Fangio scored 24 wins far faster than any other driver in history. The only driver whose trajectory is comparable to Fangio’s is Ascari’s, which tops out at 13 wins.
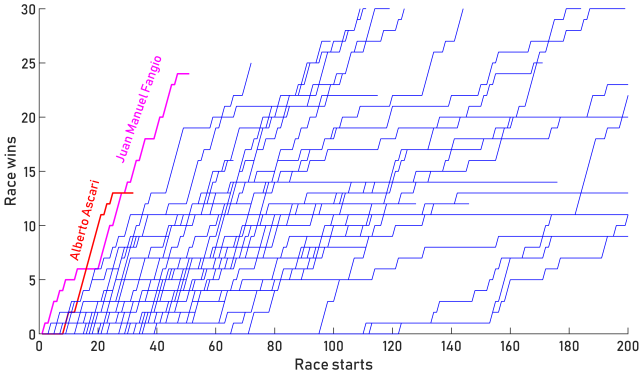
Race wins vs. race starts. The trajectories are shown for all drivers who won at least 10 races. Fangio and Ascari are highlighted.
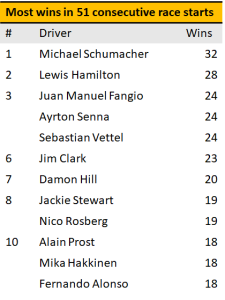 Even if we allow other drivers with careers longer than Fangio’s to take just their best 51 consecutive race starts, Fangio’s career win rate remains the third best of all time. Part of Fangio’s success was down to his uncanny knack for moving from one winning team to another at critical moments. Fangio’s five titles were won driving for four different teams: Alfa Romeo, Ferrari, Maserati, and Mercedes. He even switched teams from Maserati to Mercedes mid-season during his successful 1954 title campaign. No other driver in history has won titles for more than two teams.
Among Fangio’s greatest achievements was his legendary comeback drive at Germany 1957. The race was held on the grueling 22km Nürburgring circuit over 22 laps, taking about 3.5 hours to finish. Fangio, in the Maserati, had decided to make one pit-stop for new tyres and fuel at half distance. Mike Hawthorn and Peter Collins, in the Ferraris, decided to run the race with no pit-stops. Fangio took the lead in the early stages and raced out to a lead of 28 seconds by the time of his pit-stop at the end of lap 12. However, a very slow pit-stop left him over 60 seconds behind the two Ferraris. In the remaining 10 laps, Fangio caught and passed both Ferraris, breaking the lap record 7 times in succession, even bettering his pole position time on 4 of those laps. Fittingly, it was Fangio’s final race win and sealed his fifth world championship title.
Below are the estimated lap times, which I reconstructed from old race reports.
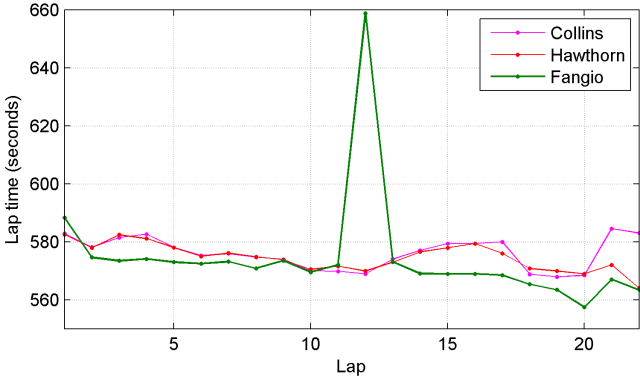
It’s clear how much faster Fangio was than the Ferraris in every stage of the race, as well as how much time Fangio lost on his bungled pit-stop. With a normal pit-stop, Fangio would have rejoined just behind the Ferraris with ample time to pass them. As usual, Fangio was driving with a little in hand, attempting to win the race as slowly as possible — this is why he was one of the few successful drivers from his era to survive. After the pit-stop, he threw caution to the wind. His astonishing lap 20, when he closed 11 seconds on Hawthorn, was in Fangio’s own opinion as close as he ever got to perfection behind the wheel. The two Ferraris remained in each other’s slipstreams for most of the race. After they were passed by Fangio on lap 21, Collins dropped back with a failing clutch.
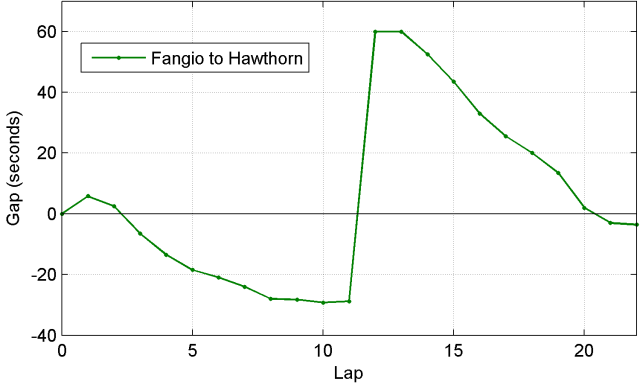
In reading the above graphs, it is important to remember the length of the circuit. The last 10 laps lasted about 90 minutes. Fangio’s feat was therefore comparable to a driver being 1 second per lap quicker than the next fastest driver for the entire duration of a modern grand prix.
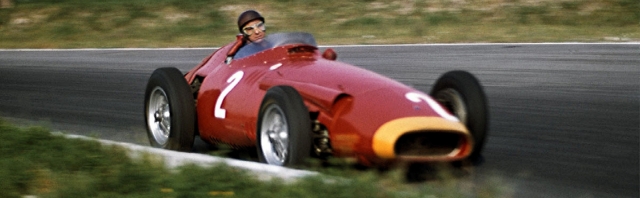
Fangio’s ranking in this top 100 list carries deeper significance considering that when the first World Drivers’ Championship began in 1950 he was already 38 years old. By comparison, Alberto Ascari was 31 in 1950. We therefore probably never saw Fangio’s absolute peak during the years of the World Drivers’ Championship. Furthermore, his 3-year peak does not begin at 1950, due to him missing the 1952 season. Yet, the model ranks Fangio among other all-time greats who were competing at peak age and experience.
If we use the f1metrics model to adjust for age, we can speculate about how much better Fangio might have performed had he instead been in his late 20s to early 30s in 1950. Under this projection, Fangio would narrowly clinch #1 on the all-time list.
3. Fernando Alonso
(8.80 ppr, 2012-2014)


Fernando Alonso achieved 32 wins, 97 podiums, and two World Drivers’ Championships in his first 202 starts in F1. In this period, he was 8 points away from a further three championships. In the following 110 starts, Alonso won zero races and finished on the podium just 8 times (see his flat-lined graph in Lewis Hamilton‘s entry above). With what was a Schumacher-level talent, Alonso could potentially have won as many titles as cars allowed. Yet, his pattern of consistently landing in declining teams after his bust-up with McLaren in 2007 extinguished any hopes of topping the record books. Most of Alonso’s moves seemed quite reasonable at the time, looking only foolhardy with hindsight. His move to Renault in 2008 on short contracts allowed a transfer to Ferrari. Unfortunately, it was the wrong move. The Todt-Brawn-Byrne superteam disintegrated and Ferrari were looking shaky in 2009 when Alonso put ink to the contract. In 2008, Red Bull had offered Alonso a two-year contract for 2009-2010, which could with hindsight have led to a string of titles from 2009-2013. But who could have predicted Red Bull’s sudden upswing in 2009?

In a show of frustration, Alonso pushes his stricken McLaren into the pit lane.
Alonso’s options were arguably limited at times by his reputation as a divisive and self-focused driver, who preferred to be the team’s central focus. What we can say with certainty is that Alonso was one of the defining talents of his generation. Leveling out the effect of machinery — a factor that rarely helped Alonso — the model awards him 10 drivers’ titles, second only to Michael Schumacher. In fact, every objective driver ranking model that separates team and driver performance has ranked Alonso the top driver of the post-Schumacher generation, despite varying mathematical assumptions and varying data inputs.

The top 10 driver rankings derived by five different objective models since 2009.
In the past, I have generated historical season rankings with the f1metrics model. It is interesting to reappraise some of Alonso’s near-miss seasons using the updated model, which sees some of these results differently from before.

In 2007, Kimi Räikkönen squeaked to the title by a single point while McLaren imploded with internal strife. Previously, the f1metrics model ranked the F2007 a relatively dominant car, since that was the only way it could explain a superteam of Alonso and Hamilton losing to Räikkönen and Massa. Now that the model explicitly considers Hamilton’s rookie status, it considers 2007 a relatively poor performance by Alonso’s standards and rates the McLaren and Ferrari cars relatively close to one another. As a consequence, it also sees 2007 as a relatively strong season for Räikkönen, who is now rated the 3rd best performer, compared to 5th with the old model. Similarly, Felipe Massa’s ranking has risen to 8th, compared to 14th with the old model.
In 2010, the updated model sees McLaren and Ferrari as essentially tied for second best car, whereas previously it rated Ferrari the clear third best car behind McLaren. The model still views the Red Bull as a car that should have dominated the 2010 season, consistent with Adrian Newey’s claim that the RB6 was “probably the car with the most downforce in the history of F1” up to that time, in a formula that was aero-dominated. In light of this, the model sees Alonso and Lewis Hamilton as the two clear best performers in 2010, with Sebastian Vettel (the actual champion) rated 6th, and teammate Mark Webber (nearly the champion) in 13th.

Alonso winning at Valencia 2012.
In 2012, Alonso famously wrestled a relatively uncompetitive Ferrari into championship contention, narrowly losing the title to Vettel at the final race. While the Ferrari was clearly at a significant deficit in terms of pace, it did have better reliability than Red Bull or McLaren. This has led to disputes over the car’s ultimate championship worthiness, with some fans arguing it was the 4th or 5th best car, and others arguing it was the best overall package. The old f1metrics model rated the Ferrari the 3rd best car, marginally ahead of Lotus in 4th. The updated model sees the Ferrari as the season’s 2nd best car, clearly behind Red Bull but just ahead of Lotus and significantly ahead of McLaren. Consequently, the model still rates Alonso a clearly better performer than Sebastian Vettel in 2012, but with Lewis Hamilton now rated 2nd, up from 5th in the old model.
Alonso’s peak period according to the model is 2012-2014, a period that includes his championship near-miss in 2012, a superb but ultimately futile performance against a dominant Red Bull at Ferrari in 2013, and his utter domination of Kimi Räikkönen in 2014 (16-1 in counting races, 16-3 in qualifying, and 161-55 in points), as he dragged a shambles of a car into frequent contention for podiums and wins while Räikkönen finished only once inside the top 5. Alonso’s domination of Räikkönen is one of the most one-sided teammate head-to-head battles in F1 history. Notably, Alonso’s name appears several times in the most one-sided battles list in the table below.

The most one-sided head-to-head scores in counting races between teammates. For inclusion, teammates must have a total tally of at least 15 counting races together (approximately one modern grand prix season).
One of Alonso’s chief strengths across his F1 career was his extreme adaptability, as he learned to excel under three tyre manufacturers and in cars with greatly differing characteristics. In the Michelin era, he perfected an extremely aggressive turn-in, whereas in the Pirelli era, on tyres that tolerated smaller slip angles, he adopted a far smoother style, often manipulating the car at turn-in with a subtle dab of throttle. In races, Alonso was relentlessly consistent. The strength of Alonso’s race performances is emphasized by the fact that qualifying was often considered a relatively weak point, although he was evidently one of the strongest qualifiers of his generation (going 15-16 against Jarno Trulli and 8-9 against Lewis Hamilton).
With his F1 career now seemingly finished, Alonso goes off in pursuit of the triple crown. It will be a rare treat to see one of the all-time greats, still near the peak of his abilities, attempting to adapt to other forms of motorsports.
2. Jackie Stewart
(8.85 ppr, 1969-1971)


The clear best driver of the 1970s, Jackie Stewart scored three drivers’ titles and then retired, still at the height of his powers, acutely aware of the sport’s dangers. The fact that he is as much remembered today for his safety campaigning as for the quality of his driving is testament to how profoundly his influence shaped the sport, saving countless future drivers. But make no mistake, Stewart was as good as any driver in history behind the wheel.
By his own reckoning, Stewart was only successful as a safety pioneer because he had the results to back it up,
“It was said I removed the romance from the sport, that the safety measures took away the swashbuckling spectacular that had been. They said I had no guts. But not many of these critics had ever crashed at 150 miles an hour. Fortunately, I was still achieving a lot of success, winning races in hideously dangerous conditions, and that gave me greater influence. For instance, I won four times at the original Nürburgring in Germany — the most dangerous circuit in the world — and yet I was always afraid of that place. In 1968 I won there by over four minutes in thick fog and rain where you could hardly see the road. That race should never have been held, and having won it by such a big margin gave me more credibility when I demanded safety improvements.” – Jackie Stewart
Stewart’s campaign to improve safety was partly influenced by the tragic death of Jim Clark. Stewart was close friends with Clark and idolized his compatriot, whom he considered the finest driver he ever raced against (the model concurs). Like Clark, Stewart was a late convert to motorsports. Until he was 21, Stewart trained as a competitive shooter who won numerous national championships and nearly made Olympic selection in 1960. Five years after he turned his attention to amateur racing, he was debuting in Formula 1.
“Jim Clark was the man. I learned more from Jim Clark than I did from anyone else.” – Jackie Stewart
Stewart carefully studied and modeled his driving on Clark’s, inheriting and adapting Clark’s use of trail-braking. By the model’s estimation, Stewart at his peak was every bit Clark’s equal.

Jackie Stewart with his hero and mentor, Jim Clark.
In his rookie season, Stewart went head-to-head with Graham Hill at his peak, scoring an impressive 5-5 in counting races and 7-11 in qualifying, and 34-47 in points. What followed was a difficult two seasons at BRM, where the car was highly unreliable and generally uncompetitive. The 1966 season started well with a win at Monaco, but was followed by a crash at Spa in treacherous conditions, which broke Stewart’s collar bone, causing him to miss the next race. The car broke down in 13 of the next 17 races, meaning Stewart does not even have a model season ranking for 1967.

Jackie Stewart on the way to victory at Nürburgring 1968.
In 1968, Stewart moved to Matra, setting his results on a clear upward trajectory, as he won three races and finished 2nd in the championship, despite missing two races due to a wrist injury sustained in an F2 accident. Stewart’s victory in the 1968 German GP is one of the all-time legendary drives, winning by over four minutes in wet, foggy conditions. The model rates Stewart the year’s strongest performer, as it does in 1969 and 1971-1973 during his golden years with Tyrrell. The only year in this period where Stewart is not rated the top performer is 1970, where Jochen Rindt claims the honor due to his perfect win record in counting races (see Jochen Rindt’s entry for discussion of this point).

Drivers with the lowest percentage of dry race starts ending in a crash-related DNF. For inclusion, a driver must have at least 50 dry race starts.
As a racer, Stewart was incredibly consistent, rarely taking unnecessary risks. In 99 starts, he retired from a crash on only four occasions, twice by himself in wet conditions (Spa 1966, Spain 1972), once due to a collision (Jacky Ickx at Canada 1969) and once from being rammed by a competitor (Clay Regazzoni at Germany 1972). His crash rate of only 2.4% in dry races is among the lowest in history.
Stewart was the first truly global motorsports star, traveling around the world not only for races but also for frequent media appearances and product endorsements. In parallel, he was still heavily promoting the improvement of racing safety standards. In 1971, he crossed the Atlantic 87 times. This punishing schedule began to take a physical toll. In 1972, he missed a race with a stomach ulcer.
Tales of Stewart’s unbelievable talents are myriad and extend well beyond his F1 career. Even into his fifties, long retired from racing, Stewart was several times shown to be competitive with upcoming or current F1 drivers in F1 or roadcar tests.

Jackie Stewart testing the Lotus 78.
In the 1990s, he was giving lessons to junior single-seater drivers. Here is the story as Juan Pablo Montoya tells it.
“Jackie [Stewart] got me to take him round Oulton Park in an Escort Cosworth. I’m going into Druids as hard as I can, and as I turn in the rear end steps out. I’m thinking, ‘Oh no, I’m going to bust my ass here, with Jackie Stewart as passenger. This is exactly what I don’t need right now.’
Anyway, I got the car back, and Jackie said: ‘Very impressive car control. But you don’t need to try that hard.’ Then he took the wheel and he said, ‘I’m going to show you how it’s done.’ Off he goes, really slow through the gears, really smooth on the brakes, very little steering effort, and I said to myself, ‘Come on, grandpa!’ And when we came into the pits and I saw the times, he was seven-tenths quicker than my best time. That taught me a good lesson. I was using up so much energy and effort, I was wasting time by trying too hard.” – Juan Pablo Montoya
Beyond all of his other contributions to motorsports, Stewart set in motion the moves that would lead to the modern Red Bull Racing team. With support from Ford, and working with his son Paul, Jackie started the F1 team Stewart Grand Prix in 1997. Although the team had poor reliability, they achieved a podium in their first season and a race win in their third season. At this point, the team was bought out to become Jaguar, continuing at the Milton Keynes base established by Stewart, which subsequently became Red Bull Racing.
1. Michael Schumacher
(8.91 ppr, 2000-2002)
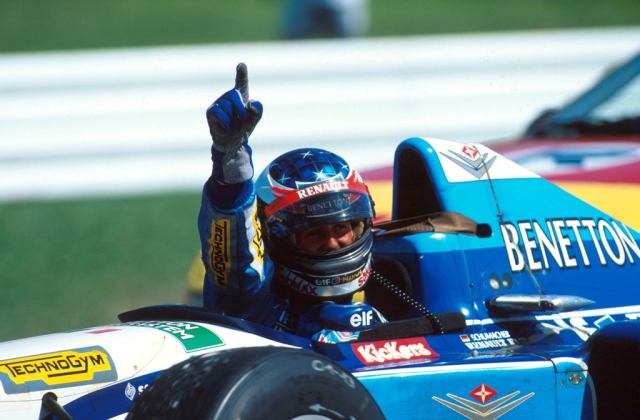

Michael Schumacher was the first driver in F1 history to optimize every area of driver performance, including athleticism, training, and real-time telemetry. He turned a gladiatorial sport into a science and the results were stunning. Today, we therefore talk of the pre-Schumacher and post-Schumacher eras.

Michael Schumacher on his way to a legendary win in the wet at Spain 1996.
For a period in the 1990s, Schumacher simply left the rest of the field behind, as far as professionalism and driving performances went. In that period, we were still treated to some epic championship contests, on account of Schumacher’s Ferraris typically not having the same level of performance as his championship competitors at Williams and McLaren. In the graph below, we can see the gulf between Schumacher’s estimated performance in each year and the next best driver’s performance, reaching its largest in 1996 with a staggering difference of 2.8 ppr. The exception to this is 1999, where Schumacher missed part of the season with a broken leg and served as a number two driver to support Eddie Irvine on his return.

As testament to Schumacher’s greatness in this period, I recently showed that Schumacher would likely have won almost the same number of titles had he driven for a different team (McLaren) from 1996-2006.

Michael Schumacher’s world titles for Ferrari vs. the world titles he would be predicted to score racing for McLaren under assumed seat swaps with Mika Häkkinen (1996-2001) and Kimi Räikkönen (2002-2006).
By the early 2000s, the F1 grid was starting to be populated by a new generation of athletes. These were drivers who had all trained in karting from an early age and who had learned many of the lessons that Schumacher had applied. Fernando Alonso, Jenson Button, and Kimi Räikkönen were all wunderkinds who debuted in F1 after only two years in junior single-seaters. By 2003, the model estimates that this new generation was finally beginning to challenge Schumacher’s mantle.
While Schumacher’s performance level was undeniable, there are two main criticisms often leveled at his career. The first is his unsportsmanlike conduct, which arose on numerous occasions (Adelaide 1994, Jerez 1997, Austria 2000, Monaco 2006, etc.). Obviously, a model that is based on race results does not take such factors into account.
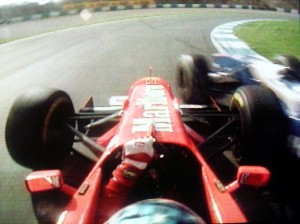
Michael Schumacher’s deliberate collision with Jacques Villeneuve, which led to his exclusion from the 1997 world drivers’ chapionship.
The second is his firm contractual number one status against almost every teammate, and the aggressive application of team orders. This is a factor that I have considered including in the model several times, but have not found a suitable objective approach to defining a number one driver, as the nature of number one status can greatly vary, and in subtle ways, and it is very difficult to determine in many historical cases. In Schumacher’s defense, other drivers in the top 7 also held contractual number one status for a majority of their careers and benefited from compliant teammates. Number one driver preference has existed since the beginning of F1 and tends to naturally emerge when there is a clear skill imbalance between teammates.
Schumacher retired at the end of 2006, being ousted from his Ferrari seat in favor of Kimi Räikkönen. In retrospect, this was a fairly mystifying decision. As I showed in my historical hypotheticals series, Schumacher would likely have had no difficulty winning both the 2007 and 2008 titles for Ferrari, had he been retained.
On return to Formula 1 in 2010, Schumacher’s driving lacked its former effortless brilliance and he was, at least at first, clearly outperformed by teammate Nico Rosberg. By most drivers’ standards, his 2011-2012 performances were very respectable, both rated inside the season top 10, but not to the sublime standard of Schumacher’s main career. Schumacher’s performance in 2012 is rated slightly lower than his 2011 performance, which can be attributed to unfortunately timed DNFs in 2012. On detailed analysis, he was very closely matched with teammate Rosberg in 2012. According to the model, Schumacher’s performances in these Mercedes years are almost exactly in line with expectations, based on his age and lack of recent experience. Including the results of 2010-2012 therefore has no significant positive or negative effect on estimates of Schumacher’s career performance in the updated f1metrics model.

Michael Schumacher driving the Ferrari F2001 in his highest rated season.
Based on the model’s estimates of driver performance season by season, the 2001 season is rated Schumacher’s greatest season, just ahead of 1996 and 1994. The 2001 season was a near-perfect performance, with Schumacher finishing in the top 2 in all but three races: in two of those races his car failed (San Marino and Germany), in the other (Italy) he finished 4th and was beaten by Rubens Barrichello on merit. Overall in 2001, Schumacher beat teammate Barrichello 12-1 in counting races, 16-1 in qualifying, and 123-56 in points. Schumacher holds 6 of the top 20 single-year performances in F1 history, more than any other driver. The next best are Juan Manuel Fangio and Fernando Alonso with 4 seasons each in the top 20.

Of his many incredible skills, perhaps Schumacher’s greatest was his ability to consistently deliver 99.9%-level performances lap after lap for long stretches. He could switch on and maintain this qualifying-style performance with very rare errors whenever race circumstances dictated that it was necessary, at stages in a race when other drivers would be fatigued or prone to making errors under pressure. This was an extremely valuable asset in the refueling, tyre-war era of F1. Arguably, no other driver was quite as talented in this respect. This particular attribute is highlighted by Schumacher’s tally of 77 fastest laps, a record that would have earned him an extra 77 points under the scoring system in the modern day (or the 1950s). The next highest number of fastest laps by any driver in history is 46. This may be one of the few records that Schumacher retains, even through the Hamilton-Mercedes era of dominance. If so, it would be a fitting marker of Schumacher’s genius.
HONORABLE MENTIONS
A number of drivers missed out on the above top 100 list due to having careers that were too short or had too few counting races to satisfy the 3-year criterion. Rankings of drivers with shorter careers are obviously less certain, but still interesting to examine.
There are three drivers in F1 history who do not have a 3-year peak, but would appear in the top 40 if ranked based on a 2-year peak. They are José Froilán González (32nd), Stoffel Vandoorne (24th), and Charles Leclerc (19th).
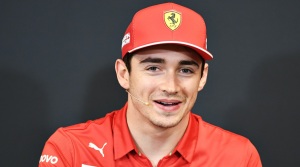
Leclerc is the only one of those three drivers currently active, meaning he will likely join the top 100 list in 2020. His rating is still currently volatile and evolving race by race.

González is a name that pops up several times in the above rankings. Despite strong teammates in the 1950s, he held a clear positive record overall. Against Mike Hawthorn, he scored 2-1 in counting races and 6-1 in qualifying. Against Alberto Ascari, he scored 1-2 in counting races and 1-3 in qualifying. Against Juan Manuel Fangio, he scored 0-2 in counting races and 1-4 in qualifying. While he was probably not quite at Fangio or Ascari’s level, he was among the next-best drivers of the 1950s.

Vandoorne raced in F1 for only two years, during which time he was clearly unable to perform at teammate Fernando Alonso‘s level. However, Alonso is rated among the top few drivers in history. As I have shown before, the pace difference between Vandoorne and Alonso was smaller than for most of Alonso’s teammates, in spite of Vandoorne having less experience than many of those drivers. In view of that, the criticism that Vandoorne received over his performances was not really justified.

If we also consider 1-year peaks, there is one additional driver worthy of note. That is Mark Donohue (34th), who was the topic of a post in my recent historical hypothetical series.

Donohue was an extremely successful driver in other series and showed signs of brilliance in his short F1 career, including a podium in his first F1 race, as he excelled in the wet conditions. He is actually rated by the model as the top-performing driver in 1975, narrowly ahead of Niki Lauda and James Hunt. Had he committed to F1 earlier in his career, he could likely have been one of the top drivers of the 1970s.

The banner from the Autosport Top 40 driver rankings. Site here: http://f1greatestdrivers.autosport.com/
Finally, how do these rankings compare to the rankings of experts? We can compare the list to the Autosport Top 40, which was composed by a panel of experts. There are four drivers in the Autosport Top 40 who did not make the f1metrics Top 100. They are José Froilán González, Jean Behra, Phil Hill, and Stefan Bellof. González is noted above as a driver who would have appeared in the top 40 based on his 2-year peak, but he does not satisfy the 3 consecutive years of sufficient counting races.

Jean Behra was rated 38th in the Autosport Top 40. He is ranked just outside the top 100 by the f1metrics model at 116th. His career was covered in a recent historical hypothetical I posted.

Phil Hill was rated 33rd in the Autosport Top 40. He was notably the first US world drivers’ champion. As I have previously shown on this blog, Phil Hill drove probably the most dominant car in F1 history to achieve his 1961 title. His results versus teammates during his career were patchy, and he is rated 132nd of all time by the model, the lowest of any champion.
Stefan Bellof was rated 35th in the Autosport Top 40. He has no 3-year peak due to his short career before his untimely death. However, if we reinstate the disqualified results of Tyrrell from 1984, Bellof would be ranked 109th based on his 2-year peak. This ranking can be understood based on how closely he was matched with teammate Martin Brundle. His career was the subject of another recent historical hypothetical I posted.
CONCLUSIONS
I hope you have found this to be an interesting read or resource. I also hope that it is understood correctly to be the outputs of a specific model, the assumptions of which are described above. While I see this model as a substantial step forward from the model used five years ago, and a powerful tool for critically examining our many, varying subjective views, it should not just be accepted blindly. There are of course factors that the model does not consider, and its outputs should be discussed in that context. I have tried to provide such context in the driver entries above, especially in cases where I think the model is overlooking something important.
Some will view any attempt at ranking athletes across eras in any discipline as futile. I personally view it as a fun question that invites creative thinking, and one that will surely never go away among sporting aficionados. To even attempt to answer the question, one has to very clearly frame one’s assumptions, as was done in this exercise. To that end, it is worth reiterating that the model cannot tell us how a driver from the 1950s would perform in a modern car if somehow transported via time machine to the modern era. Nor does it currently provide any information about how drivers of the past might have performed had they had access to modern training methods, such as beginning karting at a young age. All rankings are on a scale of relative abilities, compared directly to one’s peers, and indirectly across generations via a chain of teammate connections.
In my opinion, the rankings in the top 100 throw up fewer surprises than in the list generated by the old model five years ago, which included a number of clearly anomalous results driven by the model not accounting for age or experience. Some of the biggest surprises in the top 100 (e.g., Ericsson, Stroll) are likely to resolve themselves with more data over coming years, and I do plan to provide updates to the top 100 in future end-of-season reports. As for any good model, there remain many cases where it challenges our perceptions and puts the onus on us to justify them. In some cases, we will find the model has overlooked an important factor, resulting in a spurious output. In other cases, we will find our own judgment is flawed. In either scenario, the model is a useful tool that generates insights unavailable through subjective analysis alone.
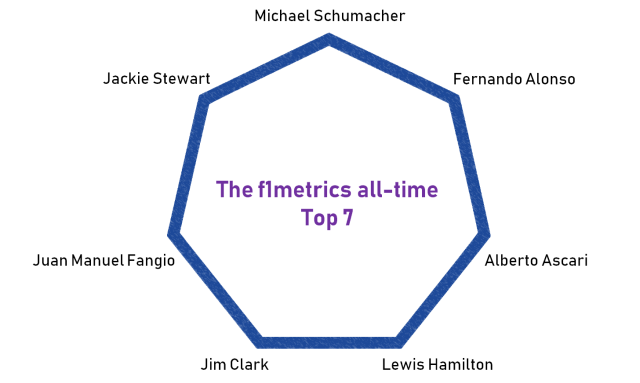
The new model identifies a set of seven all-time greats, who each rank within statistical uncertainty of the #1 position (in the range 8.48-8.91 ppr). They are Michael Schumacher, Jackie Stewart, Fernando Alonso, Juan Manuel Fangio, Alberto Ascari, Jim Clark, and Lewis Hamilton. While the model identifies that today’s F1 drivers are generally systematically stronger than drivers of the past, this top seven is a collection of outlier performers who span the eras of the sport.


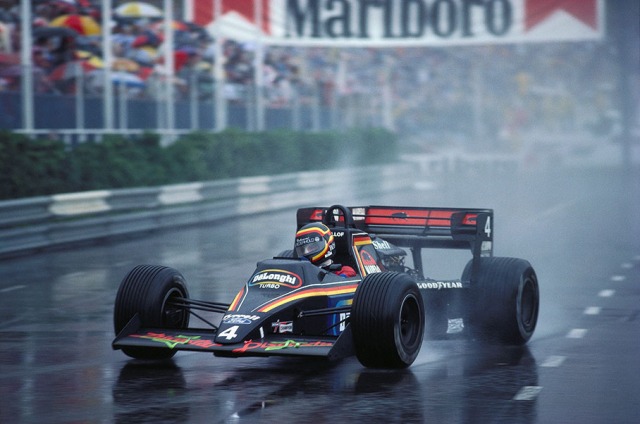


 In 1984, McLaren had an unbeatable combination: the clear best car and the best overall driver pairing. Both Lauda and Prost doubled the points scored by Elio de Angelis, who finished 3rd in the championship. Racing for Ferrari, Villeneuve is predicted to perform better than either Alboreto or Arnoux managed with the car, but is still a clear 3rd in the championship.
 In 1985, Michele Alboreto mounted a serious title challenge in the first half of the season, which fell away with five mechanical failures in the last five races. The model predicts that Villeneuve could have extracted a bit more from the Ferrari than Alboreto, but still not quite enough to overcome the fundamental reliability issues to take the title from Prost.
 Beyond 1985, it would be difficult for Villeneuve to challenge the new elite, including Senna and Prost, especially if he remained at Ferrari, who were not seriously competitive again until 1990. In this alternate history, Villeneuve ends up with two championship titles (1982, 1983) and two near misses (1979, 1985). Ramifications of this timeline would include Keke Rosberg scoring no drivers’ titles, and Nelson Piquet scoring two drivers’ titles.


 In 1997, Schumacher once again was fighting a dominant Williams team in an inferior car. This season, the model rates the Ferrari and McLaren as very closely matched, meaning Schumacher’s results are almost identical after a car swap.
 In 1998, the first season that Newey had full input into car design, McLaren produced the dominant MP4/13, which Hakkinen took to the title in spite of some brilliant drives from Schumacher. With the best driver in the best car, the model sees the 1998 season as a walkover first title for Schumacher at McLaren.
 The 1999 season was marred by Schumacher’s broken leg after a brake failure in the British Grand Prix, causing him to miss six races. It is difficult to know what to do with this case in a hypothetical history. Do we assume Schumacher still missed races at McLaren? Do we assume the brake failure happened to Hakkinen and caused him to miss races instead? Or do we assume it was a freak accident that would not repeat and give both drivers a full season? We are essentially free to invent whatever history we want here, so I have not run a hypothetical reconstruction of 1999.


 In 2004, the McLaren was unreliable and uncompetitive until the MP4-19B chassis upgrade in the second half of the season. Raikkonen historically managed only 45 points in the car. The model thinks Schumacher could only have done slightly better with it, while Raikkonen would romp to the title in the unbeatable F2004, in similar fashion to what Schumacher actually did that year.
 The first chapter of Schumacher’s career concluded in 2006, as he retired at the end of the year. It was a close championship battle with Fernando Alonso at Renault, with Renault starting the season with a clear advantage until their mass-damper solution was banned. The McLaren was the clear third-best team. Had Schumacher swapped seats with Raikkonen, the model predicts that he could have challenged Raikkonen for 2nd in the championship despite the slightly inferior machinery, but he would not have been in the title fight with Alonso.
 Beyond 2006, we could imagine Schumacher continuing at McLaren into 2007-2008, as we did in the above hypothetical, but he could equally well have retired at this point, as he did in reality.


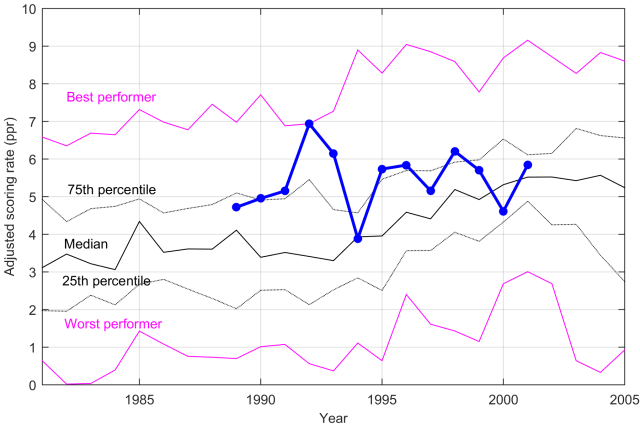 In his first two years at Tyrrell (1989-1990), Alesi was already performing well above the average driver. His 1992 season performance is actually ranked the best of any driver that year, as he scored 18 of Ferrari’s 21 points in a very difficult year for the Scuderia. It was Ferrari’s least competitive car since 1981, while Williams — the team Alesi rejected — romped to both titles.
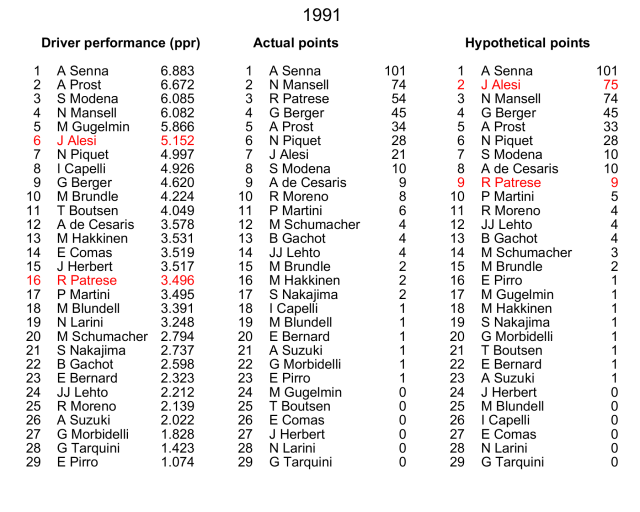 Had Alesi driven for Williams in 1992, he would have had an incredibly dominant car at his disposal.
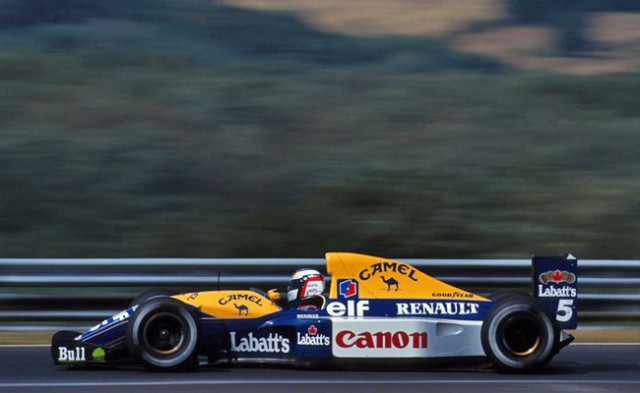
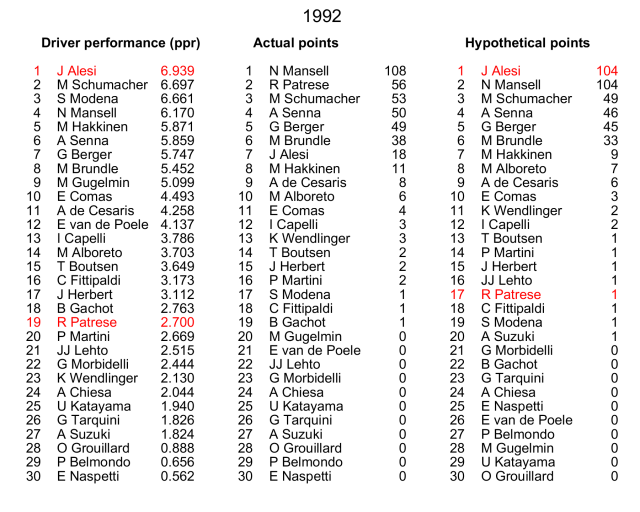 Naturally, this is assuming Alesi wouldn’t fall for
 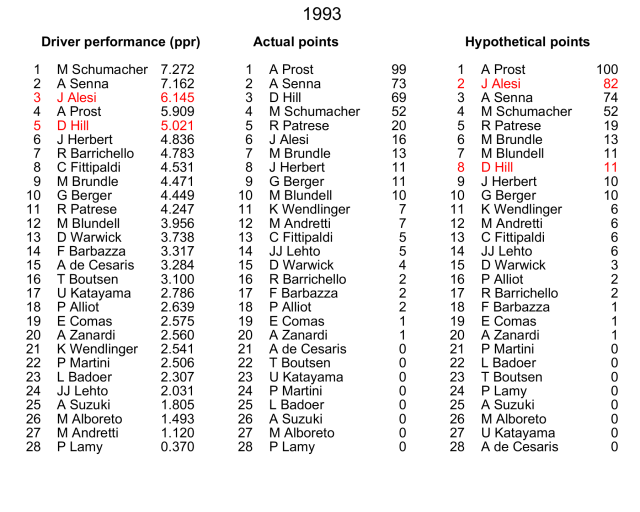 In 1994, Alesi’s performance is rated considerably weaker than in 1993, as he was historically beaten comfortably by his Ferrari teammate Gerhard Berger. A seat swap between Alesi and Hill this time is bad for Williams, good for Ferrari. Alesi is predicted to finish a distant 2nd in the championship, with Schumacher given an easy path to his first title.
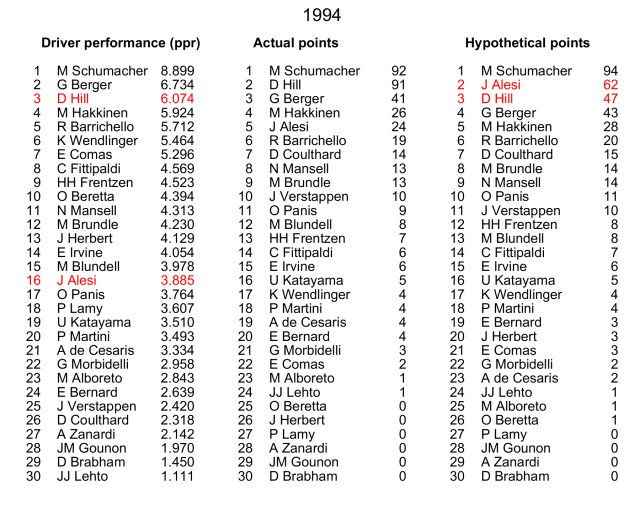 This hypothetical clearly demonstrates how one or two bad team decisions can completely shape a driver’s career metrics of success. In his actual career, Alesi never finished better than 4th in the championship and won just one race. In the above hypothetical, he would compete for two titles, potentially winning one, and likely winning at least 15 races, putting him among the top 20 most successful drivers in F1 history. I think many would consider this a more fitting legacy for Alesi.
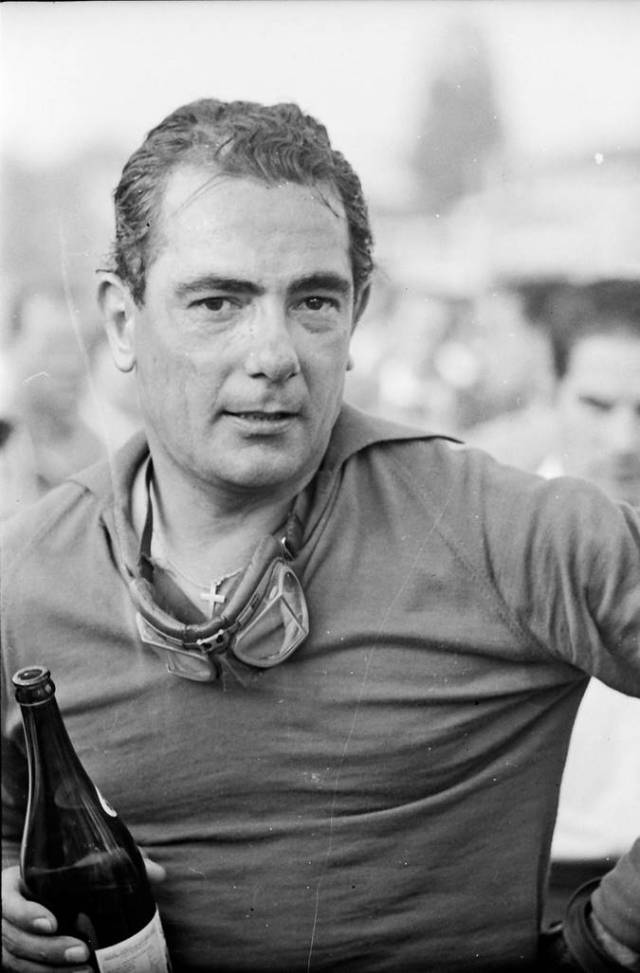
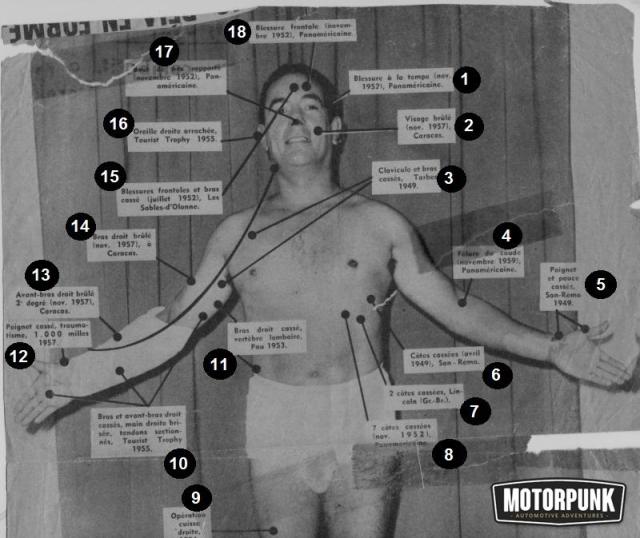

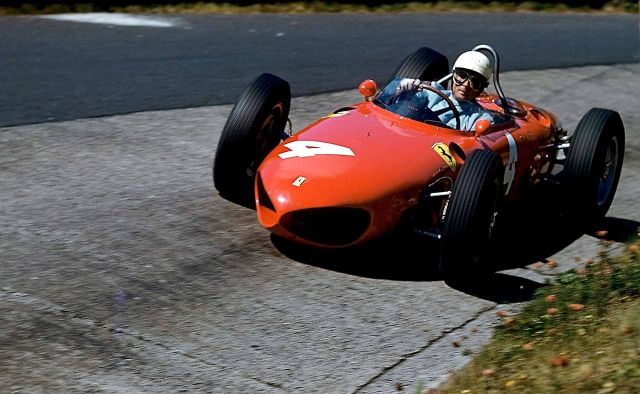
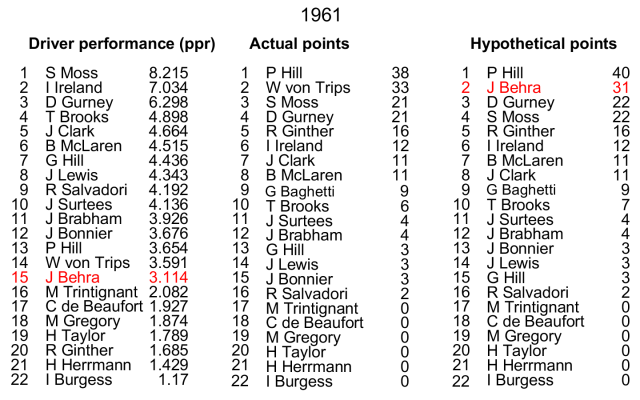

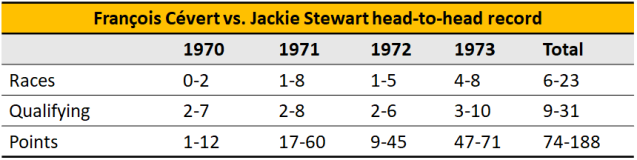
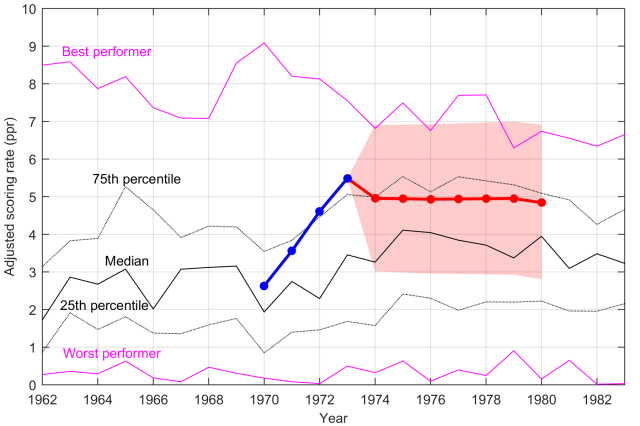
 In 1975, Tyrrell took a major step backwards, falling to 5th in the constructors’ championship. Assuming he was still with the team, Cevert is predicted to score 19 points, similar to the 20 points that Scheckter actually scored.
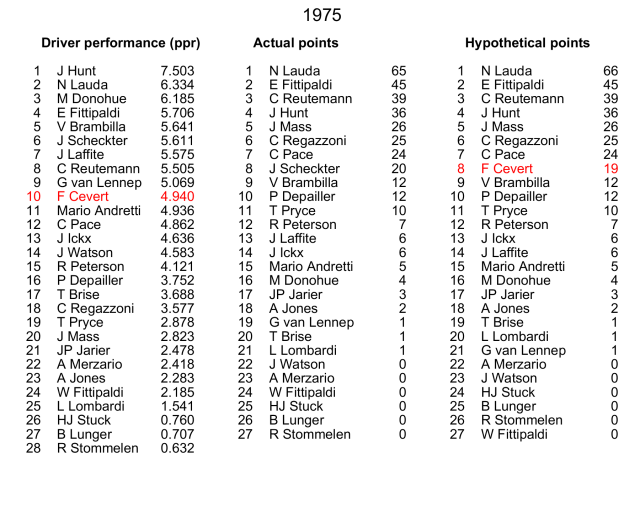
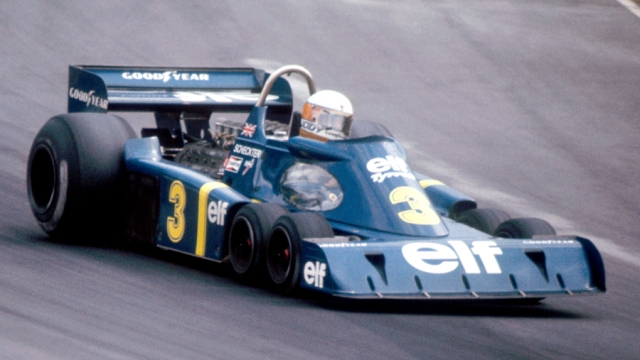
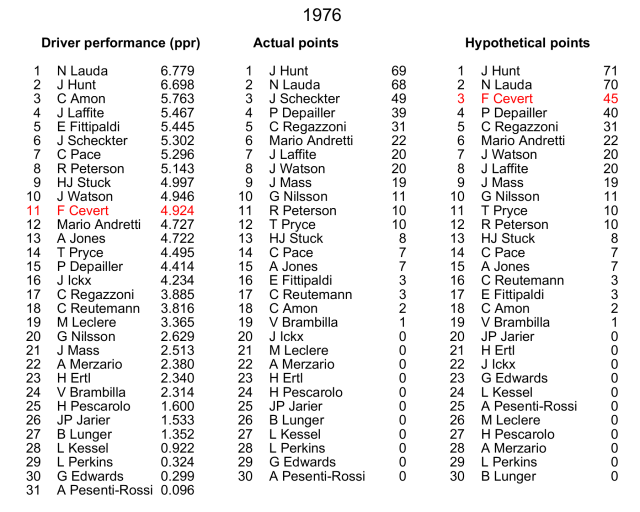


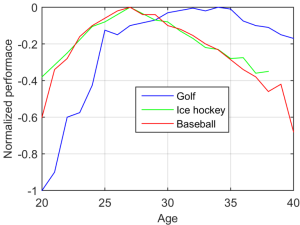
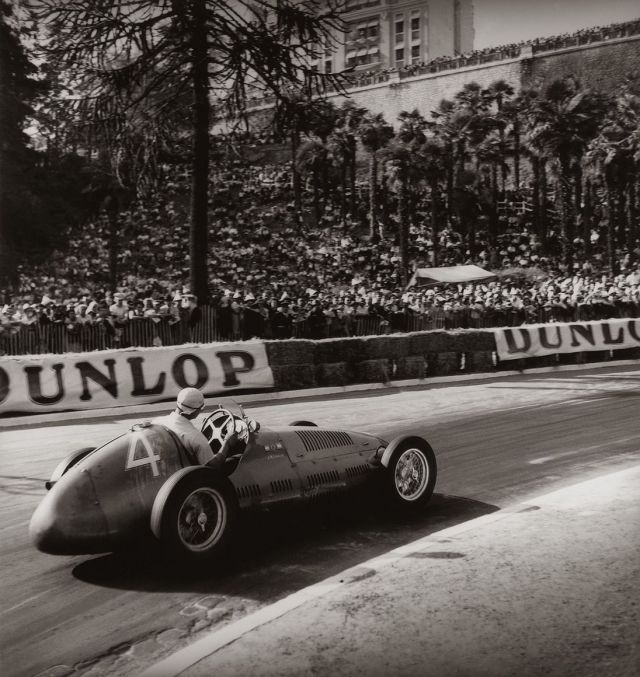
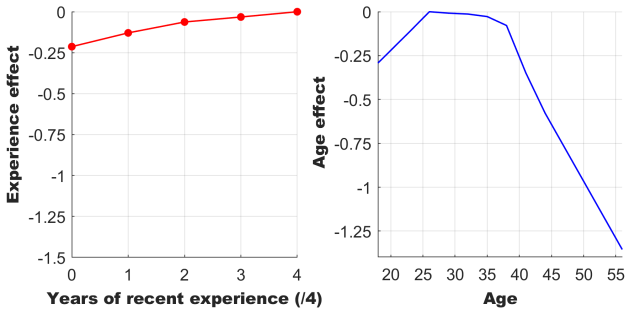


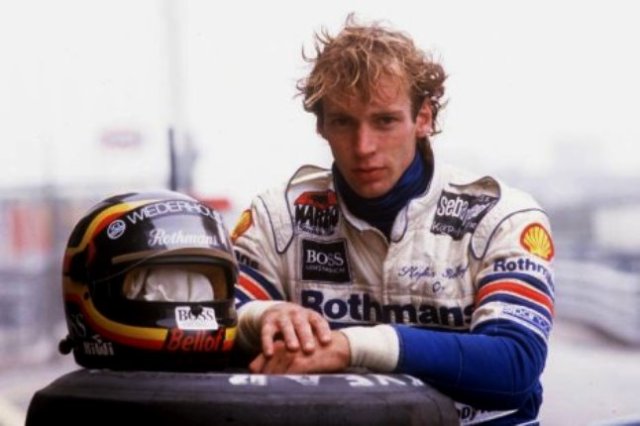
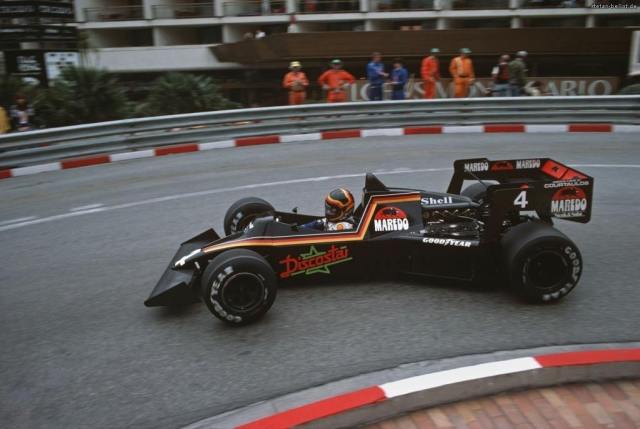


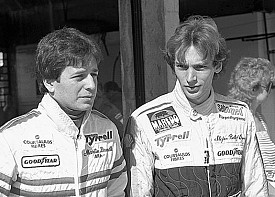
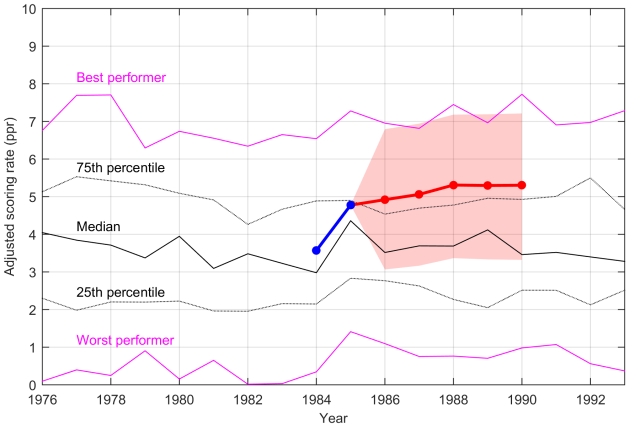
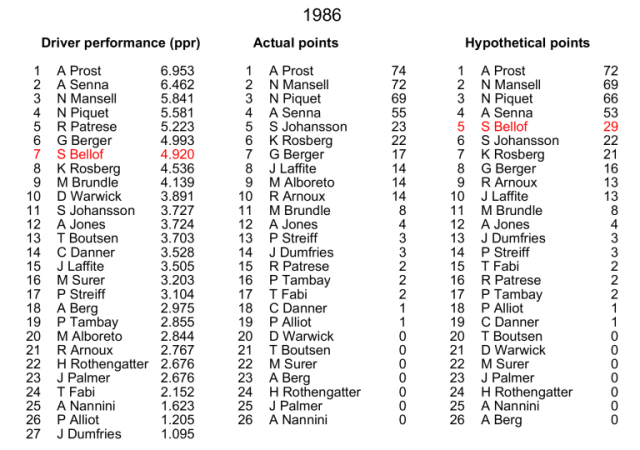 Had he continued to race at Ferrari in 1987, the model predicts that Bellof would have slightly outperformed teammate Berger. But, due to Berger’s run of fewer mechanical DNFs in what was an extremely unreliable car, he may have come out slightly ahead of Bellof in the points standings. Neither driver could realistically have competed with the dominant Williams team for the title.
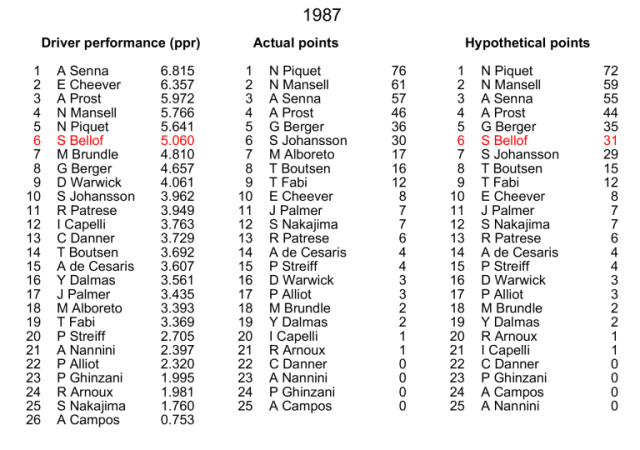 In 1988, Ferrari faced the unbeatable McLaren-Honda team. The model sees Bellof as scoring best of the rest, slightly ahead of teammate Berger.
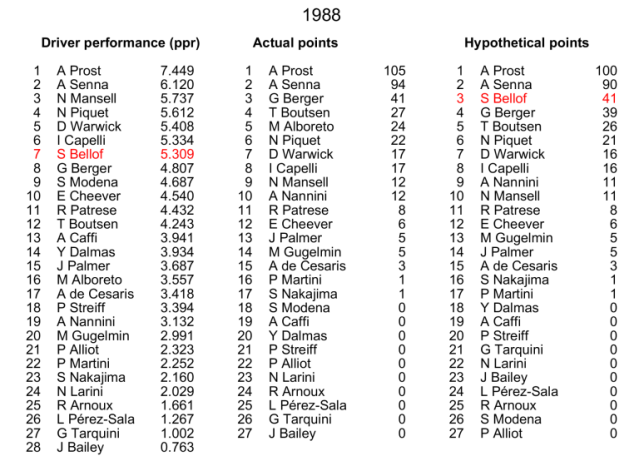 McLaren continued their extremely strong form into 1989 while Ferrari faltered. Neither Bellof nor Berger could have challenged for regular wins, but again the model sees Bellof as potential team leader ahead of Berger.
 By 1990, Ferrari were a force to be reckoned with, taking the title down to the wire with McLaren. In this hypothetical scenario, Bellof partners reigning champion, Alain Prost, taking the seat that Nigel Mansell actually held. By the model’s prediction, Bellof would have finished around 3rd in the championship, given a typical run of reliability that year (Mansell had an abnormally poor run with 8 of the team’s 11 mechanical DNFs).
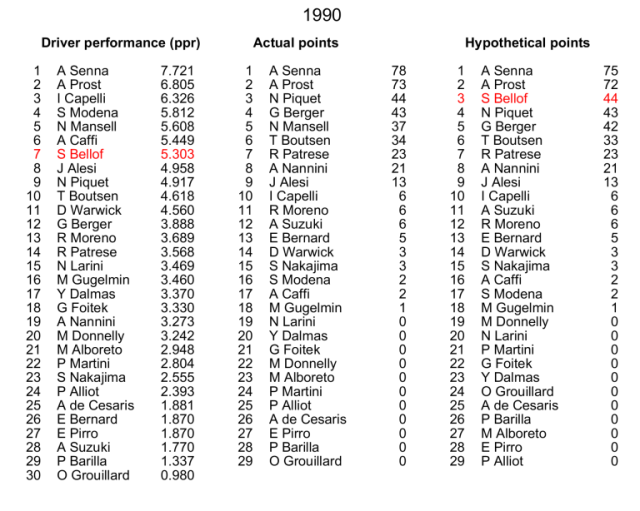
 Ex-champion comebacks

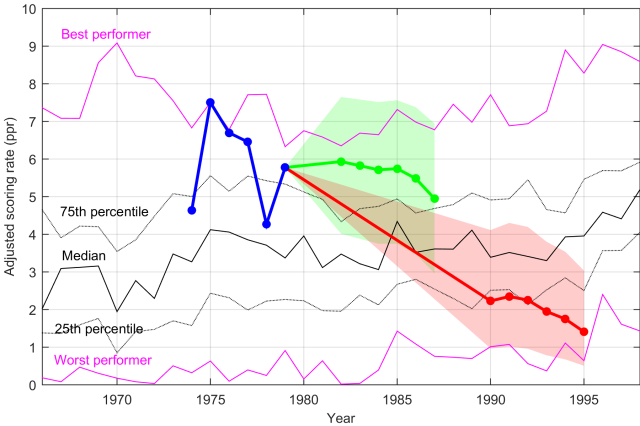
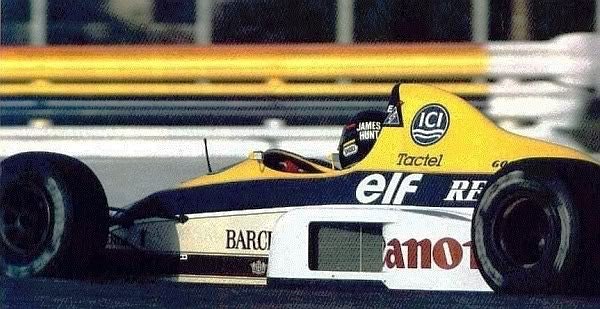
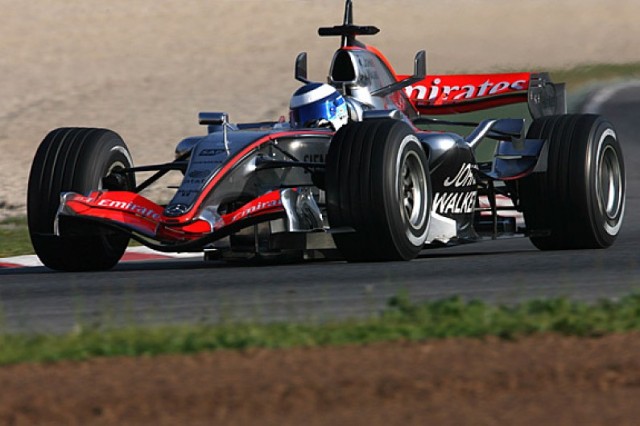
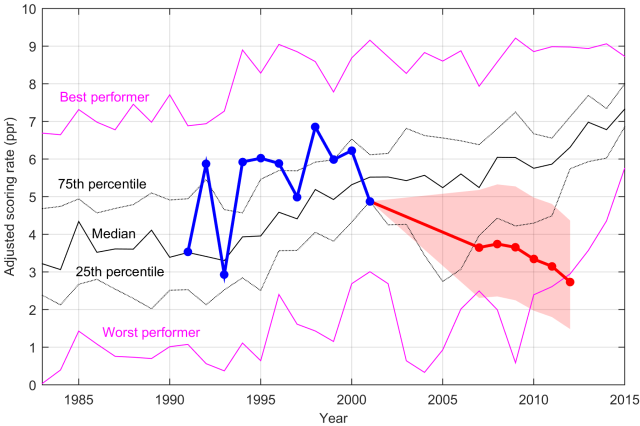
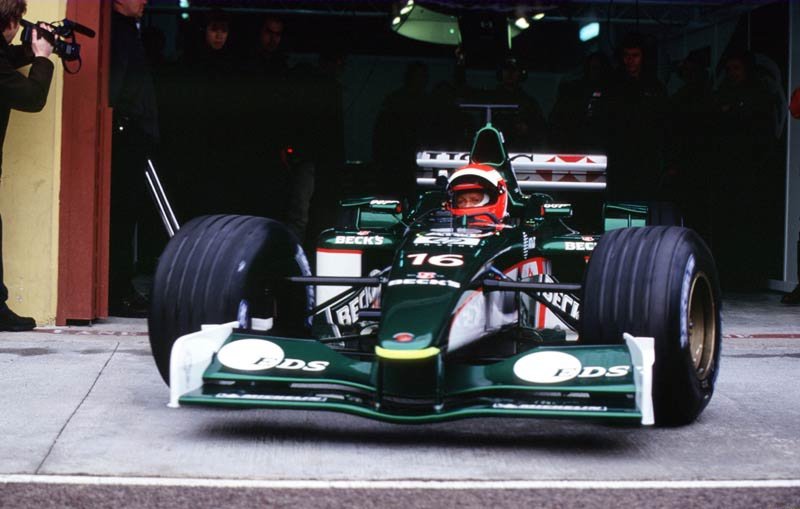
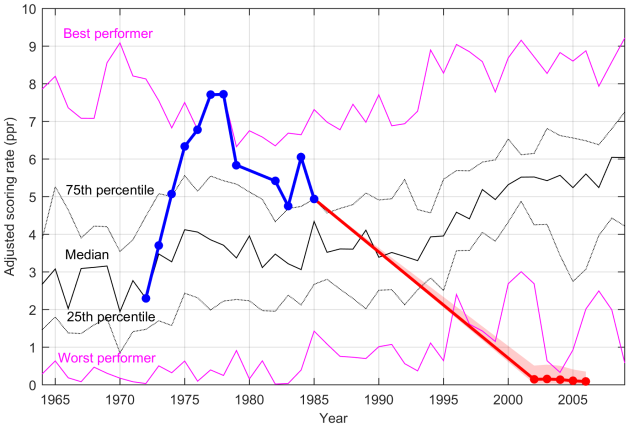


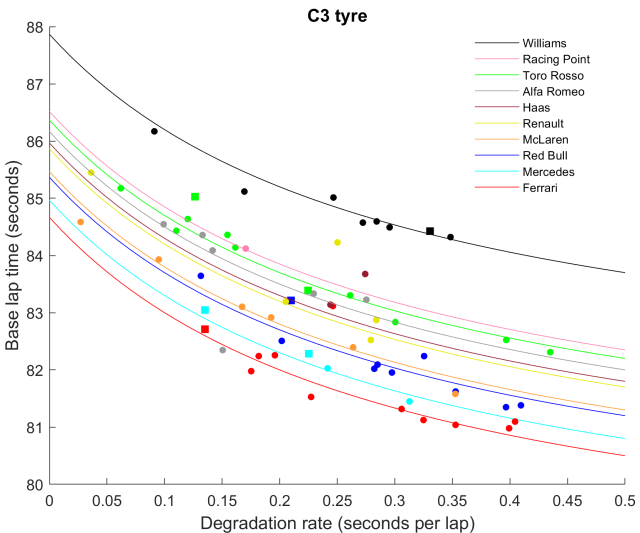


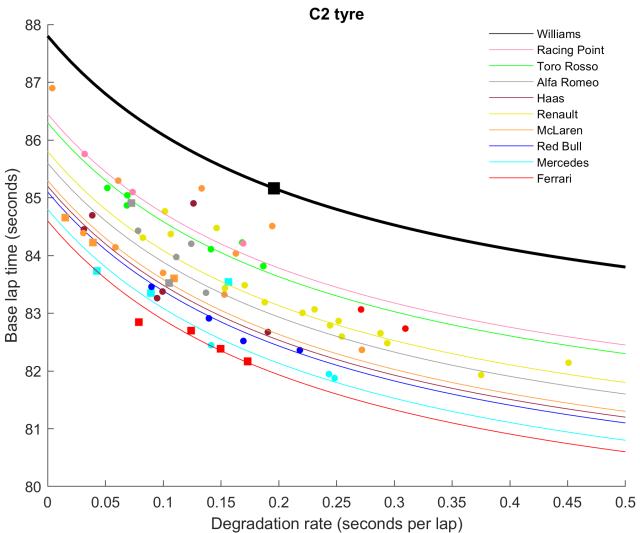

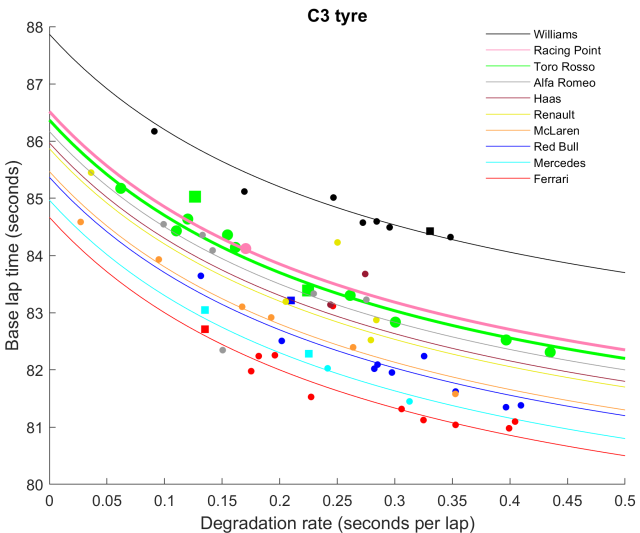
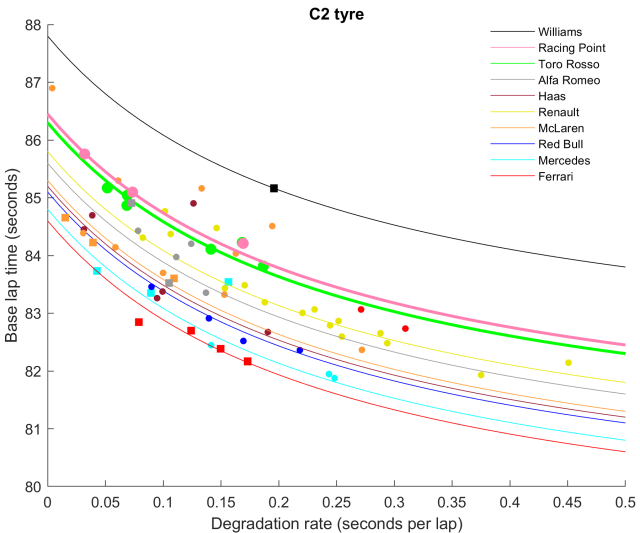

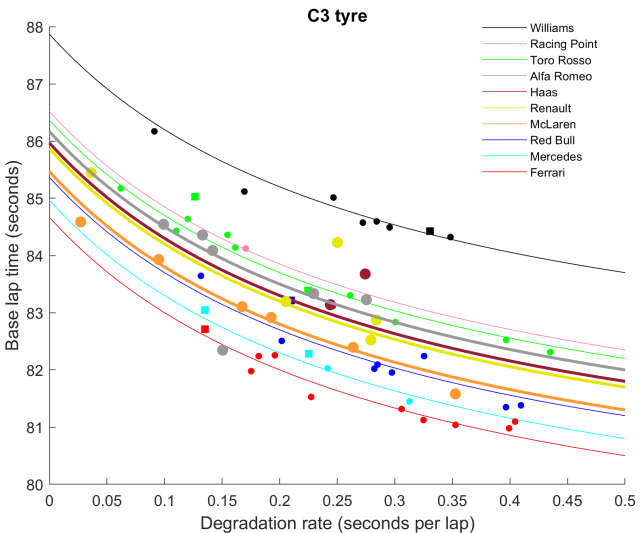
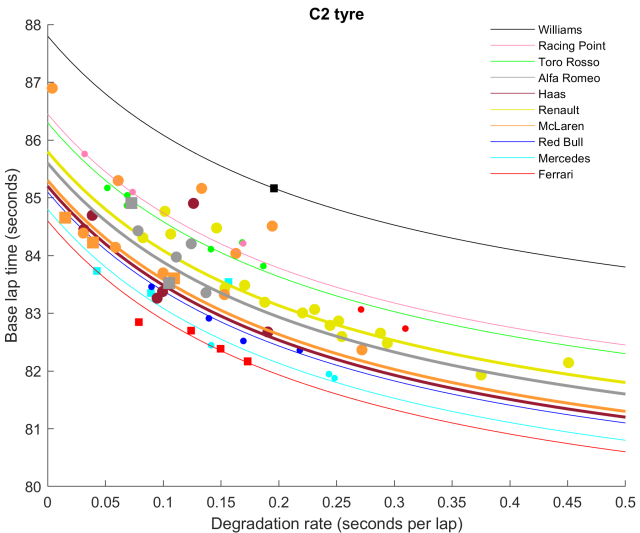
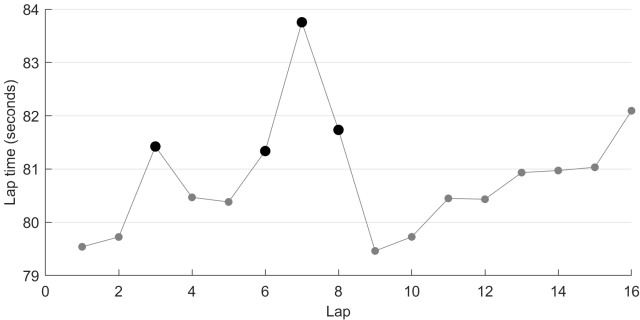


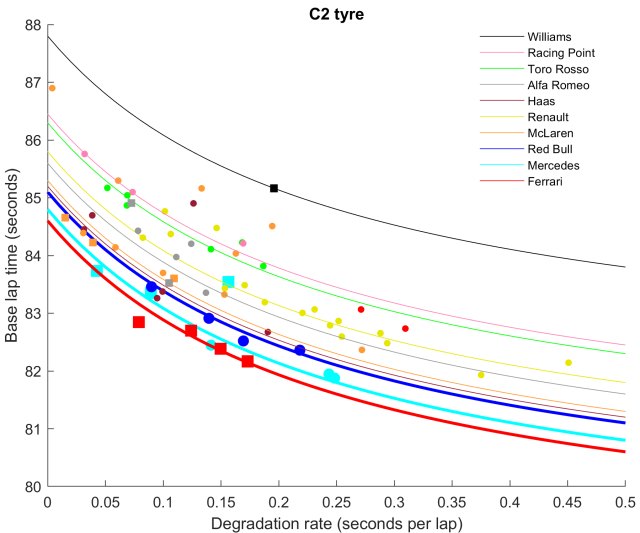

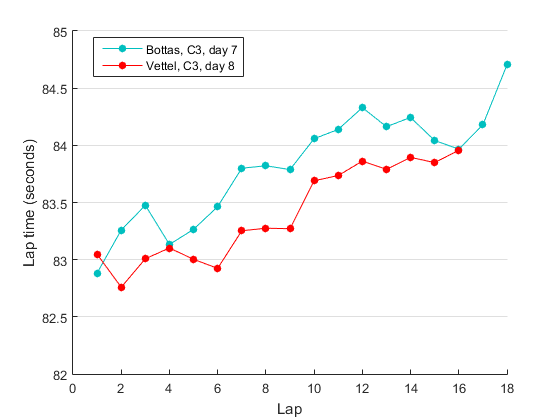
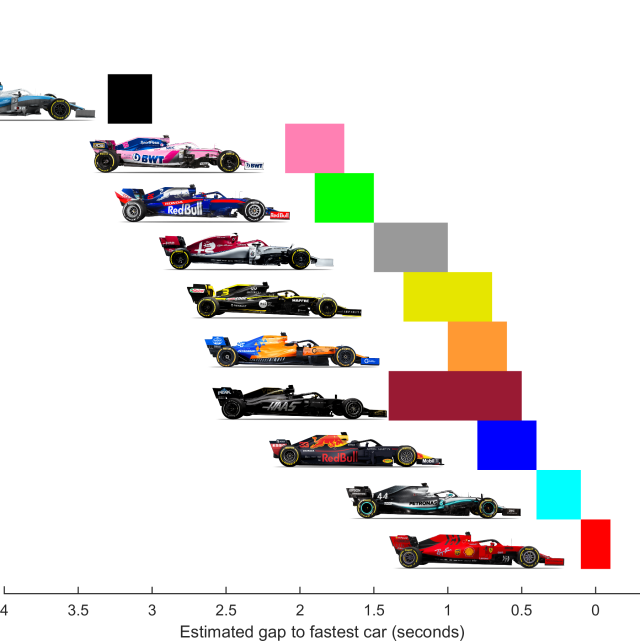


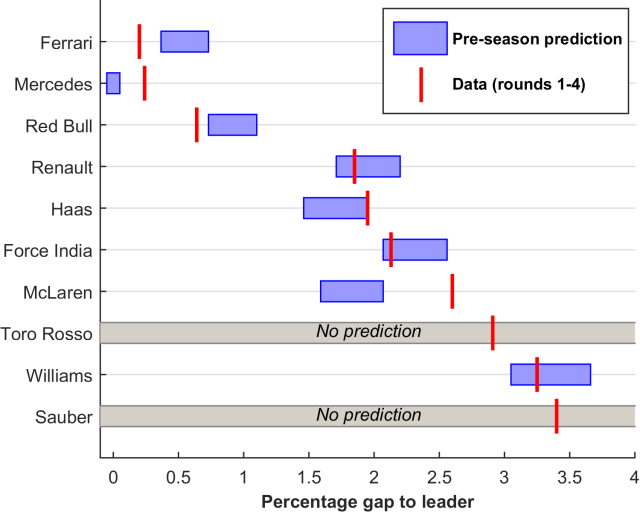
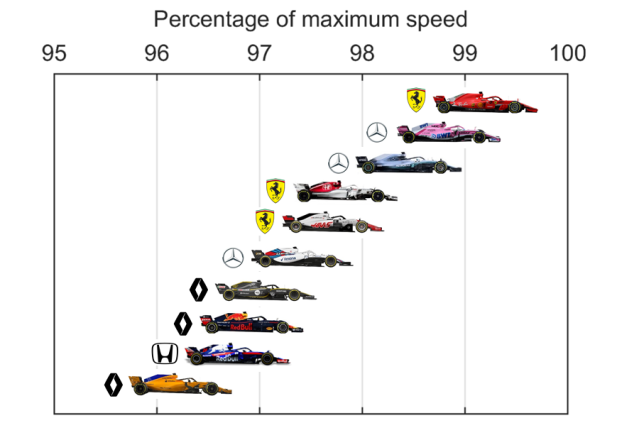

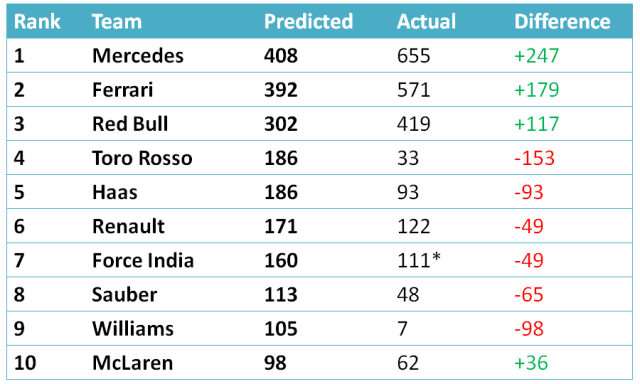

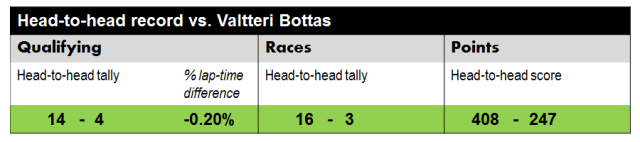

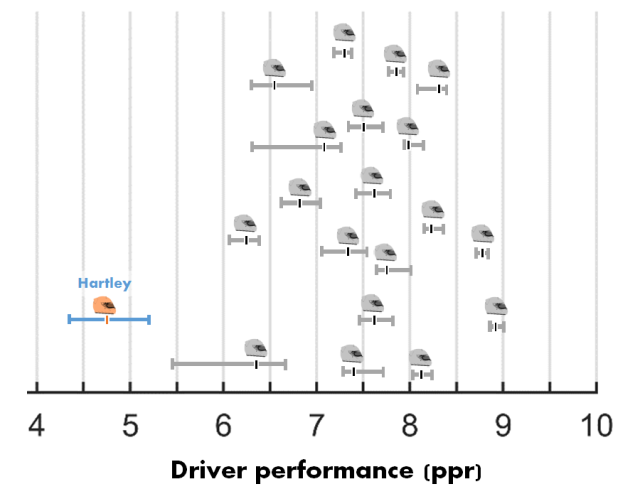

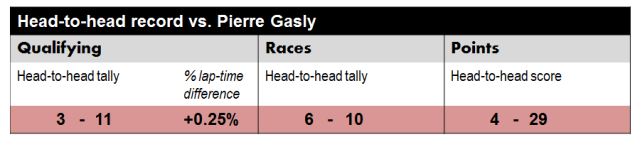
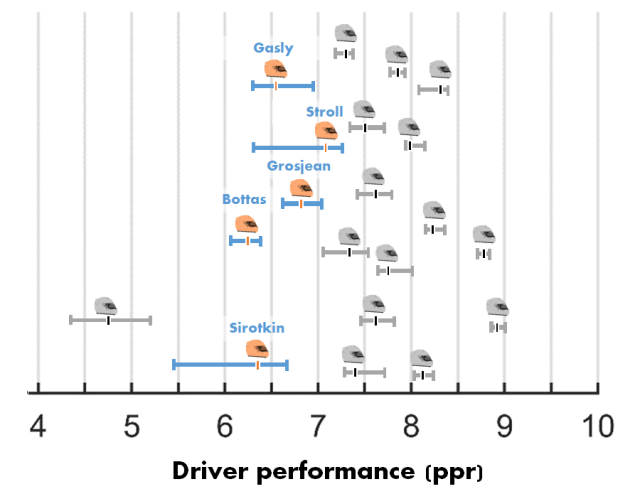


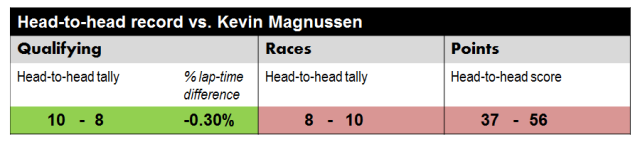
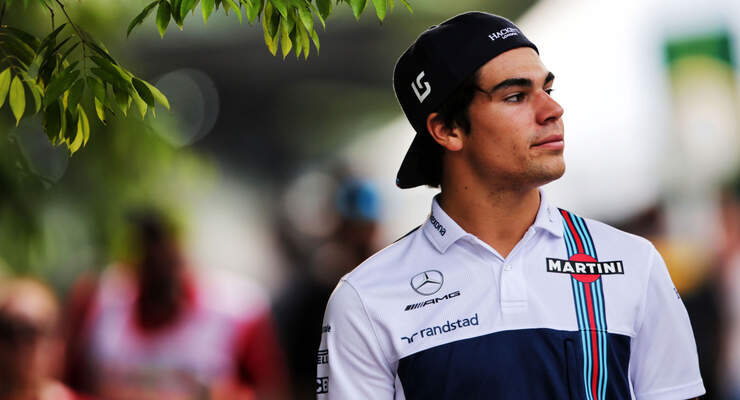
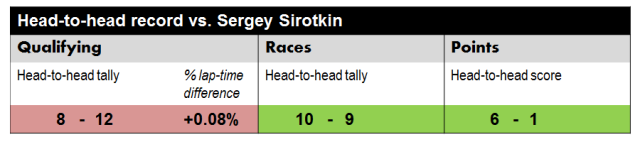
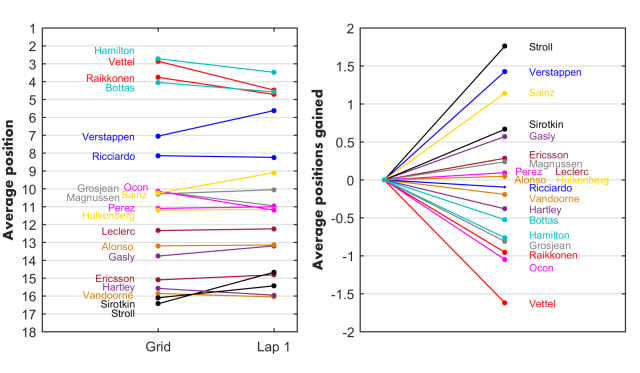
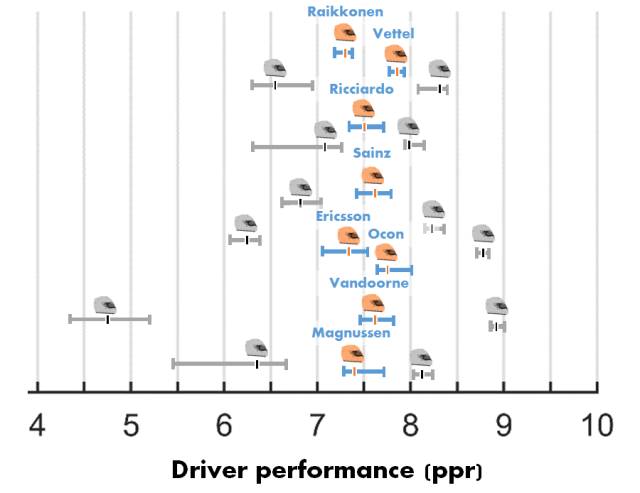
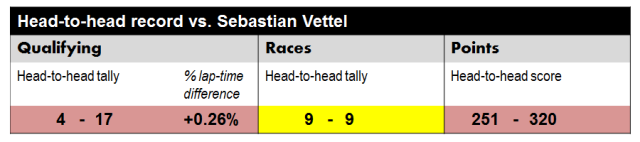




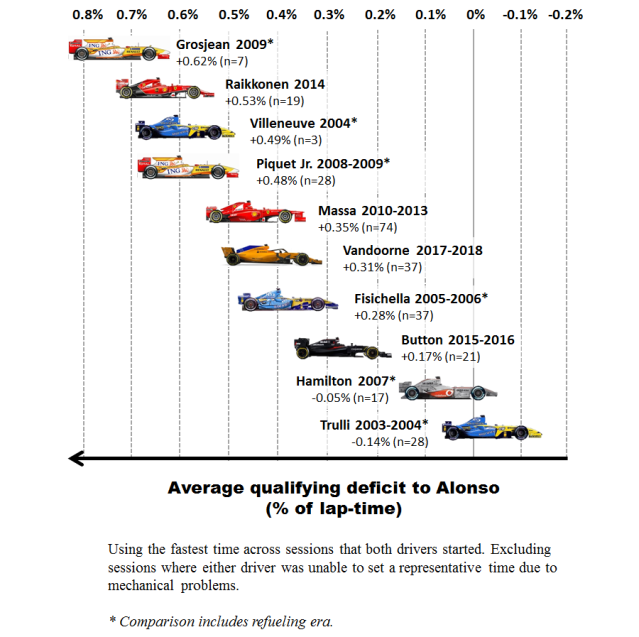


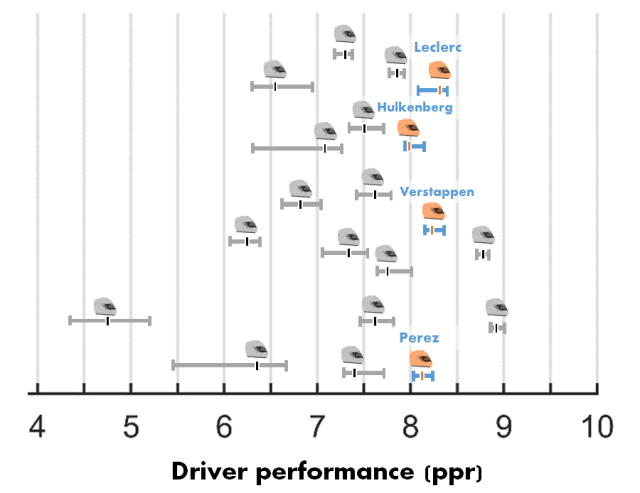
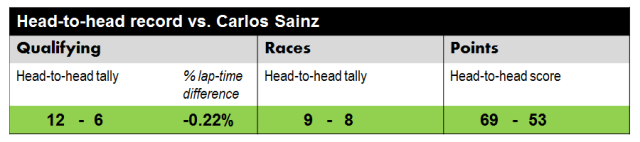


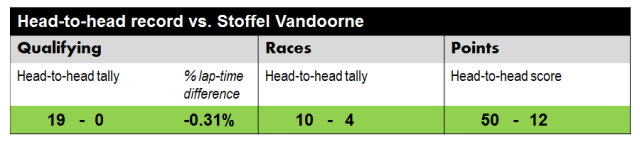
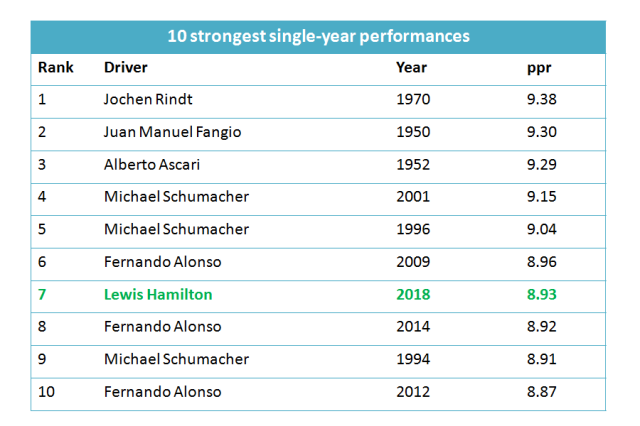


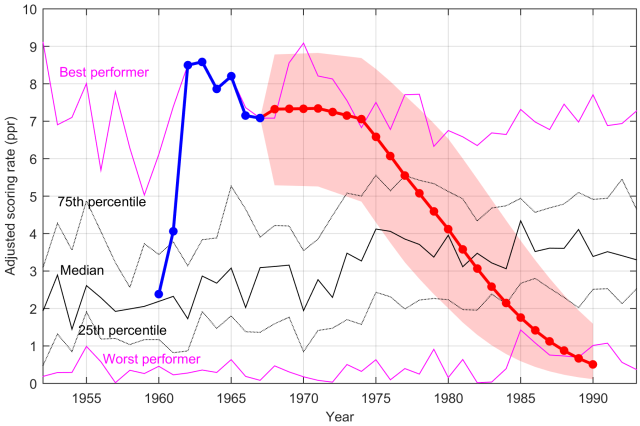


 Beyond 1973, the Lotus team tailed off in performance due to the abortive Lotus 76 project, to the extent that even a driver of Clark’s abilities would not be predicted to challenge for titles. By the time they became dominant again with the mastery of ground effects on the Lotus 79, Clark would have been past his best. It’s plausible that Clark would have simply retired at the end of 1973, aged 37, joining his compatriot Stewart.
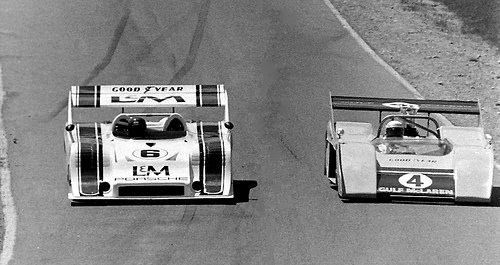



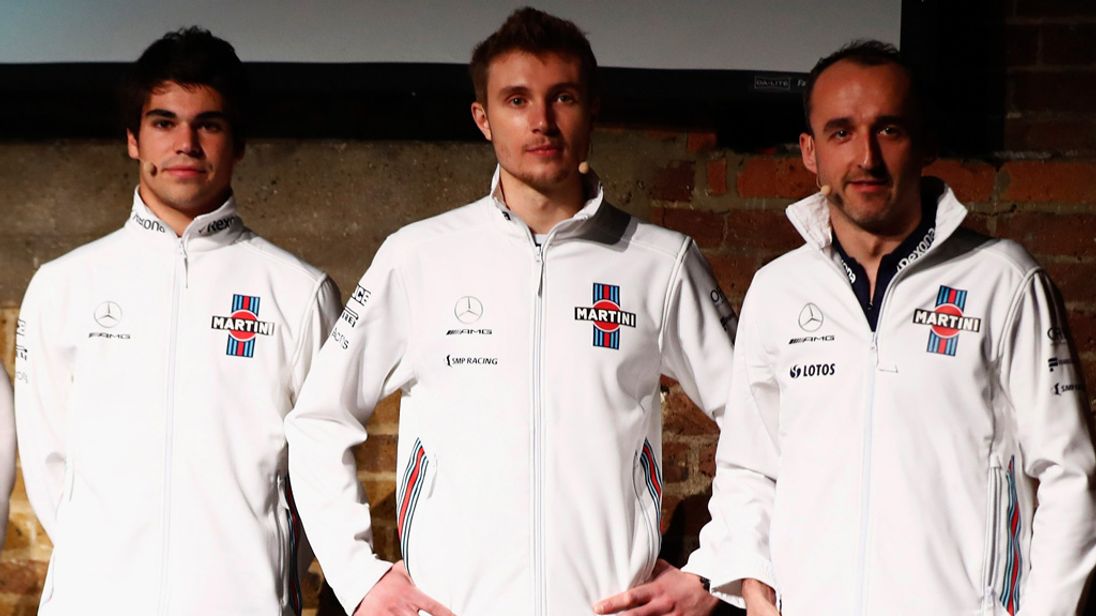
 For 2012, Kubica had a signed agreement to join Ferrari, ousting Felipe Massa. This would have placed Kubica in a potential championship fight for the first time, but also in the unenviable position of facing Alonso as a teammate.
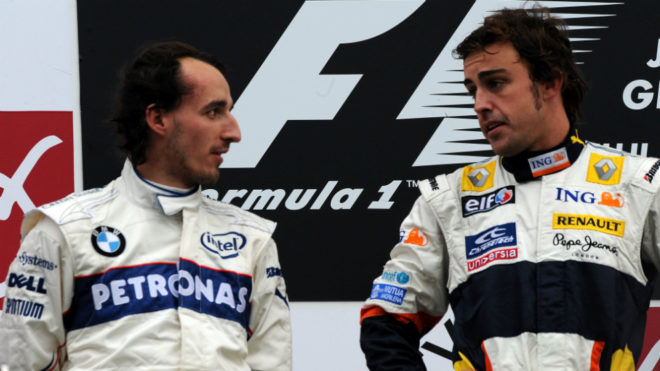


 The blue curve shows Senna’s actual career. The red curve shows his predicted future performances, with the surrounding shaded error showing the combined standard error in the estimate of Senna’s average performance, the age function, and the experience function.
 In 1995, the model thinks that Senna would have pushed Schumacher much further than Hill managed, but Schumacher’s superb performance is enough to clinch the title: his first in this alternate reality.
 With the dominant Williams in 1996, the model sees Senna taking the title quite easily ahead of teammate Hill. Schumacher worked miracles for Ferrari that year, and is the model’s standout performer, but the car was simply nowhere near quick enough to be a championship challenger.
 In 1997, Senna again have would enjoyed a significant car advantage over Schumacher in this like-for-like hypothetical — indeed, just enough to clinch the title, in the model’s predictions. Aged 37, Senna would be starting to suffer age-related decline, and his performance is predicted to be only marginally better than Villeneuve’s that year. With a total of six titles (one more than his hero Fangio, and two more than arch-rival Prost) and major regulation changes coming in 1998, including grooved tyres and narrower cars, it’s quite easy to imagine Senna retiring at this point.


 It’s difficult to meaningfully speculate on Brise’s career path. He was signed to drive for Hill’s Embassy team again in 1976. From there he might have been considered for a Williams drive, like Alan Jones. He might have been in the picture for John Watson’s Brabham drive in 1977. Or he might even have been offered the Ferrari seat when Lauda retired in late 1977, instead of Gilles Villeneuve. In any case, had he landed in a top team, he very likely would have challenged for titles.


