GeistHaus
log in · sign up

https://9600.dev/index.xml

rss
6 posts
Polling state
Status active
Last polled May 18, 2026 19:00 UTC
Next poll May 19, 2026 20:19 UTC
Poll interval 86400s
ETag W/"479b3d6bbce14156bfe2cd592d5b938e"
Last-Modified Wed, 29 Jan 2025 00:47:10 GMT

Posts

Comprehensive Thoughts on AI

This document aims to:

  1. Provide a high-level understanding of Artificial Intelligence/Machine Learning and how it works.
  2. Go deeper on LLMs (Large Language Models) and why they’re important.
  3. Help you create a prediction framework for the intelligence level of AI over time.
  4. Highlight the non-linear impact of AI on business, government and politics.

The second part of the document is more technical, covering a broad range of engineering topics:

  1. Explore what AI scaling will look like over time.
  2. The technical soup to nuts: from hardware to model.

The key takeaways of the document:

  • AI generates non-linear effects on deployed systems/ecosystems, enabling non-linear value generation.
  • Rich feedback loops in AI systems is necessary for non-linear value.
  • AI systems will have a larger impact on social, economic and political than the original software revolution that started in the 80’s.
📝 Vocabulary: AI, Artificial Intelligence, and Machine Learning are used interchangeably. ‘AI’ broadly encapsulates technology and products, while ‘Machine Learning’ refers to machines learning from data. Examples of AI in Action

Let’s tour the AI technology and product landscape before trying to build an understanding of how it works. You can skip this section if you’re familiar with products and model types.

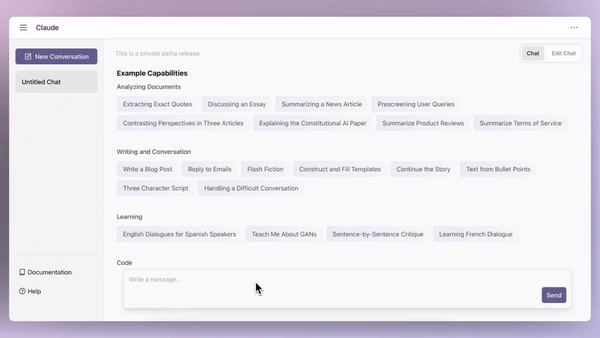
ℹ️ Models, Model Type: described in the “What is a ML Model” section. A model is the output of a machine learning process which can be used by software to accomplish a task, usually the task the model was trained to perform. Model Type Tasks Generative Chatbots (ChatGPT, Claude etc), Video/Audio generation, code generation. Object detection, tracking Identifying/tracking objects, scenes or people in images and video. Making predictions on objects locations/trajectories. Demo Speech Cloning, tuning, speech to text, etc. Demo Text Translation, Classification Language translation, sentiment analysis etc. Demo, Demo Recommendations Search engines, YouTube recommendations, etc. Demo Games, Game Theory Game engines, combatants, etc. Demo, AlphaStar Starcraft II Optimization Compression techniques, generated code optimization, game engine up-scaling, etc. Creative Sketches to imagery, auto video generation, diffusion. Demo, Demo Large Language Models

Large Language Models (or LLMs) are noted for sparking widespread business and consumer interest in AI, starting with OpenAI’s ChatGPT model. There are several “frontier” LLMs, where the creators of those LLMs are pushing the frontier of intelligence in the model: Claude.ai from Anthropic and Gemini from Google. There are several models that are an intelligence generation behind, like Llama from Facebook and Mistral.ai from Mistral Labs.

Object detection, tracking and segmentation

State of the art (SOTA) object detection now includes high fidelity segmentation (bounding boxes) and the ability to track those segments across frames. Two examples of object detection models: Segment-Anything, Track-Anything

Speech

SOTA features include: speech-to-speech (OpenAI has an almost flawless implementation of speech-to-speech); speech-to-text recognition of hundreds of languages (used for YouTube closed captions); flawless text-to-speech (useful for Audiobooks etc); speech enhancement; lip reading, and more. Prime Voice AI, AutoAVSR

Generative Image Creation

Stable Diffusion, MidJourney, Microsoft CoPilot Image Creator, OpenAI Dalle3

“a portrait of an old coal miner in 19th century, beautiful painting with highly detailed face” out-0.png|515

Generative Video Creation

NVIDIA - High-resolution video synthesis with latent diffusion models, MakeAVideo - Meta, Gen-2 Runway (StableDiffusion text to video):

“animated scene features a close-up of a short fluffy monster kneeling beside a melting red candle. the art style is 3d and realistic, with a focus on lighting and texture. the mood of the painting is one of wonder and curiosity”

Generative Game World Creation

Tencent built “GameGen-O” an AI that generates open-world games from text prompts:

Ranking and Recommendation

Most popular mobile and web apps are utilizing AI to predict what you’re interested in. The “feed” that is generated for Facebook, Instagram, TikTok etc, is unique to you, where a AI model is trained to optimize for your engagement and time spent. The better the AI is able to predict what you’re interested in, the longer you stay on the app.

Combination of Multiple Model Types

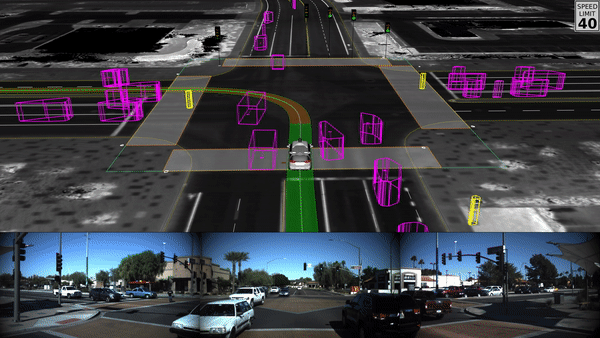
Self driving cars are an example of multiple multiple model types (image, object recognition, route planning, etc) being aggregated together to solve for a complex task like driving a car in a dynamic environment: Waymo - self driving cars

The best online places to see where machine learning model innovation is happening are:

The basics of how ML works

Now that we’ve had a look at the top-down capability of machine learning/AI from a model and product perspective, we will start the journey to understand the basics of how machine learning works under the hood.

What is an ML Model?

There are well articulated definitions of what machine learning models are on the Internet, so I’ll say that models are essentially a piece of software that takes data as an input, and makes a prediction as an output in a domain we care about. Models are trained by looking at lots of input examples, trying to guess the output, and when there is error, the model updates itself to be less erroneous next time. Given enough examples, the model will be more precise, and hopefully general enough to give accurate predictions on input it has not seen in training.

This concept is unlikely a surprise, as we’ve been using “machine learned” models in tools like Excel for years. And ironically, one of the easiest Excel modeling techniques, linear regression, is the fundamental building block for how machine learning works in the large.

A quick recap of linear regression: We’ll build a simple linear regression model to predict house prices. Let’s take some synthetic historical house price data, which I’ve plotted below (x axis is land size in square meters, and the y-axis is the price the house sold for):

Asking Excel to generate a Linear Regression model with a couple of clicks gives me a nice red line, and a function representing the linear model:

y = 603x + 139333

Where y is the house price prediction, x is the land size input and the 139333 is the y intercept.

The slop intercept form of the linear equation above is y = mx + b, and has two parameters: m and b. m represents the slop of the line and b determines where the line is positioned vertically on the y-axis. These two parameters form the crux of the model.

We can now ask the model for its prediction on what the price would be for a Brisbane house given a previously unseen land size of 1095 square meters:

$799,618 = 603 * 1095 + 139333

While Excel uses linear regression to figure out the best model, the machine learning world does something different:

  1. it starts with random numbers for all the parameters in the model
  2. it checks to see how good a fit that model is to the data and calculates the “error” or “loss” with respect to the data
  3. it adjusts the parameters of the model to make the “error” or “loss” be less error prone
  4. repeat steps 2 through 4 until the error is really small

Let’s try:

price = random_p1() * land_size + random_p2()

So for random_p1(), let’s assume it generated 300 as its random starting point, and 100,000 as random_p2():

Not terribly close to reality, so let’s bump the random_p1() and random_p2() numbers up, so that line gets a little steeper: y = 400 * land-size + 150000 Better!

Now we’re going to repeat the “tuning” of those two parameters until the line has the least amount of “error”:

m = 300 -> 400 -> 550 -> 650 -> 610 -> 603
b = 100000 -> 150000 -> 140000

And that’s it. The machine has learned the most appropriate variables with the least amount of error are “603”, and “140000” such that price = 603 * land-size + 140000.

Before we move on, let’s go through the vocabulary definitions as they relate to machine learning for the example we’ve just seen:

  • The initial number we used for random_p1() and random_p2() to adjust the slope of the line and the y-intercept, in ML terms that’s called a “parameter” or “weight”. (In Linear Regression terms, it’s call the coefficient). Parameters or weights are the “heart” or “intelligence” of the model.
  • The “x” axis variable (Land Size) is called an “input parameter”. It’s the thing we give the model to make a prediction on.
  • The loop of:
    • Create a model with “parameters
    • Run data through the model and calculate the error
    • Bump the “parameters” closer to ensure a less erroneous fit for the data we’ve seen
  • This is called the “training loop”.

Two parameter models like the one we’ve built above can only generate straight lines (y-intercept and slope), which isn’t terribly useful particularly when we have data that is non-linear, like:

and isn’t terribly useful if you need to have many input parameters to describe the thing you care about (perhaps you want more than just land size, you want age of the house, bedrooms, bathrooms and so on).

So we need a way to (1) add more input variables, and (2) ensure we can capture any non-linearity in the model.

From one parameter to many

Scaling this to multiple input parameters is as simple as extending our linear equation to be a multivariate linear model in the form: $$ \begin{aligned} y = P_1x_1 + P_2x_2 + … + P_nx_n \newline \end{aligned} $$ There are multiple P or parameters, multiple x, which are the inputs (or input parameters), and y which is the predicted result, or thing we’re trying to learn. The training loop above still applies, we’re going to be nudging a lot more parameters in order to reduce the error now. This form however, is still insufficient to capture the non-linearity of the parabola example above (a quadratic function, while having more parameters, also uses an exponential term to represent the non-linear curve: f(x) = ax^2 + bx + c).

To get both many input-parameters, and a general way to create non-linear models that capture very complex relationships, “neural networks” were born, and they stand mostly on the shoulders of that multivariate linear equation above.

Neural Networks ℹ️ There are many synonyms for neural networks that you might come across: deep learning, deep neural networks, perceptrons, convolutional neutral networks (CNNs), large language models (LLMs) and so on. As an abstraction, you can group them all in to the same “neural network” label, even though the structure of the mathematical equation for each might be different, if you squint it’s all kind of the same general neural network math.

You may have seen some diagrams of Neural Networks, or Deep Neural Networks. These diagrams are a graphical representation of a much larger calculation that uses the multivariate linear equation above as its fundamental building block:

The high level view:

  • Each of those grey circles are “neurons”.
  • Each neuron has a set of “parameters”. The number of parameters is determined by the number of incoming connections it has from neurons on its left.
  • The neuron performs two calculations, before passing the result forward via the connections to other neurons on its right.
  1. Linear Combination: The first calculation is the multivariate linear equation we saw above, where input data is multiplied by parameters and summed: $$ \begin{aligned} l_1n_1 = P_1x_1 + P_2x_2 + P_3x_3 \newline \end{aligned} $$
  2. Activation Function: The second calculation applies an “activation function”, which introduces non-linearity to the model. The activation function aaa is applied to the result of the linear combination. For example, using the sigmoid activation function, this can be written as: $$ \begin{aligned} a(l_1n_1) = sigmoid(P_1x_1 + P_2x_2 + P_3x_3) \newline \end{aligned} $$ The activation function, such as the sigmoid function, helps the neuron to produce non-linear outputs, enabling the neural network to learn more complex patterns. The sigmoid function looks like:

Don’t let the math symbols worry you. Just think of every neuron computing the ‘y =’ multivariate linear equation from above, and then applying a function that generates non-linearity to the result. We take data in, multiply them by parameters, send them through the activation, and produce a result for the next neuron.

We have this fancy visualization of a neural network above, because it abstracts away the rather large and complicated equation or “model” that it represents:

$$ \begin{align*} \text{Layer 1:} \newline &a(l_1n_1)​​ = sigmoid(P_1​x1​+P_2​x_2​+P_3​x_3​) \newline &a(l_1n_2​)​ = sigmoid(P_4​x1​+P_5​x_2​+P_6​x_3​) \newline &a(l_1n_3)​​ = sigmoid(P_7​x1​+P_8​x_2​+P_9​x_3​) \newline &a(l_1n_4)​​ = sigmoid(P_{10}​x1​+P_{11}​x2​+P{12}​x_3​) \newline \newline \text{Layer 2:} \newline &a(l_2n_1)​​ = sigmoid(P_1l_1n_1​ + P_2l_1n_2 ​+ P_3l_1n_3 + P_4l_1n_4​) \newline &a(l_2n_2)​​ = sigmoid(P_5l_1n_1​ + P_6l_1n_2 ​+ P_7l_1n_3 + P_8l_1n_4​) \newline &a(l_2n_3)​​ = sigmoid(P_9l_1n_1​ + P_{10}l_1n_2 ​+ P_{11}l_1n_3 + P_{12}l_1n_4​) \newline &a(l_2n_4)​​ = sigmoid(P_{13}l_1n_1​ + P_{14}l_1n_2 ​+ P_{15}l_1n_3 + P_{16}l_1n_4​) \newline \newline \text{Output Layer:} & \newline &a(y_1)​​ = sigmoid(P_1l_2n_1​ + P_2l_2n_2 ​+ P_3l_2n_3 + P_4l_2n_4​) \newline &a(y_2)​​ = sigmoid(P_5l_2n_1​ + P_6l_2n_2 ​+ P_7l_2n_3 + P_8l_2n_4​) \newline \end{align*} $$

Making the Neural Network “Fit”

Just like the original Brisbane Land Size to Prices model, where we “nudged” the two parameters of the model in the correct direction depending on how much “error” the model produced, we do the exact same thing here for neural networks:

  • pass in the input data, perform the calculation for layer 1, layer 2 and the output layer, get the result from the output layer (a(y1), a(y2))
  • calculate the difference between the data we have to give us the “error” in the model
  • nudge all the parameters (in this case, there are 36 parameters total) in a particular direction to reduce the error
  • rinse and repeat until the error is low

The more neurons, parameters, and layers there are, the more “non-linearity” and space for the model to learn and fit the data properly. You can imaging that the result of the neural network learning process is a really strange squiggly line in ’n’ dimensions of space (i.e more than three, which is easy to visualize) which properly represents a general model of the data we care about.

And with that, we’ve just learned that you can go from a single line linear regression ‘fit’, to a non-linear fit by just composing together the same basic linear equation over and over and over again.

Input and Output Data Representation

The “input data”, or “input layer”, is always encoded as a number, so a question that regularly comes up is: “how are images, video, documents etc, represented as numbers in the input layer”.

They’re always converted to their numeric representation, and its just a case of learning what the best numeric representation is for the given data: Here, every pixel of the cat image is converted to it’s red, green, blue value and those values are used in the input layer. This implies that big images with tens of thousands of pixels, will be fed to a neural network model that has tens of thousands of input neurons, and may require tens of millions of parameters to allow the model to learn something about the image! The concept is the same for video, text, and so on. Everything is converted to a number and fed in to that first “input layer”.

Text for example, can be encoded using a simple character to number encoding:

  • a = 1.0
  • b = 2.0
  • c = 3.0
  • and so on

Output layers (or the prediction layer) can represent text, images, video and so on in the same way.

We could build a neural network model that takes an image as an input, and produces an inverted color version of the same picture as its output, like below:

The process to build this model is the same as what we’ve seen already:

  • Get a big set of examples of images: both the input image and example outputs (the inverted images)
  • Start with a neural network that has random parameters
  • Encode each image into a numeric representation, pixel by pixel
  • Feed those images to the neural network
  • See how close the output layer is to the example inverted image outputs
  • Nudge the parameters to reduce the error
  • Rince and repeat.
Hidden Layers

The ‘hidden layers’ that are shown in the deep learning diagram above have a magical property: through the mathematics of “nudging” parameters in the training loop, hidden layers and their neurons end up ‘specializing’ on smaller tasks within the overall task of predicting an output.

Let’s unpack that dense sentence with a diagram:

2bec22b0a19d188bf648c9b805611598.png

Here we’re trying to learn something about human faces (perhaps we’re trying to predict the mood of a face out of four different moods: happy, sad, neutral, angry). We feed the machine learning model lots of pictures of faces, and ask it to predict mood.

In order to perform that task, the model needs to learn skills that will help it better predict mood: what are the mouth and eyes doing, squinting? angled? etc. And in order to perform that overall task, the model will need smaller specialty skills, like finding edges in an image, finding contrast, identifying mouth, nose, eyes, and so on. If you look closely at the image above, you can see each hidden layer learning to perform those specialist tasks.

You can think of the “output layer” as asking the previous layer (the last hidden layer) for its judgment on the task that it’s a specialist in. That layer then asks the previous layer for its judgment, and then that layer asks the previous layer, and so on and so on.

This kind of implies that more layers means more specialties, allowing the model to perform more and more complex tasks. Too few layers, means the layers can’t break down problems into smaller tasks, and that may mean that output predictions are poor: just not enough collective expertise in the model.

This kind of intuition on how models are learning extends to even the most complex models, like Large Language Models (LLMs). You can imagine the last layer “I need to produce some text to respond to the input text I’ve been given” as that layer essentially asking all the previous layers (the experts) to work together to craft an appropriate answer. More on this point later, as the point is important to understanding how the intelligence of models will improve over time, surpassing human level intelligence.

Matrix Multiplication

The magic above of taking data and pushing it through many layers requires a massive amount of mathematical calculation. Computers are generally pretty good at calculating this kind of thing, but one piece of computer hardware is exceptionally good at it: graphics cards. The kind you would buy to run the latest and greatest games at the highest graphics settings. Getting from what a deep learning model looks like to running on a graphics card (GPU) is done through high school linear algebra and matrix math.

The following shows a simpler version of the neural network example above (without the activation functions), and shows how those calculations can be performed using matrix math:

It’s not important to understand how this calculation works in detail, just that it can be represented and calculated using matrix multiplication.

This idea of using matrices to represent and calculate is important, as it explains why Graphics Processing Units are so excellent at building and training these big models: GPUs have been crunching matrix math for years. All those 3D games you play represent their visual scenes as polygons, the underlying representation being matrices! Rotating, flipping, clipping matrices is well known matrix math that has been optimized really well in the GPU hardware already – it’s great for deep learning.

What GPU hardware looks like and what it costs is detailed further down in the paper. For now, just think “deep learning equals matrix math which runs great on GPUs”.

What Deep Learning Models Look Like as Code

Let’s take a quick look at what machine learning models look like as software code. There is one dominant library/framework for using, building and researching machine learning models: PyTorch, which runs on the Python programming language. The distant second is Google’s TensorFlow. Google’s JAX (not displayed in the image below) is gaining ground as a fast neural network training framework.

https://www.assemblyai.com/blog/pytorch-vs-tensorflow-in-2023/

The code below will show a PyTorch neural network model that will train and learn the XOR (eXclusive OR) truth table. The details of how the code is run isn’t important, as we’re just trying to visualize the structure/example of a neural network model:

A B A XOR B 0 0 0 0 1 1 1 0 1 1 1 0
import torch
import torch.nn as nn

class XOR(nn.Module):
    def __init__(self):
        super(XOR, self).__init__()
        self.input_layer = nn.Linear(2, 2)
        self.sigmoid = nn.Sigmoid()
        self.output_layer = nn.Linear(2, 1)

    def forward(self, input):
        x = self.input_layer(input)
        x = self.sigmoid(x)
        y = self.output_layer(x)
        return y

The code above is a PyTorch neural network model definition, with two input parameters, and one output.

xs = torch.Tensor(
    [[0., 0.],
     [0., 1.],
     [1., 0.],
     [1., 1.]]
)

y = torch.Tensor([0., 1., 1., 0.]).reshape(xs.shape[0], 1)

This code represents the training data that PyTorch will use to train the model above.

if __name__ == '__main__':

    epochs = 1000
    mseloss = nn.MSELoss()
    optimizer = torch.optim.Adam(xor.parameters(), lr=0.03)
    all_losses = []
    current_loss = 0
    plot_every = 50

    for epoch in range(epochs):
        # input training example and return the prediction
        yhat = xor.forward(xs)

        # calculate MSE loss
        loss = mseloss(yhat, y)

        # backpropogate through the loss gradiants
        loss.backward()

        # update model weights
        optimizer.step()

        # remove current gradients for next iteration
        optimizer.zero_grad()

        # append to loss
        current_loss += loss
        if epoch % plot_every == 0:
            all_losses.append(current_loss / plot_every)
            current_loss = 0

        # print progress
        if epoch % 500 == 0:
            print(f'Epoch: {epoch} completed')

The code above is the training loop.

# test input
input = torch.tensor([1., 1.])
print('XOR of [1, 1] is: {}'.format(xor(input).round()))

This code tests the model once it’s been trained. Running this code produces the following:

The result is XOR of [1, 1] is: 0

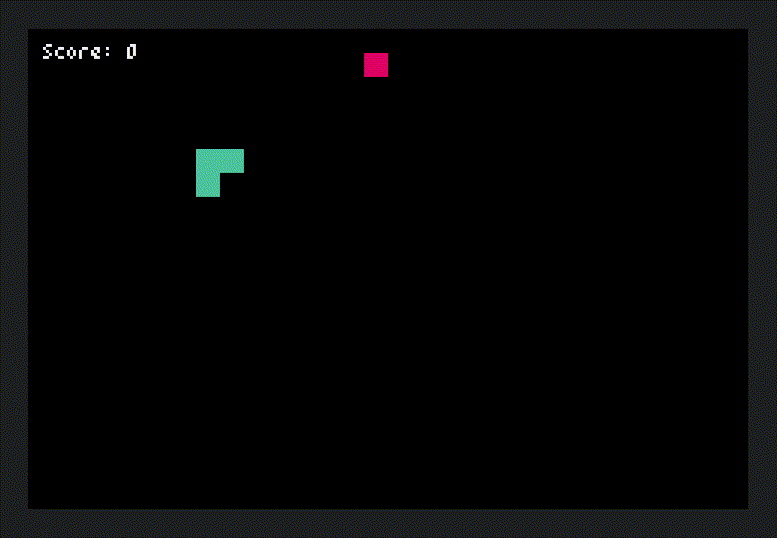
A more complex example that is both interesting, and reasonably trivial to train is having a neural network learn how to play the Nokia phone game “Snake”. This example uses a model architecture and training procedure called “reinforcement learning” – the training loop essentially plays millions of games of Snake, trying to learn the best strategies. The code for this can be found here.

Demo (after 10 minutes of training on a consumer grade GPU):

Size of Models and Time to Train

Training the XOR model is a trivial task, taking milliseconds. Training larger more complex model architectures can take months. Training time and training complexity is typically dependent on 1) how many parameters in the model need to be ’nudged’, 2) how much training data is required to have the model learn in a generalized repeatable way, 3) the model architecture used. There are more, but this is a high level rule of thumb. Some examples of training time, model size and compute required:

Model Training Time Size Compute XOR Milliseconds 4 parameters Laptop Snake Minutes 12 parameters Laptop MNIST Digit Classification Hours 100-300 thousand Laptop ImageNet image classifier 15-20 hours 25-150 million Desktop YouTube Ranking and Recommendation Weeks Billions Server Farm ChatGPT 4 LLM Months Trillions 10’s of thousands of GPUs 2025 LLM Models Months 10’s of Trilliions 100’s of thousands of GPUs Future LLM Models Months 100’s of Trillions Many datacenters

Nature has good graph that represents the exponential scale of AI model sizes:

https://www.nature.com/articles/d41586-023-00777-9|400

The compute required to train the largest and most complex models like ChatGPT is large and very expensive. The following pictures give a sense of scale:

Facebook’s Fort Worth Data Center (2 full data center buildings): Facebook’s Forth Worth Data Center

Inside the data center: https://www.datacenterdynamics.com/en/news/facebook-tests-new-network-in-iowa-data-center/

Rack based NVIDIA GPU Server, “Grand Teton” from Meta. Approximately 8x NVIDIA H100 GPU cards, ~15kw per rack typically: NVIDIA GPU Grand Teton Server

Single H100 NVIDIA GPU (Latest Generation 2023). ~800W power draw. Selling for ~$27k on eBay right now. NVIDIA H100 GPU

Exactly how many GPUs are required to train these latest super models like ChatGPT is an industry secret, but it’s understood that tens of thousands of GPUs were required for training over many months. Serving the finished model to the millions of customers that use it also requires 10’s of thousands of GPUs.

Google, Meta, Amazon and Microsoft have hundreds of thousands of GPUs available to machine learning researchers/practitioners to experiment on, build, and train models for production use. In 2025, it’s expected to have training clusters with 100’s of thousands of GPUs, and 2026+ will be millions.

Why so many GPUs?

Building and training a model that has trillions of parameters that need to be “nudged” requires that the underlying hardware have a) enough memory to hold the parameters that are being nudged while training, and b) enough computation power to perform the matrix multiplications and nudge the parameters to reduce error in a reasonable time on human scale (months, not years).

Trillions of parameters requires a lot of memory:

  • 1 trillion parameters = $1 \times 10^{12}$, assuming each parameter is a 32 bit floating point number, then each parameter is $4 : \text{bytes}$.
  • Memory required to hold all the parameters: $1 \times 10^{12} \times 2 \times 4 : \text{bytes} = 8 : \text{TB}$
  • You also need space to hold the results of the matrix calculations, book keeping and more, so roughly we end up with ~ $20 : \text{TB}$ of memory required.
  • This implies you need at least 256 H100 GPUs that have 80 GB of memory.

Why is it that models need tens of thousands of GPUs?

Big models require big compute:

We want to speed up the training and nudging of the parameters. More GPUs means faster nudging. GPUs and other AI hardware usually measure how fast they are by stating how many floating-point operations per second they can achieve (or how many of those matrix calculations they can perform per second to do the nudging). There are many different “precisions” of floating point numbers - in general, the more precise, the slower the operation - which means there are many reported “FLOPS” (floating point operations per second) numbers depending on the precision you want. We’ll focus on the common one for LLM training: BFLOAT16 (sometimes called “brain float”) which is 16 bits (or 2 bytes) of precision.

The current H100 GPU from NVIDIA can do 2000 terraFLOPS (or 2 petaFLOPS) of BFLOAT16 calculations. The previous generation NVIDIA A100 could do 624 terraFLOPS. H100 is a clear step up in terms of computation. Tens of thousands of GPUs means a huge amount of BFLOAT16 compute: 2 petaFLOPS times 10,000 is:

$$ \begin{align*} 2 : \text{petaFLOPS} &= 2 \times 10^{15} : \text{FLOPS} \newline 10{,}000 \times 2 : \text{petaFLOPS} &= 10{,}000 \times 2 \times 10^{15} : \text{FLOPS} \newline &= 20{,}000 \times 10^{15} : \text{FLOPS} \newline &= 2 \times 10^{4} \times 10^{15} : \text{FLOPS} \newline &= 2 \times 10^{19} : \text{FLOPS} \end{align*} $$ This means 10k H100 GPUs are roughly capable of $2 \times 10^{19}$ floating point operations per second. (In practice, they can’t actually achieve that much because of a lot of overheads we won’t get in to here).

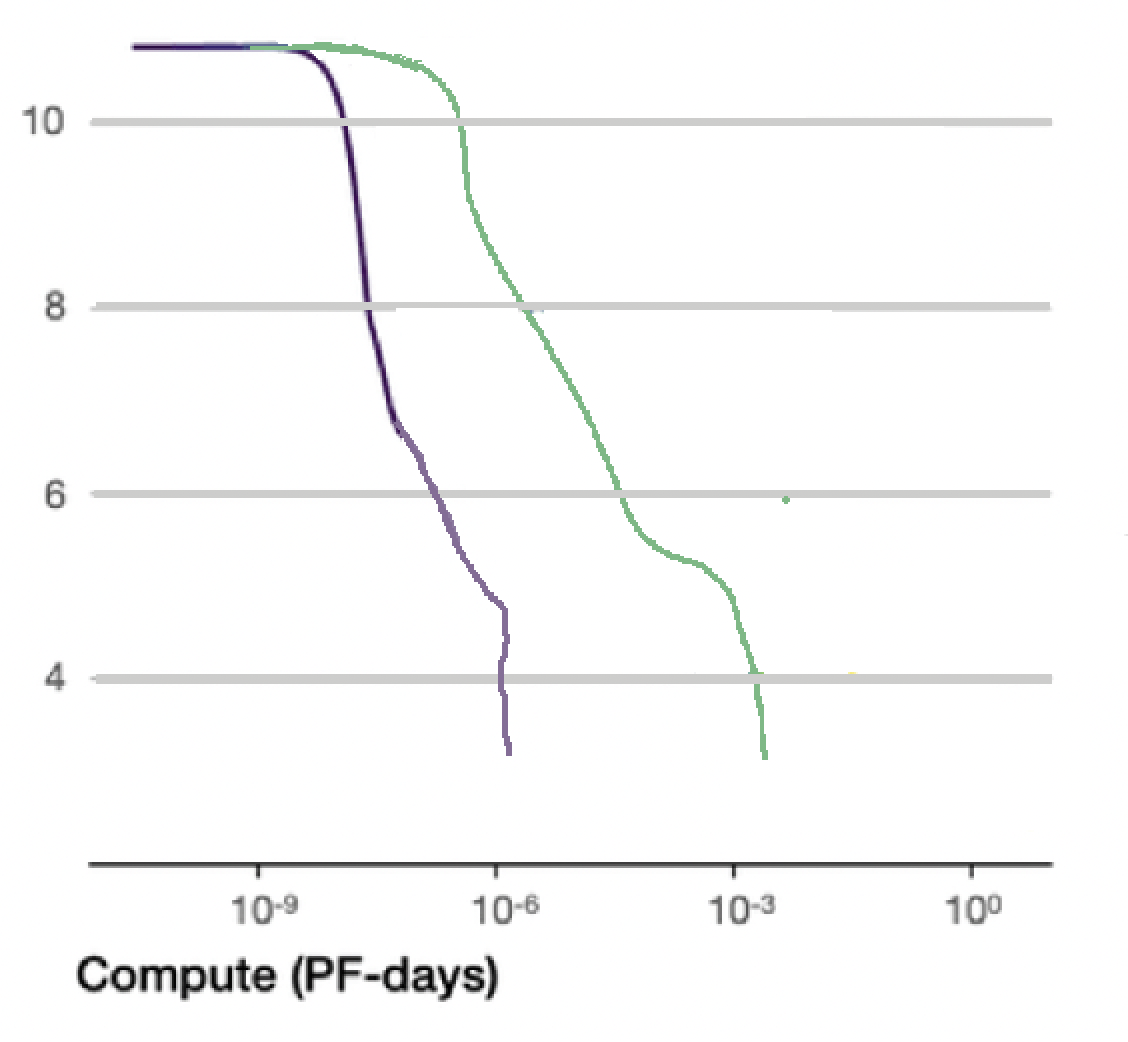
The following graph from epochai.org shows how many floating point operations (or parameter nudges) were required to train various released models to have the smallest amount of error:

https://epochai.org/blog/tracking-large-scale-ai-models

If ChatGPT 4 required roughly $5 \times 10^{25}$ floating point calculations, we can roughly determine how long the training time would be by dividing the amount of FLOPS needed to nudge the parameters, by the amount of GPU FLOPS hardware compute we have available ($2 \times 10^{19} : \text{FLOPS}$). The more GPUs we have, the less time it takes to train:

$$ \begin{align*} Time = \text{Total compute needed} \div \text{Compute capacity per second} \newline Time = (5 \times 10^{25}\ \text{FLOPS}) \div (2 \times 10^{19}\ \text{FLOPS} / sec) \newline Time = 2.5 \times 10^{6}\ \text{seconds} \newline Time = 29\ \text{days} \end{align*} $$ GPUs almost never reach peak FLOPS performance while training: communication overhead between host and GPU, or intra-server comms overhead, or other bottlenecks, typically means you get ~20-30% efficiency. This means a GPT 4 sized model will take approximately 100-150 days or so to train on a cluster of ~10,000 H100s.

More GPUs Means More Degrees of Freedom

In general, more FLOPS and more memory means more degrees of freedom in model size, model architecture, and how long the model will take to train. It also means:

  1. Researchers can explore bigger and more complex model architectures to achieve learning of more complex tasks.
  2. Higher velocity of output of research and model experimentation: faster training equals more experiments
  3. Global scale deployment of complex machine learning models for your customers/users.

And most importantly, more GPUs means more intelligence, as we’ll now explore:

Scale and Intelligence of Large Language Models

The largest models on the graph above are all LLMs and its worth taking a special sidebar to understand why. A deeper “what are LLMs” tour is further down the document. First, a few things worth noting before talking about scale and intelligence:

  • While ChatGPT, Claude.ai and so on are called LLMs, you can now say they’re just “large models” as they go beyond reading and writing natural language to ingesting and generating images, speech, and soon video.
  • LLMs aren’t just Q&A “chatbots”. While ChatGPT popularized this form of LLM interaction, there are vast ways of using these models. One popular form is calling the model via software through an API, where software can instruct the model to generate code, perform computation, interpret and rewrite text and images and so on. Through this lens, the LLMs act as sort of a “computer” - instead of programming the computer via code, you’re programming the computer via natural language instruction.
  • Most of the frontier power of these models currently comes through “programming” them through very sophisticated techniques; techniques often not available to users through the web or mobile application.

GPT 4 had roughly $5 \times 10^{25}\ \text{FLOPS}$ of training compute pushed into a model size of 1.8 trillion parameters, using a rumored ~25k A100 GPUs. The cost at the time of these GPUs was roughly ~$25 thousand USD per GPU to purchase, ~$625 million USD in capex. GPT 4 used ~300 times more compute to train, does that mean its 300 times smarter? No, but “it’s complicated”.

Scaling Laws

The rush for FAANGS and others to purchase billions of dollars in compute for training LLMs can be traced and rooted to the seminal paper Scaling Laws for Neural Language Models which was written by OpenAI researchers (five authors on that paper have left OpenAI and started Anthropic, another LLM frontier model company).

The papers core contribution is the finding that as the number of parameters in an LLM increases, its performance tends to improve following a power law relationship (y-axis is “error” of the model) (not to scale of the actual scaling laws):

The paper also describes the relationship between compute, amount of data, model architecture, model size and the “error” of the model. This means for a given input, let’s say “data size”, you can calculate the most optimal model size, compute and training time for that input. Or given FLOPs you have available, you can calculate how much data you need, the model size, training time and so on. Unfortunately, it doesn’t provide a precise calculation of the intelligence of the model, as this tends to be non-proportional to compute and difficult to predict.

In practice, model capabilities tend to improve in unpredictable “step changes”, or simply “emerge” at a given compute factor. It’s thought that these step changes come out of improvements in foundational intelligence: reasoning ability, understanding context better, broader knowledge and so on - higher order skills start to “click”, much as they do in humans when they age. Some skills may also plateau for some time before taking off again, which makes predictions of model size to skill difficult. Scaling laws provide “potential for improvement” not a guarantee.

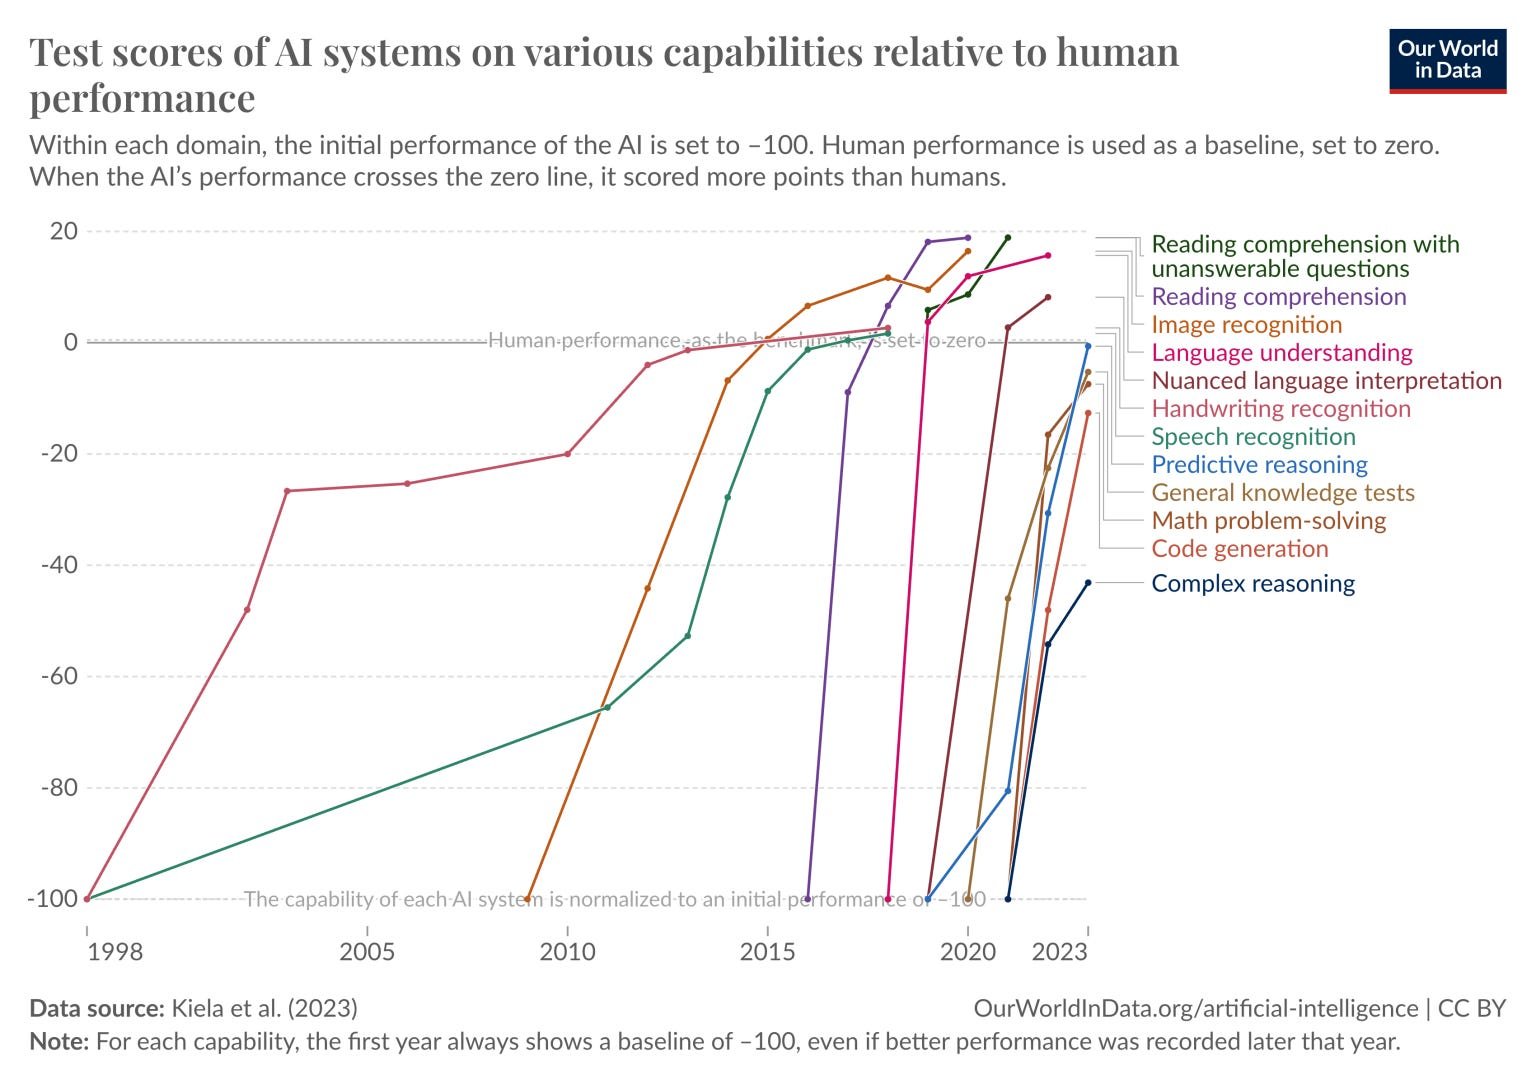
ℹ️ The US Government has put federal level measures in place regarding the reporting of AI training and compute resources. Companies using more than $10^{26} : \text{FLOPs}$ to train a model are required to report that to the Department of Commerce (this is just about a GPT 4 level model). Governments are worried both about the safety implications of these models (super-intelligence) and the international competitive landscape, as foreign adversaries start to buy FLOPs to train models for defense and signals intelligence.

The paper shows several graphs illustrating the effect of compute and size, with respect to loss (error) over different domains:

These graphs illustrate the remarkable consistency of scaling laws across different domains. Whether we’re looking at image generation, text-to-image models, video processing, mathematical reasoning, image-to-text conversion, or language modeling, we observe similar power law relationships between compute and model performance. The colored lines represent different model sizes, with each modality following its own specific scaling exponent. This consistency across diverse tasks suggests that scaling laws represent a fundamental property of neural network learning rather than being specific to any particular domain.

Given the focus on scaling in the past few years by researchers, and the huge capex investments made, we’re seeing clear improvements in model intelligence (0 on the y-axis is benchmark human performance on the given task): Given the predictability of scaling laws so far, and little evidence that these laws will “s-curve” out, AGI (Artificial General Intelligence) or “superintelligence” is seen as both achievable, and predictable - just add more FLOPS and data.

Large US tech companies are rushing to capture and deploy the supply chain of deep learning training compute to try and train AGI first:

Company 2024 YE (H100 equivalent) 2025 (GB200) 2025YE (H100 equivalent) MSFT 750k-900k 800k-1m 2.5m-3.1m GOOG 1m-1.5m 400k 3.5m-4.2m META 550k-650k 650k-800k 1.9m-2.5m AMZN 250k-400k 360k 1.3m-1.6m XAI ~100k 200k-400k 550k-1m

Estimates of GPU or Equivalent Resources of Large AI Players - lesswrong.com

The US and China dominate the TOP 500 list of supercomputers:

Given the cost of these FLOPs, and more FLOPs meaning larger and more intelligence models, there’s a race to bring the $\frac{\text{cost}}{\text{FLOPs}}$ cost per flop down by creating cheaper and more efficient hardware.

It’s worth taking a sidebar to explore this race to reduce cost and speed up deployment, as it has various strategic consequences for the industry, and for government sovereignty:

Training and Serving Costs and Constraints

Optimization and cost savings for training and deploying machine learning models (in particular, LLM models) has become critical. In general, FAANG’s, large enterprise, and cloud providers are optimizing for the following things:

  1. Performance per Dollar: floating point operations per second given capital and operational expenditure costs of hardware.
  2. Performance per Watt: floating point operations per energy usage. Power is now a dominant planning constraint for datacenter build outs.
  3. Machine Learning Researcher experiments per unit of time: more experiments mean more insights and model improvements.
  4. Data collection and preparation.

Optimizing (1) and (2) above can be achieved in numerous ways:

  1. Hardware vendor choice
  2. Hardware vendor software stack
  3. Limiting/refining/curating training data (thus reducing how long training takes)
  4. Trading off model accuracy for reduced training time
  5. Model architecture improvements (decreasing parameter count, alternative choices in model architecture, etc)
  6. Compressing models (a technique called quantization, which trades off model accuracy by shrinking parameter size)
  7. Reducing “freshness” of the model (reducing how often you re-train the model)
  8. Using “off the shelf” models instead of training your own.

Creating a strategy for reducing costs and unblocking constraints is more art than science right now, as (1) through (8) are often difficult to measure, and difficult to connect to product/customer impact.

Costs to train and deploy will differ depending on:

  1. The complexity of the model being trained/deployed
  2. How many end-users are using the model in production
  3. How often the model needs re-training
  4. From scratch training, or fine-tuning/extension from existing model (see below).

The “Size of models and time to train” section above gives a general sense of training compute requirements. Deployment (or “inference”) requirements can vary and depends almost entirely on the size of the customer base that will use the model at any given point in time.

LLM Costs and Constraints

Scaling laws indicate that the path to increasingly capable AI systems, potentially including AGI, is largely a matter of training and serving for size. This requires overcoming four key constraints: the silicon supply chain, power infrastructure, networking capabilities, and the velocity of datacenter construction.

This paper reverse engineers the requirements for training a 100 trillion parameter “AGI like” LLM model, which helps us understand the magnitude of these constraints:

  • Silicon Supply Chain and Silicon Cost: Approximately 1.6 million GPUs with ~313 petabytes of HBM memory will be needed. This represents an unprecedented demand on semiconductor manufacturing, requiring significant expansion of current production capabilities. At current market prices (~30k USD per GPU), the hardware alone would cost ~48 billion USD, excluding networking and infrastructure costs. Recent announcements like Microsoft and OpenAI’s $100 billion data-center project reflect the scale of investment required.

  • Power Infrastructure: ~3 gigawatts of power for GPUs alone, scaling to ~4-5 gigawatts total to house in datacenters. This far exceeds current datacenter norms, where most facilities built in the past ~5 years use 50-300 megawatts. Even Australia’s largest proposed datacenter, NextDC’s S4 Sydney, caps at 300 megawatts. This SemiAnalysis graph shows the projected global datacenter power usage under different AI acceleration scenarios, illustrating the magnitude of power required, measured in multiple percentage points of all US energy capacity:

https://www.semianalysis.com/p/ai-datacenter-energy-dilemma-race

  • Networking: Training at this scale requires multiple datacenters connected by extremely high bandwidth networks. Training is high demand, highly data distributed, meaning low-latency, and extremely high bandwidth intra-datacenter connectivity is required to ensure intra-datacenter communication does not become a training bottleneck. 400Gb/sec - 800Gb/sec intra-datacenter links are relatively common in the US and China. Multi-terrabit fiber is being rolled out also. Hard to see the trend here, however, unsurprisingly the US is ahead on rollout:

  • Datacenter Construction Velocity: The pace of datacenter construction must accelerate to accommodate current training demand. Current construction timelines are a bottleneck for AGI players. Meta’s Q2 2024 earnings already signal this trend with significant increases in capex spend to speed-run datacenter construction.

Currently, the US and China are dominating the race to invest in infrastructure to unblock these constraints. The UK Government has recently announced its AI Opportunities Action Plan to try and catch up, along with roughly 14 billion pound worth of data center projects and a new supercomputer.

Given silicon supply and power consumption are the two dominant factors in training and serving LLMs, there are several efforts to build new machine learning accelerator chips with a focus on reducing power consumption, and decreasing cost/FLOP. These potentially have the ability to unseat NVIDIA as the dominant hardware provider (along with beating down NVDIA’s 70% margin on chips).

Machine Learning “Accelerator” Hardware

You may have heard about specialized hardware that hyperscalers like Google and Amazon have built, an example being Google’s “TPU”, and Amazon’s Trainium. This hardware looks and acts very similarly to GPUs, but may have a different configuration (compute, available RAM, connectivity to other TPUs etc) that may be more specialized to a particular type of model.

Here’s a picture of an older generation TPU (the plastic piping is used for water cooling), and another picture of many TPUs connected together in a data center rack:

Specialization is always in the interest of optimizing cost, power and performance for a particular set of workloads. GPUs in themselves are a form of specialization originally for computer gaming: GPUs are great and drawing and manipulating triangles, significantly better at it than the original Intel x86 processors. As mentioned in this doc, that game engine specialization tends to be helpful for AI training also. GPUs however, also have a bunch of silicon dedicated to game engine tasks that are not at all related to neural network parameter nudging.

AI Accelerators like TPUs and Trainium have more silicon dedicated to the act of AI training and inference, and spend more silicon on accelerating the critical path of training and inference. For instance, on-chip silicon is dedicated to extremely fast intra-chip communication, so that the neural network can be distributed across many chips to cooperatively work on nudging parameters of the entire model in parallel.

Extracting the full performance out of these accelerators is done via a software layer, sometimes called the “deep learning compiler” or “neural network compiler”. This software takes the architecture of the model that is described by humans (amount of parameters, layers and so on), and generates code that the chip can understand and execute in order to perform the training and inference operations. This sounds simple, but it’s actually incredibly complex to get right: you need the software to figure out the exact right code and layout that will be “mechanically sympathetic” to the hardware, so that you push the hardware hard in the places it excels, and avoid asking too much of the less efficient parts. It’s possible to have 2x faster and more efficient hardware, but the software compiler generate unsympathetic code that ends up running 2x slower.

Compute Efficiencies (or CE’s)

Specialization of machine learning hardware is considered to be a “compute efficiency”, which is a term given to an improvement in any part of the stack which gives you the same amount of loss, for less compute. A “2x” CE (compute efficiency) largely means it requires 2x less FLOPs to get the same error loss.

This is what a loss curve would look like, comparing one model training run with a 2x CE, vs. not:

AGV_vUd9B7L9e-aBeWVSQFvwaTAApvKfRZtEJTjVT8HLsW1u2lYC2IqLlOy0D7LnhJi7FEjGIsC2yZvbseSLbKRcd9_QcL67uh1S7zoCu1Mqa5Q_xtt-Cg9JrpeNWHcSx_Np0iV6SkoP=s2048?key=gQmI_o-ISc2RdRxykXz2ZP9q|397

Compute Efficiencies come from all places in the AI stack: data (mixture, ratios etc), hardware (choice of hardware), architecture of the model and how sympathetic is is to the hardware, writing custom kernels (CUDA kernels for instance) to make training/inference faster, quantization, model distillation and more. The size of a given model is correlated to intelligence, but a smaller model with more compute efficiencies can be higher performing than a larger model without.

For frontier LLM companies in particular, these can be worth 100’s of millions of dollars, and are considered company secrets. You can spend your CE by making a smart model cheaper, or making a model much smarter.

A Deeper Look Inside an LLM Model

Large Language Models (LLMs) deserve its own “what is” section, as there are multiple properties of LLMs that are unique and which will likely drive more non-linear value generation than any other model. The most commonly used LLMs right now are OpenAI’s ChatGPT, Anthropic’s Claude Google’s Gemini, and the Open Weight model Llama from Facebook.

ChatGPT

The most common way LLMs are used today are:

  • User/Assistant conversational chat-bot where users ask questions and ChatGPT generates answers.
  • Education: Information retrieval and synthesis, conversational style “explain to me how this works; I don’t understand this…”.
  • Generative/Creative: “generate me a limerick that talks about my Australian friend who likes Pinball”, or “generate me Python code that calculates compound interest”.

However, ChatGPT (and other large language models) have non-obvious abilities which make them powerful reasoning, prediction and probabilistic cognition engines that happen to be both introspective and programmable. And that programming (through prompt engineering) takes place at an abstraction level that is available and accessible to everyone. These non-obvious abilities puts them directly in competition with flesh-and-blood cognition engines, and their eventual wide distribution and ease of specialization through natural language programmability means they will eventually get inside every workflow, every prediction and every decision.

Reasoning and Decision Making through LLM Programming

Let’s take a look at an example of these non-obvious abilities, starting with reasoning and decision making. Imagine I would like help with sourcing engineering candidates for my imaginary “silicon engineering” job. This job requires specialization in building emulation environments for an ASIC (custom silicon). I’d like to source candidates that closely match my job requirements, and I’d like to also find candidates that overlap substantially but could be trained in the particular ASIC specialization.

Prompt, or the “programming”: ChatGPT Technical Sourcer

The job description: The job description

The candidates resume and result: Evaluation of Joe Bloggs Resume

ChatGPT 4o ends up summarizing:

Fitness Score: 2. While Joe Bloggs has a strong background in ASIC and FPGA design and GPU architecture, his experience does not align closely with the requirements for a Machine Learning Compiler Engineer. The lack of relevant experience in compiler development, ML frameworks, and high-performance computing programming models results in a low fitness score for this specific position.

ChatGPT 4o was able to compare and contrast resume to job description, and understood that some of the candidates missing job requirements were more or less relevant than others. It performed this reasoning with a level of sophistication approaching a reasonable technical sourcer (and far exceeds sourcer/recruiter tooling that tend to perform basic string matching between resume and job description).

Let’s try a more sophisticated example, where we’re asking ChatGPT to behave like it is a “virtual computer”, one which executes a set of instructions. This kind of programming requires that the model have an exceptional reasoning and instruction following engine to ensure that it correctly interprets the initial “programming prompt” and the subsequent programs.

Make GPT4o simulate a computer

Let’s give it a program: A simple program

It defaults to -2 and then -5 as the order of the “sub” operation, giving us -2 - -5 = 3. Reasonable, given -2 was on the top of the stack. But this ordering convention is arbitrary, and perhaps I wanted the reverse convention instead? Different ordering of the “sub” instruction

GPT4o reflects on the conversation, figures out the error (ordering must be the error) and reruns the program with the corrected result.

Above is an example of introspection, abstract reasoning, decision making and creating a “mental simulation” of a user described world - one which young humans might struggle with. A valid question to ask is “is this just a recreation of the training data?”, after all, stack based virtual machines are a common thing in computer science. Fields of study have spun up around this question, most prominently “interpretability”, and while still early, evidence seems to suggest that LLMs are going far beyond “parroting” training data, combining skills in ways that it had not seen during training. Other papers (1), (2), (3) have similar conclusions.

How do LLMs Work?

Stephen Wolfram does an exceptional job of explaining the “under the hood” details of how LLMs are trained, and how these LLMs end up producing magical and almost human like output. It’s impossible to succinctly summarize this explanation, so instead I’ll give a very high level set of abstractions and analogies:

  • LLMs take text as input, and as output, try and predict what the best text might be to “complete the rest of the text”. Thinking about this in terms of the chatbot model, the input text is the question, the answer is the output text.
  • It learns how to do this by looking at trillions examples of sentences, paragraphs, natural language and images from the Internet.
  • It figures out interesting and non-obvious statistical associations between words and a collection of words in sentences, and builds probabilistic models from them. These associations are used to generate the output text.
  • If you remember back to the example of “specialization” that occurs in hidden layers when training a neural network to detect faces (see image below), the same thing is happening in these LLM models. You can abstractly think about it as the output layer asking all the layers before it “hey, I need to generate text to answer the users question, I need all you experts to help put together an answer for me”. These massive models are forced to learn millions of specializations and expertise in “generating limericks”, or “produce facts about the civil war”, and so on.

  • These experts aren’t just limited to understanding and generating natural language – LLMs can read and produce computer code, math, spreadsheets, images, video and more.
The LLM Roadmap

Quite a few of the trends were identified in previous sections, so let’s recap them before exploring the potential LLM roadmap in more detail:

  • Current generation models (GPT 4, Gemini, Claude 3) cost roughly 100’s of millions in capex and opex to train and deploy, with $5 \times 10^{25} : \text{FLOPs}$ worth of compute in them.
  • Estimated 20-40 thousand GPUs required for training GPT4 and therefore ~$500+ million USD in hardware expenditure. Gemini likely used TPU accelerators for training which would have a different cost/FLOP calculus.
  • Estimated 13 trillion tokens of data was used for GPT4.
  • All frontier LLM models are multi-modal with at least image and text as input, some with speech, and image, text, speech outputs.
  • LLMs during training end up with “millions of specializations” embedded in their parameters. More parameters and compute usually means more and better specializations.
  • GPT, Claude and Gemini largest frontier models with roughly trillions of parameters. Meta has their “open weight” model Llama, a dense model with 405b parameters.
  • Model access via chat interface, or via API access.
  • Emphasis on scaling intelligence through Post-Training: reinforcement learning and “test time compute” (more on this later).

A good and recent interview with Dario and Daniela Amodei from Anthropic foreshadows what to expect in terms of size and cost for models: ~$100 billion USD. Implied in this view is that LLM Scaling Laws continue to avoid s-curve diminishing returns, and continue to produce value and return that exceeds the cost. The “LLM Training Costs and Constraints” section briefly reviewed a paper describing the requirements for a 100 trillion parameter model, costing roughly $50 billion. To recap:

  • 15 petabytes of data tokens
  • ~1.6 million GPUs with ~313 petabytes of HBM memory
  • ~3 gigawatts of power for GPUs alone, ~4-5 gigawatts for the datacenter

To understand what will these $100 billion dollar models will look like, let’s take a quick look at the way they’re used today and the current limitations. Today, when using an LLM, you’ll find the following:

  • A chatbot style request response paradigm: A user has a question or problem, and works through that with the LLM like a human converses with another: provide some context, ask the question, get an answer, clarify and explore the answer: Request Response Chat architecture

  • A limited context window or “memory” for the LLM: most LLMs have limited memory you can work with, roughly between 100,000 and 200,000 tokens (although Gemini has a million token context window). This is the upper limit on the amount of information you can tell the LLM before it stops you from sending more - 50k tokens is roughly the size of the book “A Brave New World” by Adlous Huxley. You can essentially “teach” the LLM four books before asking the question you want to ask.

  • While LLMs have been trained on all the tokens on the Internet, the act of training means that the data on the Internet is kind of “filtered and compressed”. Things that are really important will be learnt by the training process with nuance, and things that aren’t important will be compressed and summarized into the parameters of the model. Asking an LLM about the Prime Ministers of Australia, the LLM will have a nuanced understanding and be able to respond in kind. A random persons blog on the Internet, the LLM may have either filtered or compressed that information into a very high level summary.

  • Data the LLM hasn’t seen (e.g. data in your enterprise about your customers or something) needs to be fed to the LLM for it to be reasoned about: there’s simply no way it would have been trained on that data as its behind your firewall.

  • LLM models don’t currently integrate new data and knowledge into their parameters (i.e. they’re not continuously training). They don’t benefit from influencing and being involved in reinforcing feedback loops.

The above means that in order for an LLM to reason about things within your firewall, you need to collect up and send the LLM that data first, before having the LLM do things for you. With only four books of context memory, this means that you can’t give the LLM your entire enterprises data for each request - you need to be selective, and package the data most relevant to the query. There are systems that automate this task (Vector Databases, Retrieval Augmented Generation or RAG, and so on) but efficacy varies.

Next generation models will lift these constraints:

  • Request/response chatbot paradigm will evolve to be reactive, agentic and independent (more on this below).
  • Models will have unlimited or near unlimited context windows, or the ability to “upload your data” for the LLM to have pre-computed understanding of that data.
  • Models will be “continuously” training and participating in feedback loops by virtue of having unlimited context windows.
Reactive Agentic LLMs

LLMs will go beyond current User -> LLM request and response chatbot style interaction paradigms to be independent “always running” agents that can do the following:

  • Work on long running tasks: first minutes, then hours, days and weeks long.
  • Work cooperatively with other agents that are also running independently - enabling the breakdown of large tasks in to smaller tasks which are then distributed to workers to work on in parallel.
  • React to environmental changes instantaneously: e.g. an agent that is constantly reading and reacting to news to place trades on a stock market.
  • Perform experimentation and simulation to discover new and novel things.

Tasks right now, particularly in the chatbot “request response” paradigm, are minutes long. Future releases will be able to perform long running computation:

Both task sophistication and duration will go up, and amount of cooperative compute (i.e. many agents working on sub-problems) also goes up. This is strongly correlated to model intelligence, mostly due to a) how well the LLM is connected to the outside world, and b) how effective it is at breaking down problems and correctly and successfully completing those problems. And (b) is particularly important: usually most steps of problem solving need to be correct as they are inputs in to the next step of the larger problem.

LLMs can do this in the small form today by generating code to helper tools that can be executed on a computer. Let’s look at an example task:

go to https://ten13.vc/team and get the names of the people that work there

Anthropic’s Claude working with local helper tools to solve a task

The white colored text is the query, the grey colored text is the LLM responding to the query. It has generated the following code:

var1 = download("https://ten13.vc/team")
var2 = llm_call([var1], "Extract a list of names of people who work at Ten13")
answer(var2)

The two helper tools that the LLM is using are download and llm_call. The download helper uses a web browser to connect to the web page on behalf of the LLM and downloads the page. The llm_call helper tool packages up the webpage and sends it back to the LLM for processing.

This interleaving of LLM describing the breakdown of problems via natural language, and then generating code to solve them works quite well right now given how well the current generation of models generate computer code. However, task complexity and duration can be a problem because of a few constraints:

  • The code generated can be incorrect
  • The semantics of the code are incorrect: i.e. it’s misunderstood the task but generates correct code
  • The data that the code is working with is too large to fit in to the context window of any subsequent LLM calls: i.e. the webpage that is downloaded is larger than the LLM token limit.

The analogous situation is a junior programmer compared to a senior programmer - complex tasks are more difficult for a junior programmer to get right. The more tasks there are to solve, the more likely the whole task is going to be incorrect.

With model intelligence going up with each model generation, and larger (and perhaps unlimited) context windows coming, these constraints loosen, leading to more complex and longer running tasks having a higher probability of success.

Unlimited Context

Context windows (or token size constraints) are a constraint driven by underlying hardware constraints and LLM architecture choices. Performance of the model (i.e. how many tokens per second the LLM can process) are also a factor. Current model generations have the following context window sizes and performance:

Model Context Window (tokens) Input Performance (tok/sec) Output Performance (tok/sec) GPT4o 128,000 16,400 82 Gemini 1.5 Pro 2,000,000 9,800 53 Claude 3.5 Sonnet 200,000 9,000 58 Claude 3.0 Opus 200,000 3,000 23 Llama 3.1 128,000 4,000 37

A longer, more detailed comparative analysis is here at HuggingFace

“You miss 100% of the shots you don’t take” is roughly ~11 tokens. 1 paragraph is roughly ~100 tokens. The book “A Brave New World” is 63k words, and roughly 48,000 tokens. The book “War and Peace” is 580k words, and roughly 440k tokens.

Future models will have multiple million token context windows (perhaps unlimited), far higher token processing performance, and the ability to “pre-compute” (or pre-read) those tokens so that they’re instantly available for the LLM to reason about.

If you consider the typical large company/enterprise (5000 employees, 10 years running), it’s likely got hundreds of millions of documents, emails, records, contracts, presentations and so on that have been created over the lifetime of the company. As a rough guess, this might translate into 13 billion words, about 260,000 novels, and that means roughly 17 billion tokens of context about the company and its operations.

If current generation LLMs had unlimited context windows, then processing time becomes a dominant factor: 20 days roughly to process those 17 billion tokens at a speed of 10,000/tokens per second. If those tokens are “pre-processed” and stored, any query from any employee can have full comprehension and reasoning about the company at their fingertips, via the LLM, accessed instantly. This scenario is really just a function of engineering work by LLM providers (and maybe some small amount of research).

Continuous Improvement

Assuming the following:

  • Agentic and reactive LLM behavior, connected real time to environmental changes (documents being updated, news being produced or whatever)
  • Unlimited context windows (for data that hasn’t been trained into the parameters of the model)

The reasoning power of LLMs becomes continuous and exponential. For example, from the perspective of a company: continuous in the form that any data updates (new documents created, new customer data arriving etc), gets processed and stored by the LLM, and exponential through every new frontier LLM model upgrade. This produces non-linear advantages to anyone who exploits this continuous improvement feedback loop.

We’ve explored the basics of machine learning models, explored a “large form” of these models through LLMs, how they are built, size, costs, hardware and intelligence, and the future roadmap, now let’s zoom out to a higher level of abstraction and think about how this all relates to the day-to-day.

Machine Learning: Non-linear Advantage

From here, we’ll raise the level of abstraction up a few levels for the rest of this paper and talk mostly about four building blocks, “Data”, “Model Architecture”, “Task”, and the “training loop”:

  • Data: the inputs used to train the model to perform the task. These can be any sort of media these days: images, video, sensors, environment, database data, etc.
  • Model Architecture: the size and shape of the model. We’ve looked briefly at Deep Neural Networks and it’s underlying equation and how it learns, but there are various shapes and sizes of both the equations one uses, and how the learning gets performed. Architectures vastly impact the performance of the task, and how cheap/expensive it is to train.
  • Task: a valuable thing you want the model to perform, typically a prediction.
  • Training Loop: the act of a machine taking data, making a prediction using the current model architecture, figuring out the error, then nudging the model architecture parameters such that error gets smaller over time leading to better task output.

At it’s core, you can think of AI and machine learning as this:

ℹ️ Given enough and appropriate data, we can have a computer learn a model that will accurately and precisely perform a task.

$$ \text{task} = \text{model-architecture}(\text{data}_1, \text{data}_2, \text{data}_3, \ldots, \text{data}_n) $$

These tasks can be anything from predicting if an image is a cat or a dog, through to playing StarCraft II against the best opponents in the world.

We’re going to explore these high level concepts and how to think about them with respect to business, enterprises and investments. I argue that a rich mental model of these concepts should translate to better decision making as AI becomes more accessible. Questions we will start with:

  • What kind of data and how much of it, do I need to get an advantage through machine learning?
  • How should I think about the capability of machine learning models today, and over time? Or, how is the architecture of these models changing, and what are the consequences?
  • What kinds of tasks can machine learning do today, and how will these evolve?
  • How do I integrate all this into my business, or my investments?
Software, ML and its Non-linear Benefit

Let’s first reason about how ML works through software engineering analogies, which should be familiar to most enterprises given there’s typically some amount of software automation or investment. We will start with AI’s similes and differences in the software product deployment loop.

Here is a very simplistic view of how software is built today:

  1. Software team analyzes customer requirements and problems. Types code into an editor, compiles it, tests it, and ships it to production.
  2. Customers/Users use software in production, generating data for their domain, and telemetry for the software team to analyze.

There are two feedback loops here: one between the software team and the customer, and another between the software team and telemetry gathered from production. Improvement in the product or system requires a human in the loop to engineer extra things, and subsequently requires a deployment to production.

Some observations of these feedback loops:

  1. This software development life-cycle has been fairly linear for decades, with some velocity improvements coming from programming language, tooling, and process improvements.
  2. Silicon Valley’s “Move fast and break things”, increased this feedback loop up by moving to continuous deployment and production based A/B testing.
  3. That (b) was enabled through the age of ultra connectivity (mobile etc) and wide and immediate distribution.

Adding ML to the software engineering domain affects this loop:

ea66fb108486f2b8536b2c94452fd71a.png

  1. ML Engineers/Researchers identify features/problems in the product which a) can be learned by a machine to solve in a higher value way than humans or code, and b) can be improved over time automatically by capturing user or machine generated data and injecting that into the model’s “training loop”.
  2. The trained model is deployed into production and can be called like a library or API from the software/product. These models are either refreshed often, or continuously trained near real-time.

There is an important difference between software engineering without ML (first figure), and software engineering with ML: the first depends on a human in the feedback loop to produce more value for customers over time, and the second has a machine in the feedback loop. A machine in the feedback loop enables a) product and engineering scale beyond the total capacity of the team of humans, and b) will usually end up being non-linear.

It’s worth spending a few moments on why non-linear value generation will be powerfully disruptive, and why machine learning tends to have an exponential looking value creation curve.

Linear vs. Exponential

A quick reminder that Linear models represent a fixed increase in ‘y’ for every ‘x’, or said another way, we “add” an increase of growth ‘x’. In an exponential relationship between ‘x’ and ‘y’, for every step of ‘x’, the growth rate accelerates rather than staying fixed: Linear vs. Exponential

(Would you rather have a business that ‘adds’ a fixed step of growth output per year, or has an increasing step of growth output per year?)

Imagine you have a simple spam filter that works on a set of rules written by developers. For instance, if an email contains the word “lottery” or “prize”, it marks it as spam. So, each time you want to add a new rule, a developer has to write it. If you have 10 rules, you might catch X% of the spam. Add 10 more rules, and you might catch another X%. This is a linear relationship between effort and outcome. The function might look something like:

Spam caught (%) = 0.005 * number of rules + initial_model_baseline

On the other hand, let’s say you train a machine learning model on a dataset of spam and non-spam emails. Initially, with a small amount of data, the model might not perform well. But as you add more data, the model’s performance. This relationship can be modeled with a logarithmic function, which is a typical example of a non-linear function:

Spam Caught (%) = 100 * log(Data Size)

100 * log(data size)

So with a small data size, the model doesn’t catch much spam, but as the data size increases, the performance improves significantly (though it begins to plateau eventually).

In this case, data availability drives non-linearity. However there are several other contexts under which machine learning will tend to generate non-linear effects:

  • Model complexity: more complex models may improve performance of tasks, or enable step changes in coping with task complexity.
  • Computational power: similar to data availability, the benefits of additional computational power and longer training times can have a non-linear impact on task outcome.
  • Model cooperation/chaining (model stacking, ensemble learning etc): combining or chaining models together to complete tasks more precisely or to allow for increased task complexity.
  • Model introspection and self-instruction: (see later in the Large Language Model section).

Capturing this value generation requires more sophisticated engineering teams right now, but I imagine as tools improve and abstractions are built, this cost and complexity will come down.

Using/Extending/Fine Tuning Existing Models

Once models are trained, they can be shared with others, allowing users to avoid the upfront cost of training. This can be done by either sharing the model binary (typically megabytes to hundreds of gigabytes), or by calling a cloud hosted model through an API. Cloud hosted models are popular distribution mechanism for large language models in particular, given their size (hundreds of gigabytes), their cost (, and how often they’re being updated.

Model binaries can be extended and fine-tuned, allowing consumers to build on or tweak model capability. “Extension” of a models capability can be done in many ways, but a popular way is to combine the model with other models – either by chaining together the inputs and outputs of each model to solve a task, or by blending the outputs of many models together (allowing the models to essentially ‘vote’ on the task outcome).

“Fine-tuning” a model can also be done several ways, but a popular choice among large language model fine-tuners is to take an existing open weights LLM like Llama, add a few extra layers before the “output” layer, and continue training the overall model. Training will end up focusing those last few layers on building specialization to solve for the tasks provided in the fine tuning. Fine-tuning requires just fractions of the training capacity and training time.

The best place to find existing ML models (either source code, binary files or both) or fine-tuned models is HuggingFace, (essentially “GitHub for ML”) which hosts thousands of models and datasets for download.

LLMs “in the loop”

The above few sections talks about ML “being in the loop”, with particular reference to the software engineering development lifecycle, and how that kicks off higher velocity, non-linear value creation. But there’s an even stronger version of this - a view widely held by frontier LLM labs - that as LLMs progress towards AGI, all software engineering tasks that are required to create and kick off that loop will be performed and automated by LLMs themselves: they’ll both build the loop and be inside the loop.

One implication for this stronger version is that the software development lifecycle itself becomes exponentially more efficient. Instead of humans writing code to create ML feedback loops, LLMs will:

  1. Analyze business requirements and automatically design appropriate ML architectures, or simply use themselves as the model of choice.
  2. Generate the code for data pipelines, model training, and production deployment
  3. Monitor model performance and autonomously improve both the models and the surrounding infrastructure
  4. Create and manage the feedback loops that enable continuous improvement

The practical consequences of this are profound:

  • Development velocity will increase by orders of magnitude as LLMs can work 24/7 and parallelize across multiple tasks
  • The quality of ML systems will improve as LLMs can analyze patterns across thousands of deployments and apply best practices
  • The cost of building ML-powered systems will dramatically decrease, democratizing access to sophisticated AI capabilities
  • Businesses can focus on defining problems and desired outcomes, while LLMs handle the entire implementation stack

This represents a fundamental shift from current practices where humans are the bottleneck in the software development process. The transition will likely follow a pattern where LLMs first assist human developers (current state), then handle routine development tasks (near future), and finally manage entire ML pipelines autonomously (future state).

For businesses, this means that competitive advantage will increasingly come from:

  • The quality and uniqueness of data they can provide to LLMs
  • Their ability to clearly articulate business problems and success criteria
  • How effectively they can integrate LLM-driven development into their operations
Building Machine Learning Engineering Teams Title Level at FAANG Compensation /Year Machine Learning Researcher (Senior) E8-E9 $2-4 million USD Machine Learning Researcher (Mid) E6-E7 ~$1-2 million USD ML Engineer (Applied ML) (Senior) E8-E9 ~$2-3 million USD ML Engineer (Applied ML) (Junior-Mid) E5-E7 ~$500k-1.5 million USD Software Engineer (with ML Experience) E6 ~$600k-1 million USD Software Engineer ML Infrastructure E6 ~$600k-1 million USD

Outside of the US, the market is a fraction of the cost. As a guess, Australia, the UK and Europe are likely 2-5x cheaper for similar talent.

Hiring is competitive and expensive. Re-skilling in-house talent may be a better strategy long term, particularly as abstractions and automation of ML model development will likely be bridged with skills that software engineers already know. This bridging will happen over the next 12-36 months. Given AI product integration is inevitable, and AI talent will be required for that, the highest impact question to answer is timing - when and how do we evolve our teams?

Some questions to help ponder timing:

  • Can any of the models listed in “Examples of AI in action” be strung together by competitors to build product differentiation or competitive advantage?
  • Are there existing customer problems where models listed in “Examples of AI in action” can help solve?
  • How fast can the engineering/business culture adapt to team composition shifts.

You can get your current teams preparing for ML now:

  • Do we have the data? Given AI/ML models thrive on data, data is a significant input into building a machine learning value flywheel. If we don’t have the data, can we instrument our products or process to get it?
  • Data lineage will be important: when regulation inevitably lands, regulators will want to know where the data used to train the models came from. Tooling and instrumentation here is critical.
  • Capacity planning: multiple factors more hardware capacity will be required to do ML ops properly (regularly retraining models, generative training data, etc).
  • Identifying how user experience expectations will change in the face of AI everywhere.
  • Have your current engineering team do “deep work” and experimentation with frontier LLMs.
Bibliography

TODO

Author

I previously worked at a FAANG on scaling AI infrastructure and the AI software stack. I now work at a frontier LLM company. You can contact me here: https://9600.dev

https://example.org/blog/comprehensive-ai/
Machine Learning Notes for Developers

Machine Learning systems notes. Some ‘ML’ math at the start, hardware stuff in the middle, training/inference and optimizations at the back. LLMs TBD.

Linear Models

Simplest linear model:

$$ y = mx + b $$ $$ y = 2x + 3 $$

clipboard.png

Where ‘x’ is the input, and ’m’ is the parameter in the context of machine learning. A multivariable linear function generates a plane. In this instance, a plane in three dimensional space:

$$ z = m_1x_1 + m_2x_2 + \dots + m_nx_n + b $$

Example:

$$ z=2x_1−3x_2+1 $$

clipboard.png Defining a linear function in terms of multiple variables:

$$ y=m_1​x_1​+m_2​x_2​+…+m_n​x_n​+b $$

Parameters

A parameter is a quantity that influences the output or behavior of a mathematical object but is viewed as being held constant. Parameters are closely related to variables, and the difference is sometimes just a matter of perspective. Variables are viewed as changing while parameters typically either don’t change or change more slowly. In some contexts, one can imagine performing multiple experiments, where the variables are changing through each experiment, but the parameters are held fixed during each experiment and only change between experiments.

One place parameters appear is within functions. For example, a function might a generic quadratic function as

$$ f(x)=ax^2+bx+c $$

Here, the variable x is regarded as the input to the function. The symbols a, b, and c are parameters that determine the behavior of the function f. For each value of the parameters, we get a different function. The influence of parameters on a function is captured by the metaphor of dials on a function machine.

Messing with lines

clipboard.png

Adding lines:

$f(x) = 3x - 1$

and

$g(x) = -x + 2$

$h(x) = f(x) + g(x)$

$h(x) = (3x-1) + (-x + 2)$

$h(x) = 2x + 1$

clipboard.png

where $f(x)$ is blue, $g(x)$ is red and $h(x)$ is green.

Multiplying two linear functions will always be quadratic (parabola), because the degree of ‘x’ will always increase to 2.

$h(x) = f(x) \cdot g(x)$

$h(x) = (3x - 1) \cdot (-x + 2)$

$h(x) = -3x^2 + 7x - 2$

clipboard.png

Composition of linear functions:

$h(x) = f(g(x))$

$h(x) = 3(-x + 2) - 1$

$h(x) = -3x+5$

clipboard.png

Matrices

An exceptional article explaining matrix math is here.

Matrix multiplication is about information flow, converting data to code and back

Before we look at this analogy, remember that order matters in matrix multiplication: $ A _ B $ does not equal $ B _ A $ because the size of the matrices can be different and when swapped, the shape of the output will change too.

$$ \left[ \begin{array}{cc} 1 & 2 & 3 \ 4 & 5 & 6 \ \end{array} \right] \cdot \left[ \begin{array}{c} 7 \ 8 \ 9 \ \end{array} \right] $$

2 x 3 and 3 x 1 (last and first terms are the same, this multiplication is possible)

$$ \left[ \begin{array}{ccc} (1 \cdot 7) + (2 \cdot 8) + (3 \cdot 9) \ (4 \cdot 7) + (5 \cdot 8) + (6 \cdot 9) \ \end{array} \right]=\left[ \begin{array}{c} 50 \ 122 \ \end{array} \right] $$

clipboard.png

A matrix can be seen as a collection of data points or as a collection of functions. Depending on the context and desired outcome, we can interpret the matrix in different ways.

iFor example, if we interpret a matrix as a collection of data points, we can think of matrix multiplication as performing calculations on that data. On the other hand, if we interpret the matrix as a collection of functions, we can think of matrix multiplication as composing those functions.

clipboard.png

An example of this analogy follows:

clipboard.png

A major application of matrices is to represent linear transformations (i.e. f(x) = 4x. e.g. rotation of vectors in three-dimensional space is a linear transformation, which can be represented by a rotation matrix.

Another application is for graph theory, where you can build an ‘adjacency matrix’ for a finite graph. It records which vertices of the graph are connected by an edge as seen below. For huge graphs (websites connected by hyperlinks etc), these matrices tend to be very sparse, so there are other matrix representations/algorithms? that can be used in network theory.

clipboard.png

Links

Because Linear Algebra, Calculus and Matrix math are used heavily in Machine Learning, it pays to pay attention to them:

Neural Networks

Leverage multiple linear models composed together to build a more complicated non-linear model. Non-linearity comes via two things: 1) the composition of multiple linear layers, and 2) activation functions.

Typical deep learning neural network:

clipboard.png

  • Each of those colored circles are “neurons”.
  • Each neuron receives “data” from any connections to other neurons it has to its left. The biological equivalent being “synapses”.
  • Each of those data are multiplied by ‘parameters’ or ‘weights’ and then summed up. Essentially calculating the equation we saw above:

$$ l_na_z = P_1l_1a_1 + … + P_zl_na_z + b $$

Where ’l’ is the layer, and ‘a’ is the neuron, ‘b’ is the bias. Sometimes expressed as:

$$ b + \sum_{i=1}^{n} x_i w_i $$

An activation function is applied post-calculation:

$$ activation_function\left(b + \sum_{i=1}^{n} x_i w_i \right) $$

clipboard.png

Picking an activation function is dependent on the type of convergence property you want your layer to have.

A useful property of a feed-forward neural network is that data passing through the network can be lowered down to matrix math (x1 -> x3 is the input data, and p1 -> are the weights for the first layer of four neurons in the example above):

clipboard.png

The analogy of matricies being both data and functions applies to neural networks nicely - “data” from the input layer is applied to each of the neural nodes, which are essentially “functions” that are learned over time by the training loop.

clipboard.png

Activations are applied (generally on a per layer basis) to aggressively move forward capture of non-linearity in the model.

Each layer is producing “data” for the next layer of the network, which essentially is performing another transformation on that data for the next layer and so on. There are two useful mental models for what is actually going on here. In the small, the first mental model is that each layer/neuron is “signaling” to the next layer “hey, I’ve seen this before” for values that are positive, and “I’ve not seen this before” for values that are neutral/negative. The second, more abstract and likely more useful, is that each layer/neuron is specializing on a particular task, which is ultimately required for the next task in the pipeline. This is seen in the following visualization of a image recognition neural network:

clipboard.png

In this example, the first layer is learning contrast and edges, which is then used for the second layer to perform identification facial features, which is useful for the third layer which is putting together a represention of a full face. To perform the visualization, each layer output for a given piece of data has been transformed into “pixels” so we can see what it’s signaling as “yes, I’ve seen this before” (i.e. a bright or dark set of pixels) vs. “no, I’ve not seen this before”, which could look like a monotone blank square.

Weighted Sum

This signaling from each neuron as “hey I’ve seen this before” is because the fundamental calculation each neuron is performing is called a “dot product” (or “weighted sum”, or “inner product”), essentially the equation we saw above:

$$ l_na_z = P_1l_1a_1 + … + P_zl_na_z + b $$

(although neurons also have bias, and activation - bias gives the neuron a little more room to maneuver)

If the equation results in zero, the vectors are perpendicular. If the result is positive, they’re similar, and negative dissimilar. The range is +- infinity, so we scale it to -1 to +1 by normalizing each vector before the np.dot call:

a = np.array([0.3, 0.4, 0.5])
b = np.array([0.3, 0.4, 0.5])

np.dot(a, b)
> 0.5

np.dot(a / np.linalg.norm(a), b / np.linalg.norm(b))
> 0.99999999999

With a normalized “weighted sum” a neuron can say “1.0, the input matches my weights perfectly”. This matches what we’re seeing in the visualization of the face recognition model above: you feed input data of a face to a given layer, and the neurons in that layer “light up” (go to 1.0) when they recognize the features they’ve been specialized to see.

Training

Machine learning training involves using a large dataset to “teach” a model how to perform a specific task (like the example above of classifying faces), by adjusting the model’s internal parameters to minimize the error in its predictions over the course of training.

The psuedocode for the training loop looks like this:

  • Initialize random weights for the model
  • For each piece of data -> prediction pair (i.e. the data you’re inputting, and the correct answer for the given task), do:
    • Push data through the model
    • Compare the output of the model with the correct prediction
    • Calculate the error (the difference between the models prediction and the answer)
    • Backpropogate the error through the weights of the model

Back-propagation is the term given for the mathematics to calculate the change required in each of the model weights/parameters in order to reduce prediction error next time around. This is done by calculating the derivative of the error, i.e. the direction and slope of the current training output with respect to the correct prediction:

from quantinsti.com:

clipboard.png

$f(X)$ is the plot of the error. The “starting point” is early in the training loop, the “final value” is the correct prediction. For each iteration of the training loop, calculate the error direction and slope by deriving the model prediction with respect to the correct value, and send that “direction and slope” backwards through each layers weights, nudging them in the correct direction.

The calculation of each weights movement and magnitude is done through the chain rule and partial derivatives, which is explained in detail here.

Inference

Once the model has been trained (or ‘converged’, meaning training is not substantially improving its predictive performance), the model can be packaged and deployed for use. Inference is the term used to describe the act of pushing unknown data inputs through the network to get an output or prediction for use. There is no data/answer pair (the data for inference is generally out of sample, meaning it wasn’t seen during training), so there is no back-propagation pass.

Size and Scope of Neural Networks

The following table shows the relative size of different types of deep learning networks. Weights during training are typically represented as either 16 bit floats (half precision) or 32 bit, so to calculate a rough order of memory required for training:

$\text{Parameter memory} = \text{Num}\space \text{of}\space \text{parameters}\space \times N\space \text{bytes}$

$\text{Activation memory} = \text{Num}\space \text{of}\space \text{activations}\space \times N\space \text{bytes}$

$\text{Gradient memory} = \text{Num}\space \text{of}\space \text{parameters}\space \times N\space \text{bytes}$

where $N$ is the precision used for training (2 for 16 bit training, 4 for 32 bit).

Model Training Time Size Compute XOR Milliseconds 4 parameters Laptop Snake Minutes 12 parameters Laptop MNIST Digit Classification Hours 100-300 thousand Laptop ImageNet image classifier 15-20 hours 25-150 million Desktop YouTube Ranking and Recommendation Weeks Billions Server Farm Llama 2 Language Model Months 7-70 billion Data Center ChatGPT Language Model Months 100’s billions Data Center

The Llama 2 paper shows total time, power consumption and carbon emitted to train:

Size Time (GPU years) GPU’s GPU (W) Power Consumed (MW) Metric Tonnes CO2 7B 21.3 2048 400W 73 MW 31.22 13B 42.6 2048 400W 147 MW 153.90 70B 199 2048 400W 688 MW 291.42

(as an aside, the Las Vegas power generation station produces 359 megawatts of natural gas powered electricity, reference)

Inference

Given inference doesn’t require the backwards pass, the memory requirements are very different, just requiring space for parameters and input data:

$\text{Parameter memory} = \text{Num}\space \text{of}\space \text{parameters}\space \times N\space \text{bytes}$

The model can also be “shrunk” or “compressed” through quantization of model parameters. As the Hugging Face doc mentions: “Quantization is a technique to reduce the computational and memory costs of running inference by representing the weights and activation’s with low-precision data types like 8-bit integer (int8) instead of the usual 32-bit floating point (float32).”

An example of the process is detailed in this NVIDIA technical blog, but the basic premise is you’re looking at the distribution of neuron results, then using a smaller, less precise value to represent that distribution:

clipboard.png

Shrinking from 32/16 bit to 8 or even 4 bit significantly improves the performance of inference (throughput and latency) at the expense of model accuracy. It also allows large models like Llama 2 to be shrunk and deployed on consumer grade video cards (ones with 12-24 GB of VRAM). This link has 2, 3, 4, 5, 6 and 8 bit quantized versions of Llama 2 13B, with the maximum memory required being ~14GB.

clipboard.png

Both the forward pass (the prediction of the model, given data), and the backwards pass (the nudging of weights in the training loop given error) are perfectly suited to GPU acceleration, given most of it is matrix math, which GPU’s have specialized for years given 3D games use matrices to represent polygons (data), and transformations of polygons (functions, like rotation) in 3D space.

Neural Networks as Code

The Python based PyTorch framework is the clear winner right now in terms of researching and productionizing deep learning models:

clipboard.png

Simple PyTorch example of learning the a model for XOR (eXclusive OR):

A B A XOR B 0 0 0 0 1 1 1 0 1 1 1 0

Imports and defining the data:

import torch
import torch.nn as nn
import torch.optim as optim

# Define the XOR dataset
X = torch.tensor([[0, 0], [0, 1], [1, 0], [1, 1]], dtype=torch.float32)
y = torch.tensor([[0], [1], [1], [0]], dtype=torch.float32)

Define the PyTorch Model: 2 inputs (A and B), one output (result):

# Define a simple neural network with one hidden layer
class XORNN(nn.Module):
    def __init__(self):
        super(XORNN, self).__init__()
        self.fc1 = nn.Linear(2, 2)  # Input layer with 2 neurons (for 2 input features)
        self.fc2 = nn.Linear(2, 1)  # Output layer with 1 neuron (for 1 output)
        self.relu = nn.ReLU()  # Activation function

    def forward(self, x):
        x = self.relu(self.fc1(x))
        x = self.fc2(x)
        return x

Define the loss/error function (the function that will calculate the error to backpropogate):

# Initialize the model, define the loss function and the optimizer
model = XORNN()
criterion = nn.MSELoss()
optimizer = optim.SGD(model.parameters(), lr=0.1)

The training loop:

# Train the model
epochs = 10000
for epoch in range(epochs):
    model.train()
    optimizer.zero_grad()
    output = model(X)
    loss = criterion(output, y)
    loss.backward()
    optimizer.step()

    if epoch % 1000 == 0:
        print(f'Epoch {epoch}, Loss: {loss.item()}')

criterion() calculates the error or loss. loss.backward() computes the gradients of the loss function with respect to each parameter in the model, and optimizer.step() updates the models parameters based on the computed gradients. There are different loss functions, and different optimizers. In this instance, the SGD (Stochastic Gradient Descent) optimizer updates the weights according to this formula:

$$ \text(parameter) = \text(parameter) - \text(learning\space rate) \times \text(gradient) $$

Inference, once the model is trained:

# Test the model
model.eval()
with torch.no_grad():
    test_output = model(X)
    print(f'Test output: {test_output.numpy()}')

The output of the program:

Epoch 0, Loss: 0.693159818649292
Epoch 1000, Loss: 0.6866183280944824
Epoch 2000, Loss: 0.6372116804122925
Epoch 3000, Loss: 0.5274494886398315
Epoch 4000, Loss: 0.41659027338027954
Epoch 5000, Loss: 0.16883507370948792
Epoch 6000, Loss: 0.0747787281870842
Epoch 7000, Loss: 0.045021142810583115
Epoch 8000, Loss: 0.031647972762584686
Epoch 9000, Loss: 0.024227328598499298

Result from: [0, 0], [0, 1], [1, 0], [1, 1]

[[0.01471439]
 [0.98264277]
 [0.982537  ]
 [0.02787167]]

After 9000 Epoch’s (iterations of training), there’s still a slight amount of loss, which shows up in inference with numbers close to 1.0 and 0.0, but not exact.

Tensors

Tensors are a general name for multidimensional data. A 1d tensor is a vector, a 2d tensor is a matrix, a 3d tensor is a cube, a 4d tensor is a vector of cubes, and so on.

clipboard.png

PyTorch mostly defines and speaks tensors:

X = torch.tensor([[0, 0], [0, 1], [1, 0], [1, 1]], dtype=torch.float32)`

Defining neural networks in PyTorch is about specifying the shapes of tensors for the neural network architecture you want to build.

A 2D image as data, can be represented by a (row, column, channel) tensor of pixels, where channel is the RGB channel for color:

image = torch.tensor([768, 1024, 3], dtype=torch.uint8)  # uint8 pixel values between 0 and 255

Tensors become important when we get to the part on training using batches, GPU acceleration and performance optimizations.

PyTorch Models

Given:

class XORNN(nn.Module):
    def __init__(self):
        super(XORNN, self).__init__()
        self.fc1 = nn.Linear(2, 2)  # Input layer with 2 neurons (for 2 input features)
        self.fc2 = nn.Linear(2, 1)  # Output layer with 1 neuron (for 1 output)
        self.relu = nn.ReLU()  # Activation function

Peeking under the hood of self.fc1, reveals tensors that capture the current weights:

model.fc1.weight
> tensor([[-0.2161, -0.4656],
         [-0.3299,  0.2059]], requires_grad=True)

And the calculated gradients/derivatives of error from the backward pass in:

model.fc1.weight.grad
>
tensor([[-3.5395e-03, -1.9939e-03],
        [ 2.3395e-05, -8.5202e-04]])

Activation results/metadata are created on the forward pass (as they’re needed for computing gradients), then thrown away. Calling model.eval() and/or torch.inference_mode() disables capturing activation results as they’re not required to be stored for inference.

As these networks get really large, optimization libraries (talked about in later sections) fudge with the precision of these weights, gradients and activations, and deal with moving them around efficiently - from GPU to DRAM to NVRAM etc. As an foreshadowing example: the bitsandbytes library is a drop-in wrapper around CUDA functions to enable 8-bit optimizers, matrix multiplication and quantization.

Acceleration of Training and Inference

First, an exploration of CPU architecture to give a sense of relative difference between traditional computation and parallel/vectorized computation.

CPU
  • CPU architecture and performance over time:
    clipboard.png

  • SISD (single instruction, single data) and SIMD (single instruction multiple data).

  • Pipelined execution (Scalar Pipelined Execution). Instructions and data are read from memory (typically employing read-ahead performance strategies) and streamed into the CPU’s execution pipeline:

    clipboard.png

  • Many optimizations employed to re-arrange that pipeline of instructions for performance. Instruction parallelism (Superscaler execution: executing multiple independent instructions in parallel), thread parallelism (hyper-threading etc), instruction re-ordering, loop unrolling etc. to improve throughput of instruction streams.

  • On-die caches (L1, L2, L3 and occasionally L4) employed to speed up instruction and data retrieval:

  • Cache size and latency chart above is a bit old. Latest 13th gen consumer Intel chips have ~36MB L3’s. L4 is uncommon.
  • AMD EPYC has up to 256 hardware threads, and up to 1.1GB of L3 cache at a TDP of 400W.
  • Cache memory L3+ transfer rates are order ~400 GB/s
  • DRAM transfer rates ~40-50GB/sec
  • Specialized extended instruction set for floating point operations: AVX256 and AVX512 Advanced Vector Extensions.
  • EPYC 7742 (128 threads, 3.4 GHz, 256MB L3 Cache) can do a theoretical 2.2 TFLOPS/sec double precision on AVX256 (source). Xeon 8380 seems to be able to do just over 3 TFLOPS/sec of double precision on AVX512.
GPU
  • H100 is the latest NVIDIA GPU for deep learning workloads. Shown below are two form factors: PCIe (brown rectangular thing, and SXM which is the black circuit board).

  • SXM is a high bandwidth socket that connects NVIDIA GPUs to the board. ~700W of power delivery straight to the card (no cables required). 4-8 GPU slots.

    clipboard.png

  • 30 TFLOPS @ FP64 (apples to CPU apples); 60TFLOPS @ FP32 and 2000 TFLOPS @ bfloat16.

  • 3072 GB/sec memory bandwidth to 80GB of HBM3.

  • NVLink GPU interconnects (i.e. connecting GPU direct to GPU, any-to-any) can achieve 900 GB/sec on SXM and ~600GB/s on PCIe. You can think of NVLink as a supercharged PCIe.

  • Configuration of 8 GPU with NVIDIA HGX baseboard with 2x CPU:

    clipboard.png

    clipboard.png

  • With a fully loaded HGX board stacked with 80GB H100’s, you’ll get:

    • 16 petaFLOPS of FP16
    • 640 GB of HBM3 memory
    • 900 GB/s of intra-GPU bandwidth
    • Total aggregate bandwidth of 7.2 TB/sec.
  • DGX is the name given to the pre-built 14’inch high rack mounted server you can buy.

  • NVLink GPU to GPU interconnect. Think of it as a significantly faster and higher bandwidth PCIe. Coherent data and control transmission over GPUs, but is also supported by CPUs. (One random fact, IBM used NVLink for CPU to CPU comms for POWER9).

  • NVLink and NVSwitch and how all that works is a bit confusing, so:

Networking
  • NVLink is a supercharged GPU to GPU signal interconnect. Just like a desktop computer with your classic AMD CPU has a specific number of PCIe ’lanes’ (AMD Ryzen 7000 series has 28 PCIe lanes supporting PCIe 5.0 bandwidth speed), a HGX board has a specific number of NVLink lanes.
  • H100 has 18 fourth generation NVLink interconnect lanes, 900 GB/sec bandwidth.
  • NVSwitch. NVLink connections can be extended across more GPU nodes and across machine boundaries to create a flat address, high-bandwidth, multi-node GPU cluster (like forming a data center-sized GPU).
  • NVSwitch is an ASIC that connects to, and switches NVLink GPU to GPU communication.
  • You can add a second tier of NVLink switches for cluster to cluster NVLink communication. NVLink second-level can connect up to 256 GPUs $( 32\space \text{machines} \times 8\space \text{GPUs})$ and 57.6 TB/s of all-to-all bandwidth.
  • Going beyond 256 GPU’s requires hitting the network, so we have to head out via PCIe through a physical network interface, enter Infiniband:
  • Infiniband (details about ConnectX-7, the latest here) is an NVIDIA aquired networking standard (think of it like a faster, higher bandwidth, lower latency Ethernet) through its acquisition of Mellanox.
  • Infiniband defines the protocol, switching and signaling, physical materials (optics up to 10km) and higher level message passing/software API.
  • Network Adapters for Infiniband perform two amazing feats:
    • They do 400 Gb/sec.
    • They do RDMA (Remote Direct Memory Access), which allows the network adapter to ‘zero copy’ data from GPU memory straight to the wire, bypassing the CPU. Recipients can do the same, where the network adapter will push inbound straight to GPU memory.
  • Thus, 256 GPU’s NVLink via NVSwitch, or > 256 GPU’s via Infiniband connections between “pods”.
SuperPODs
  • NVIDIA DGX SuperPOD is basically that 256 GPU cluster:

    clipboard.png

  • Facebook has the Research Super Cluster which has ~6080 GPU’s via 760 NVIDIA DGX A100 systems, and ~56 Petabytes of storage and connected via Infiniband.

    clipboard.png

Why so much compute, memory and bandwidth?
  • Generally hard to find good documentation and papers on the compute, memory and networking requirements for training the largest models around today, but we can estimate:
    • GPT 3 (175 billion parameters), trained at float16 precision.
    • ~650 GB for weights, ~650 GB for gradients, roughly 650 GB for the intermediate activations, and another ~650 GB for optimizer states (gradient statistics and so on).
    • Roughy 2.7 TB of memory required.
    • A SuperPOD of 256 80GB GPUs gives you ~20 TB of HBM3 memory, enough to train GPT.
  • Rumor has it GPT 4+ is ~1-2 trillion parameters.

Significant amount of optimization work needs to be done to efficiently package and train these large models. Might explore some of these later, via papers like this one.

GPU in the small

TODO: how GPU’s work

  • GPCs (GPU Processing Clusters)
  • SMs (Streaming Multiprocessors)
  • CUDA cores
  • Tensor cores
  • shared memory, L1/L2 cache
  • building cuda kernels
H100 Physical Architecture H100 SMX5 A100 SXM4 SMs 132 108 FP32 CUDA Cores Per SM 128 64 FP64 CUDA Cores Per SM 128 32 Tensor Cores 528 432 L2 Cache Size 50MB 40MB TDP 700W 400W
  • Physical layout of the H100: GPCs, SMs, Cores, Cache, HBM3, and PCIe interface:

    clipboard.png

  • GPU Processing Cluster (GPC): A physical grouping of SMs. Hardware accelerated barriers, and intra-GPC data sharing for SM to SM communication. GPCs can be programmatically accessed, and form a nice logical grouping for programmers to access beyond typical SM programming. Clusters are a H100 feature.

  • Streaming Multiprocessor (SM): Fundamental logical (and physical) processing unit in NVIDIA. Houses the compute cores, schedulers, load/store units, L1 cache, Shared Memory.

    clipboard.png

  • CUDA Core: processing elements within SM. Executes FP/INT instructions. Older architectures can do 2x FP or 1x PF and 1x INT instruction in parallel. Not sure what H100 can do.

    clipboard.png

  • Tensor Core: processing element for tensor calculations. Mixed precision, although not all precisions are supported. H100 turned off some precisions, and turned on others. Previous generations of NVIDIA GPU could do 4x4 tensor calculation, but I think A100/H100 can do 4x8.

    clipboard.png

  • Inside the H100 Tensor core, with an example of FP8 matrix multiplication and accumulation:

clipboard.png

  • Memory access layout of an NVIDIA GPU, the sizes of caches and memory, and the throughput and latency of memory access. The diagram below also shows a high level view of how memory is accessed and shared between Streaming Multiprocessors:

clipboard.png

  • Memory and execution semantics are programmed using a “logical” grouping and scheduling system that maps reasonably well to the physical hardware groupings we see above. These logical grouping and scheduling primitives (foreshadowing: Clusters, Blocks, Warps, and Threads

  • CUDA Kernel: a function that is executed on a CUDA enabled NVIDIA GPU. You can think of CUDA as more like a low level programming API. There are methods that deal with the logical aspects of GPU programming (talked about later) like scheduling, threads, blocks, and so on, and the actual computation part: the mathematics applied to the data flowing through the CUDA cores. CUDA is an API and an extension to the C++ programming language. The nvcc (NVIDIA compiler) is used to build a C++ program that contains a CUDA kernel function.

  • “Roofline” (or the ceiling of computing performance) of GPU relative to CPU via different memory mechanisms:

    (source)

    clipboard.png

Talking about the logical aspects of GPU programming means we have to take a quick look at the CUDA API and programming abstraction:

“My first matrix multiplication” CUDA routine:

#include <iostream>
#include <cuda_runtime.h>
#include <cmath>
#include <chrono>
#include <cublas_v2.h>
#include <cblas.h>

__global__ void myMatMulKernel(float* A, float* B, float* C, int N) {
    int row = blockIdx.y * blockDim.y + threadIdx.y;
    int col = blockIdx.x * blockDim.x + threadIdx.x;

    if (row < N && col < N) {
        float val = 0.0;
        for (int i = 0; i < N; ++i) {
            val += A[row * N + i] * B[i * N + col];
        }
        C[row * N + col] = val;
    }
}

int megabytes = 50
int N = static_cast<int>(sqrt((megabytes * 1024 * 1024) / (sizeof(float))));

// ...

dim3 threadsPerBlock(16, 16);
dim3 blocksPerGrid((N + threadsPerBlock.x - 1) / threadsPerBlock.x,
                   (N + threadsPerBlock.y - 1) / threadsPerBlock.y);

myMatMulKernel<<blocksPerGrid, threadsPerBlock>>(..., ..., ..., ...)

And while we’re doing the “hello world” of CUDA, let’s test the performance of it against cuBLAS and CPU cblas:

Device 0: NVIDIA GeForce RTX 4090
Matrix dimension: 3620 x 3620
Matrix size in megabytes: 49.9893 MB
Setting matmul to **myMatMulKernel**
Time for loop 0: 44.6998 ms
Time for loop 1: 43.1279 ms

Setting matmul to **cublas**
Time for loop 0: 32.2928 ms
Time for loop 1: 26.7959 ms

Setting matmul to **CPU cblas**
Time for loop 0: 126.717 ms
Time for loop 1: 124.189 ms

CUDA, as a bunch of bullet points:

  • Three main steps required to run a CUDA program:
    • Copy the input data from host memory to device memory.
    • Load the GPU program and execute, caching the data on the GPU for performance
    • Copy the results from device memory back to host.
  • Looking at our previous ‘hello world’ example:
__global__ void myMatMulKernel(float* A, float* B, float* C, int N) {
    int row = blockIdx.y * blockDim.y + threadIdx.y;
    int col = blockIdx.x * blockDim.x + threadIdx.x;
  • The kernel takes pointers to A and B matrices, and the result C as well. ‘N’ is the dimension of the matrices (assumes square matrices for simplicity).
  • The kernel calculates row and column indices for the current thread using its block and thread indicies (CUDA sets this up for all kernels).
    float val = 0.0;
    for (int i = 0; i < N; ++i) {
        val += A[row * N + i] * B[i * N + col];
    }
    C[row * N + col] = val;
  • You can think of the code above performing a matmul on a small piece of the larger data, with N, and the block and thread indexes setting up the boundaries for that data.
  • The configuration of how big and how many of those smaller chunks of data comes later: Threads in a block get

  int megabytes = 50
  int N = static_cast<int>(sqrt((megabytes * 1024 * 1024) / (sizeof(float))));

  dim3 threadsPerBlock(16, 16);
  dim3 blocksPerGrid((N + threadsPerBlock.x - 1) / threadsPerBlock.x,
                     (N + threadsPerBlock.y - 1) / threadsPerBlock.y);

  // call our fancy matmul
  myMatMulKernel<<<blocksPerGrid, threadsPerBlock>>>(d_A, d_B, d_C, N);
  • For a matrix of 50 megabytes @ sizeof(float) N will need to be a matrix size of 3620x3620.
  • We define a 2D grid of threads, where each dimension has 16 thread, 16x16 = 256 threads, per block.
  • With N being 3620 and a 16x16 thread block size, number of blocks ends up being 227 x 227 = 51529 blocks.
  • CUDA blocks are logical, not physical. They get mapped to a Streaming Multiprocessor (SM) via the CUDA runtime. The scheduler will try and fill up the SMs with as many thread blocks as possible. Each SM has at least 2 “warp schedulers” (I think H100 has four?), and a warp is a funny name for a group of 32 threads. Therefore, your thread blocks get mapped to warps which get mapped into SMs via the warp scheduler.
  • When you launch a kernel, you specify a logical organization of your data, grouping threads into blocks, and blocks into a grid. CUDA maps this on to the physical hardware: into SMs, then onto warps, which then run those 32 threads in SIMT (Single Instruction Multiple Thread), but on different data.
  • Physical mapping requires optimization: if you remember, SMs are grouped physically into GPCs, so intra-SM communication/data sharing will have differing latencies depending on grouping proximity.
Warp Branching
  • If threads within a warp take different paths due to conditional branching, the scheduler will execute these paths serially, disabling one side of the path at a time. This reduces throughput performance.
Speeding up things in the small

Lots of libraries get built to optimize kernels for different shapes, sizes and precisions on both GPU and CPU:

Calling kernels from the CPU also has overhead: around 20-40 microseconds, so ping ponging between the CPU and GPU shuffling data and results back and forward will accumulate this overhead. You can hopefully enqueue enough kernels so that the GPU spends most of its time executing and not waiting between steps.

Spotting gaps in a GPU profile where the GPU is idle waiting for the host gives the dev a hint that optimization will be necessary:

clipboard.png

This can mean things like:

  • Concatenating small tensors or using a larger batch size to make each launched kernel do more work.
  • Switching away from “eager mode” to “graph mode”. Eager mode launches and runs operators (generally kernels) as soon as they’re seen; Graph mode builds an execution graph lazily, which is then compiled and executed on the GPU as a whole.
  • Enabling backend kernel/graph optimizers like XLA, or TorchDynamo + Torch FX which crawl these execution graphs and perform optimizations on them like kernel fusion (taking multiple kernel calls and transforming them into a single kernel call).
Hyperparameters of GPU Optimization

Hyperparameters are the ‘knobs and dials’ of an algorithm that determine the performance: training, inference, and model performance. The process of tuning these parameters for optimal performance is called hyperparameter tuning.

You can think of the physical hardware characteristics and the logical software parameters as “hyperparameters” for GPU tuning and optimization:

  • Num of threads per block
  • Blocks per grid
  • Locality of code to shared memory
  • Optimal use of registers for instruction throughput
  • Memory access patterns
  • Thread synchronization
  • Precision
  • Instruction mix (different instructions have different latencies)
  • etc etc.

In the context of deep learning, you have logical groupings of data (weights) and logical groupings of matmul and other functions (forward pass and back-propagation) with order ~billions of data points that need to be mapped on to these GPUs via these hyperparameters. Mapping these well can mean orders of magnitude better training and inference performance.

The mapping is a bin packing problem which is considered NP-hard, where containers (the underlying neural net) with fixed sizes are provided and the goal is to find the best way to pack them into the GPUs physical boundaries.

Optimizations for Training and Inference

Most of the ‘global’ model optimizations for training and inference are about multi-GPU multi-machine parallelism. We’ll go through the different types before looking at the libraries that offer support for them:

Parallelism

(A lot of this is lifted/based on an old version of the HuggingFace parallelism docs

Different types of Model Parallelism, which can be combined (and this is basically what DeepSpeed does):

  • DataParallel (DP). Replication of weights, activations, embeddings etc across GPUs, and input data is sliced and sent through the replicated pipelines. Synchronization happens at the end of the pipeline.

  • TensorParallel (TP) or Tensor Slicing, or “Model Parallelism”. Tensors (weights) are split into multiple chunks across GPUs. Aggregations of full tensors happens only for operations that require it.

    clipboard.png

    • HuggingFace docs point to a model example that benefits from TP in one of the Megatron papers:

    clipboard.png

    • In this instance, Y gets tensor slice parallelized over multiple GPUs as input into GeLU for GeLU(X A) can be fed independently:

      $$ [Y_1, Y_2] = [ GeLU(X A_1), GeLU(X A_2)] $$

    • Where A is the split tensor weights, and X is the input data. dropout(Y B) requires the full tensor Y which is were recontruction will happen.

  • PipelineParallel (PP). Weights are split up ‘horizontally’ (i.e. horizontal across layers, as they’re normally diagrammed) across GPUs and data is fed-forward across GPU boundaries.

    clipboard.png

    • Input data is split into ‘mini batches’ to build a pipeline (in this diagram, the pipeline is going from the bottom to the top, with F being the forward pass and B being the backward pass:

    clipboard.png

    • The pipeline is then fed-forward across multiple GPU boundaries, however this creates a ‘bubble’ of idle work like the one seen above (albeit a smaller bubble than if a single batch was forwarded through).
    • There’s a mini-batch parameter that you can tune to reduce the bubble size.
    • HuggingFace has support for pipelining:
      from transformers import pipeline
      generator = pipeline(task='automatic-speech-recognition')
      which will load a task specific pipline for a given model and take care of multi-GPU pipelining. The library parallelformers performs this optimization for HuggingFace transformer models.

The techniques discussed are combinable, which is what libraries like DeepSpeed (mentioned next) help you do:

clipboard.png

(mapping of workers to GPUs on a system with eight nodes, each node has four GPUs. Coloring denotes GPUs on the same node. Model Parallel here is synonymous with ‘Tensor Parallel’)

DeepSpeed

Microsoft Research DeepSpeed (which is a palindrome!) notes. Speeds up both training and inference for PyTorch models, sometimes by orders of magnitude. It’s a wrapper on PyTorch.

Before diving in to the different optimizations and techniques, we should look at ZeRO first, as it’s kind of central to most of the DeepSpeed work. ZeRO (and I guess their latest stuff, ZeRO Infinity?) feels to me like a collection of techniques for training (and inference) scaling:

  • Infinity Offload Engine: makes GPU, CPU and NVMe memory sort of like a “flat address space”, where weights, activation’s, embeddings etc can live anywhere on those different memory types, sort of ‘opaque’ to the training and inference process. This means scaling model sizes well beyond available GPU memory.

  • Memory-centric tiling: TODO

  • Bandwidth-centric partitioning: TODO (although I think what this is doing is exploiting the fact that with NVLink and NVSwitch you can treat multiple GPUs on node and cluster as being “one”)

  • ZeRO-Infinity paper has the following diagram, which shows Layer 0 weights, calculated gradients and optimizer states being partitioned across DRAM + NVMe. These are loaded in parallel into multiple GPUs, gradients calculated and pushed back down and re-partitioned across DRAM NVMe:

    clipboard.png

    • One of the neat things explained in the paper is the requirement that NVMe/PCIe bandwidth be completely saturated - it takes into account things like a) parallelized reads from NVMe being desirable, b) the NVMe -> CPU -> GPU data transfer resulting in possible memory fragmentation, and c) overlapping reads/writes to NVMe etc etc. It looks like it optimizes memory block sizes and scheduling to achieve optimal and saturated throughput.
  • TODO: explain the rest of the paper

Inference
  • Multi-GPU parallelism. Partitioning models that are larger than single GPU VRAM across multiple GPUs. Introduces cross-GPU communication overhead, and can reduce per GPU computation granularity. There ends up being a latency/throughput trade-off as you’re deciding the parallelism ‘degree’ (i.e. how much parallelism). This “inference-adapted” parallelism is a tunable parameter within DeepSpeed.
  • Supports Tensor Parallel tensor slicing based multi GPU parallelism for Transformer models, both within nodes and across nodes.
  • ZeRO-inference
    • Uses “ZeRO-Infinity” techniques applied to inference.
    • Pins model weights in CPU or NVMe, and streams weights layer-by-layer in to the GPU for inference computation. Outputs are kept in GPU VRAM for next layer calculation.
    • Inference time is GPU layer compute + PCIe fetch time.
    • Very throughput orientated: by limiting GPU memory usage of the model to a few layers, ZeRO inference can use the majority of GPU memory to support a large amount of input tokens (long sequences or large batch sizes).
    • One GPT3 175B layer requires 7 TFLOPS to process an input of batch size 1 and a sequence length of 2048. Computation time dominates over the latency of fetching model weights.
    • Supports layer pre-fetching.
    • Has this cute trick where GPUs will fetch a sliced tensor from multiple different PCIe links, then enable GPU-GPU higher speed data transfer via NVLink to have each GPU get the entire tensor. Super cute.
    • TODO: finish
Training

Speeds up training through: optimizations on compute/communication/memory/IO and effectiveness optimizations on hyperparameter tuning and optimizers

  • As with inference, enables data parallelism, model parallelism, pipeline parallelism and the combination – I guess they call it 3D parallelism?
  • Distributed training with Mixed Precision
  • Uses “ZeRO” optimizer: data parallel, partitioning of model states and gradients across CPU/NVMe etc.
  • 1-bit Adam optimizer reduces communication intra-node by up to 26x.
  • Layerwise Adaptive Learning: an optimization strategy where different layers in the network might have different learning rates. DeepSpeed supports this as “advanced hyperparameter tuning”, via a sort of extension to Layerwise called LAMB
  • Specialized transformer CUDA kernels.
  • Progressive Layer Dropping: improves generalization performance of the network (reduce overfitting) and happens to be a performance improvement too. Layers get progressively “skipped” or “dropped” in the forward and backward pass of training. A few different strategies to this you can choose from.
  • Mixture of Experts (MoE): build individual models that are trained on specific tasks or specific data (experts). Build a ‘gating network’ which is trained on figuring out what expert to route what request (i.e. for a given input space, what model should that input be sent to). During inference, the gating network directs each input to the appropriate expert for processing. The outputs of individual experts can be combined in a weighted sum to produce the final output.
  • TODO: finish
NVIDIA TensorRT OpenAI Triton
  • OpenAI Triton
  • Python like programming language to build and deploy hardware agnostic kernels.
  • Triton kernel for adding two matrices:
BLOCK = 512
# This is a GPU kernel in Triton.
# Different instances of this
# function may run in parallel.
@jit
def add(X, Y, Z, N):
   # In Triton, each kernel instance
   # executes block operations on a
   # single thread: there is no construct
   # analogous to threadIdx
   pid = program_id(0)
   # block of indices
   idx = pid * BLOCK + arange(BLOCK)
   mask = idx < N
   # Triton uses pointer arithmetics
   # rather than indexing operators
   x = load(X + idx, mask=mask)
   y = load(Y + idx, mask=mask)
   store(Z + idx, x + y, mask=mask)
  • Python -> Triton-IR -> Triton Compiler -> LLVM-IR -> PTX (Parallel Thread Execution, assembly language for NVIDIA CUDA GPUs)
  • LLVM IR:
def void add(
  i32* X .aligned(16),
  i32* Y .aligned(16),
  i32* Z .aligned(16),
  i32 N .multipleof(2)
) {
entry:
  %0 = get_program_id[0] i32;
  %1 = mul i32 %0, 512;
  %3 = make_range[0 : 512] i32<512>;
  %4 = splat i32<512> %1;
  ...
  • PTX: CUDA Assembly:
.visible .entry add(
    .param .u64 add_param_0, .param .u64 add_param_1,
    .param .u64 add_param_2, .param .u32 add_param_3
)
.maxntid 128, 1, 1
{
    .reg .pred     %p<4>;
    .reg .b32     %r<18>;
    .reg .b64     %rd<8>;
    ld.param.u64     %rd4, [add_param_0];
    ...
  • TODO: finish
Other Optimizers/Frameworks
  • FlexFlow - low latency high performance LLM serving.
  • List of PyTorch Optimizers
  • Apache TVM: End-to-end compilation stack for Machine Learning: unified IR (Intermediate Representation) that deep learning frameworks can lower down to, then that IR can be lowered down to GPUs, CPUs, ASICs and so on.
  • Google XLA: XLA (Accelerated Linear Algebra). ML compiler stack for Tensorflow and PyTorch.
  • Google JAX: Autograd (automatic differentiation library) + XLA (see above). Go from Python/Numpy to XLA to GPU/TPU.
  • AMD HIP: C++ runtime and API to build GPU kernels for AMD /and/ NVIDIA GPUs. It’s basically AMD’s version of CUDA. HIPIFY is a tool to automatically convert CUDA code to HIP.
Large Language Models Transformer Architecture

TODO

Training and Inference

TODO

Local LLMs

TODO

Fine Tuning

TODO

Links
https://example.org/blog/machine-learning-developer-notes/
Managing Managers Notes

[This is a bunch of bullet points on managing managers and teams, and that ended up being the foundation of a large set of ‘mental models’ I wrote. More on how to do that later…]

Preface: Congratulations!
  • Our desire for organizational stability is our worst instinct.
  • Seeing an org as a fixed cost is precisely the wrong mindset, you should be creative with your organization and engage with it like a ‘work product’.
  • Right now there is someone on your team who is doing great. They could do more if you let them, but they aren’t because you’re happy with the work they’re doing. That’s the wrong mindset for growth. Are you pushing themselves to the point where they’re starting to fail? If not, they won’t understand their capacity, and you won’t realize the extra ‘yield’ you’ve already got.
  • As a rule, you should double the capacity of your leadership every year. That’ll stay ahead of growth (linear) and cross-functional complexity (quadratic).
  • Let people impress you. Stretch them. When things start to fail, that’s signal on where to hire.

“Congratulations on your transition. We call it a transition for PR reasons, but it’s actually a brand new job, and your new API is people”.

Tuning Yourself
  • People leave managers, not companies.

  • Figure out your strengths and weaknesses

    • Build many feedback loops. Always be getting signal. Tune yourself. Breakdown inertia to building that feedback loop.
    • Self-reflection: serious thought about ones character, actions, motivations.
  • Why bother? You’re reducing the uncertainty you have about how you are seen, how you are performing within your environment.

  • Build many amazing feedback loops. Always be ‘pulling’ signal. Always be tuning.

    clipboard.png

    • 400-500 sensors, 2GB of telemetry per race
  • Build a brilliant mental simulator. Perform mental simulations on everything.

  • Get a mentor and a coach.

    • Learn the difference: mentoring is long term, strategic, requires relationship building. Coaching is task orientated, Socratic method, performance based.
    • They will lead you to self realization of your blindspots, strategize and plan for your career.
    • I got a coach.
  • Learn how to be a mentor and a coach.

    • Given we only consciously observe when asked (by others, or ourselves) or motivated to focus, coaching and the Socratic method works amazingly well.
    • ‘We believe we’re seeing the world fine until it’s pointed out to us’.
    • Best book on this is: [https://www.amazon.co.uk/Incognito-Secret-Lives-Brain-Canons-ebook/dp/B004SP1UEI/]
    • Your primary job is to reduce the uncertainty your coachee has of their environment
    • Difference between therapist, mentor and coach:
      • Therapist: understanding current situation
      • Mentor: skill transfer, directional guidance
      • Coach: Understanding and transformation
    • Cox proposes the Experiential Coaching Cycle, which has three substantive ‘constituent spaces’; i.e., Pre-reflective Experience, Reflection on Experience and Post-reflectve Thinking (where each space is “a hiatus where events occur or reflection happens”); and three major ‘spokes’ or transition phases; i.e., Touching Experience, Becoming Critial, and Integrating (p. 5)
      • Pre-reflective Experience “informs everything the clients eventually reflects on and talks about in the coaching”; Reflection on Experience “involves deliberation and dailed descriptive articulations of experiences and their associated perceptions and emotions”; and Post-reflective Thinking “involves logical, cognitive processing, such as metacognitive activity and post-rationalisation, this also encompasses the effectiveness of mindfulness and other embodied practices” (p. 6).
      • Touching Experience is “an articulate attempt to grasp feelings or intuitions which appear to be buried or submerged”;
      • Becoming Critical is “encouraged by critical, rational thought that aims to move the client towards a more critical stance”; and
      • Integrating is “testing ideas and making changes” (p. 7).
  • Articulating the experience through listening.

  • Cox distinguishes between ’empathetic’ listening (reproductive) and ‘authentic’ listening (constructive)

  • Clarifying: In therapy, the main function is to enable the helper to gain an accurate picture of the client’s reality in order to make decisions about what course of ’treatment’ to provide. In coaching it is clients who need to order and reorder their thoughts and create a picture, and so they need to be provided with opportunities to discover new ways to do this. (p. 71)

    • Critical:
      • Reflection
      • Cox distinguishes between phenomenological reflection, which involves accepting the essential meaning of pre-reflective experience (p. 76-77) and critical reflection, which involves “challenging existing perspectives” (p. 74). Sometimes, however, “the relationship between describing and analysing is so close that in practice they will occur in close succession, perhaps iteratively”
  • You’re unconscious self is shaped by your genetics, and your environment. But you can tune that too.

    • ‘Steering wheel example’
  • Ask fucking good questions

    • Journalism ‘five W’s.

    • Always be asking why.

    • ‘Engineer shows up late every day…’

      clipboard.png

  • But learn how to be a brilliant listener

    • Observe how often people ’talk past each other’
    • Deeply understanding someone’s position is required for empathy
    • This means putting aside your ‘agenda’. An agenda is like an invisible wall between you and the person.
    • Learn about ‘power dynamics’ and how that affects your conversations.
      • One person doesn’t create the dynamic, you both do.
    • Vulnerability is a tool to rebalance power. There are others.
    • (Added bonus: it’ll make your life relationships better too!)
    • ‘Yes, but’ a classic signal that someone may not have felt heard or understood
    • To reduce someone else’s uncertainty about their world, you must first understand the shape of that uncertainty (their biases, how distant they are from the truth). A classic error is to transmit feedback directly, without first moulding the feedback to best adapt and reduce their current state of uncertainty.
      • Example: “John manages Brian, and Brian has been doing the same job for two years, and is looking to grow in new dimensions. Brian likes his job. John wants to communicate to Brian that he should move out of his current role into a brand new team, and that John has a great plan to manage that transition safely and effectively. John spends a little bit of time communicating the why, and a lot of time communicating the great plan he’s come up with. Brian’s uncertainty about his competency and value in John’s org grows wider as a result, and Brian becomes anxious.”
      • John should have done two things: identified the uncertainty, and focused most of the conversation on reducing that uncertainty: “I believe in you. I’ve been looking for a while now to identify new growth opportunities for you. I know you’re enjoying your role, and frankly, you’re doing an excellent job, but I believe over time you’ll grow and enjoy this new one a lot more, and the growth you’ll have in this new role will open up further opportunities like X”.
  • Deeply understand relationships:

    • John Gottman
    • Four horseman: criticism, defensiveness, contempt, stonewalling
    • Destructive communication styles: harsh startup, flooding, body language
    • It’s not trust, it’s safety.
    • Bids for connection: ‘I want to connect with you, so please give me your attention’. Rejected bids lead to poor relationship outcomes, accepted bids like ‘I understand you, I want to help you, I accept you, I’m interested’ lead to positive outcomes.
  • Crucial conversations:

    • Learn the art of the ‘metaconversation’
    • More crucial, more likely to be silent of violent
    • Safety is important: mutual purpose ‘you care about their best interests and goals’, mutual respect ‘you care about them’.
  • Now learn the manager job:

    • Show care by understanding what is most important for each person’s experience
    • Support people in finding opportunities to develop and grow based on areas of strength and interest
    • Set clear expectations and goals for individuals and the team
    • Give clear, actionable feedback on a timely basis
    • Provide the resources people need to do their jobs well, and actively remove roadblocks to success
    • Hold people and the team accountable for success
    • Recognize people and teams for outstanding impact
    • Holding people accountable:
      • Set expectations
      • Invite commitment
      • Measure progress
      • Provide feedback
      • Link to consequences
      • Evaluate effectiveness
  • Focus on continuous improvement via feedback loops:

    clipboard.png

    • Area under the red curve: growth trajectory I typically see when managers try to ‘wing it’. Area under the blue curve: growth trajectory when focusing on continuous feedback driven improvement. Learning == effort + feedback loops + reflecting on failure + understanding successes.
    • Effort is expensive, honest feedback loops are rare, reflecting on failure is confrontational to your ego, and success isn’t always earned (it’s sometimes random).
  • Learn to Learn

    • I’d define learning as the process to which one comes to deeply understand something. People with deep understanding usually exhibit these properties:
      • Are usually able to effortlessly communicate things at any level of abstraction.
      • Have absorbed the topic through many different lenses or viewpoints, and are often able to hold many hypotheses in their heads at once.
      • Are able to articulate what they don’t know, and where the limit of their understanding is.
      • Sometimes have their own unique perspective on a topic, synthesized from either their own experience, or by connecting disparate topics together to create something new.
    • Read well:
      • Most of us are experts at comprehending words written on a page, and we’re pretty good at synthesizing those words into facts that can be stored away in memory, but we’re over-exercised on fast-food content: entertainment news, rambling and superficial blog posts, Twitter. Indexable facts of information, but they don’t lead to understanding of a complex topic.
      • The distinction between reading for information and reading for understanding is important. Reading for information, you become informed. Reading for understanding adds a few more important things: you know why it’s the case, what connections are with other facts (how is it the same, how is it different, and in what respect), and why its important.
  • Coaching examples:

    • “I’m looking for guidance on how to manage up. My direct manager is leaving the company, I have a new manager who’s my Director. The pulse results from the team are concerning: ‘my leaders are transparent’ scores are low, and anecdotally they’re saying they don’t understand the vision and direction that the org is taking. I’m looking for feedback on how to deliver this message in a good way”.
      • Two ways this coaching session can go: 1) talk about ways to have a potentially difficult conversation, or 2) coach the individual to understand ‘why’ he’s blocked. In this instance, he was scared, and he was scared because his default modus operandi is to build a relationship of safety first and then start to have these sorts of conversations. I asked him what may be causing him to be scared, given all rational analysis of this situation is that his director will 99.9% of the time welcome the feedback.
    • “I’m working with an important client on a project. I have a technical resource that I’m using from a different org whom I’ve worked with before. This person is disengaged now, not showing up, and it looks like the project may not ship on time. What do I do?”
      • Again, two ways: coach the person on how to get resources from elsewhere, or talk to his manager or talk to him or whatever it is. Second way is more interesting: what prevented this person from having an honest conversation with the technical resource and figuring out why he was disengaged?
  • We have this ideological understanding of conflict, where we say it happens when people want different things. But I think it actually happens when people want the same thing - the same promotion, recognition for doing the same job well, the same toy as a kid.

  • Recognize that conflicts are essential for great relationships because they are the means by which people determine whether their principles are aligned and resolve their differences.

  • Conflict/disagreement can happen if shared values aren’t well understood.

  • In all relationships, 1) there are principles and values each person has that must be in sync for the relationship to be successful and 2) there must be give and take. There is always a kind of negotiation or debate between people based on principles and mutual consideration. What you learn about each other via that “negotiation” either draws you together or drives you apart

Understanding Teams
  • Forming, storming, norming, performing
    • Forming: high dependence on leader for guidance and direction. Little agreement on team aims other than received from the leader. Answer lots of questions about purpose.
    • Storming: Team members vie for position as they attempt to establish themselves relative to the group. Clarity of purpose increases, but uncertainties persist. Power struggles, people not listening to each other, frustration etc. Frustration with weaknesses of other team members.
    • Norming: Agreement and consensus is largely formed among team. Roles and responsibilities are clear and accepted. Commitment is strong. Team somewhat self reflective.
    • Performing: Team is strategically aware, clearly knows what it’s doing, shared vision, strengths of the team and team members are known. No participation from the leader. Team is able to work towards the goal.
  • The current potential of the team is the sum of all members strengths and ‘untapped’ yield.
  • Learn timing and space. The richest, deepest conversations need space. Think of all the road-trips where you’ve had deep and meaningful’s.
  • Team mind: working memory (information presented, discussed, moved on and forgotten); Long term memory; limited attention; has the ability to learn.
  • Cares about identity, has ego, culture, bias etc.
  • You’re responsible for setting the team composition. It’s one of the most important things you can do as a manager and a leader. To build that “performing” team, you need the right makeup of people all working on it
  • Make sure you have ‘active protagonists’: they must be an active force on your team. A simple differentiation between active and passive: whether they cause things to happen or whether things happen to them.
  • People don’t change that much. Don’t waste time trying to put in what was left out. Try to draw out what was left in.
  • Four keys (First Break All The Rules pp 67)
    • When choosing, select for talent
    • When setting expectations, define the right outcomes
    • When motivating, focus on strengths
    • When developing, find the right fit
  • Culture: ‘Culture is the behaviors you reward and punish’
    • ‘If you didn’t build a consistent culture of humility, you failed to build an immune system against arrogance’.
  • Collaboration:
    • Most people confuse collaboration. Three distinct levels: coordination, communication, collaboration. Collaboration implies teams working together to achieve a common purpose.
    • Coordination: least productive
    • Communication
    • Collaboration: most productive
    • What the research says:
      • Members of complex teams are less likely - absent other influences - to share knowledge freely, to learn from one another, shift workloads with flexibility, help others to complete jobs and make deadlines
      • Teams above 20 people have decreased collaboration. 150+ or more usually don’t have much at all
    • What helps improve collaboration:
      • Executives/leaders who invest in supporting collaborative relationships and showing it.
      • Exposing or making transparent the collaboration that happens at the “top”. i.e. share meeting notes from the leads meetings. etc.
      • Trust is essential. Anything to build trust only increases the probability of successful collaboration outcomes.
      • Being purposeful about designing the relationships you want, and ensure sufficient investment. i.e. track it, put people on it, define outcomes, hold accountable.
  • Teams need a precise understanding of what it means to be a “healthy team”. As an example:
    • We ensure psychological safety by:
      • Ensuring that leaders of teams hold members accountable for inclusiveness and openness.
      • Align people’s strengths to the teams needs
      • Build diversity and tolerance into teams culture
      • Hold leaders of teams accountable for moving from ‘storming’ to ‘performing’ within a reasonable time frame.
      • Ensure all individuals deeply understand what is expected of them at their current level, and the next level.
      • Work through conflict quickly, with empathy and understanding.
      • Be intolerant of, and manage out individuals who are not maintaining safe environments for their peers.
      • Optimizing for the whole, not the part. Support movement/change across the organization, even if it’s not locally optimal.
    • We grow people by:
      • Understanding how people want to grow and ensuring that their grow path has a reasonable probability of success.
      • Help build an individual growth plan that’s lined up with the teams needs
      • Differentiate between ‘being stretched’ and ‘setup for failure’.
      • Ensure that leaders understand how to manage the anxiety of uncertainty of people in the ‘stretched’ category.
    • We innovate by:
      • Bold bets includes projects/goals that have a high degree of uncertainty, as opposed to risk.
      • Risk: a state of uncertainty which is able to be measured.
      • Uncertainty: a risk that is hard/unable to be measured.
      • We understand the time horizons for innovation and categorize our bets into them.
    • We execute by:
      • Have a clear and measurable sense of what value these goals are providing to the organization.
      • Goals will typically be 50/50 goals (the probability of hitting them is 50%).
      • Break down goals into executable milestones, and regularly track how well we’re doing against them.
      • regularly re-test assumptions we have made about ‘why’ and ‘how’ we’re achieving these goals.
      • We will “fail-fast” if new information about assumptions or the goal changes the upside for the goal.
      • We transfer all learning after failing-fast.
      • We focus on high quality engineering.
  • Hold your teams and leaders accountable to those values and standards.
  • Teams are about sociological stories (stories about people, groups, adaptation to the sociological situation) rather than psychological stories that are typically focused on the individual (overcoming difficult situations, pushing through barriers etc).
Leadership
  • What is leadership? Being able to think for yourself and act on your convictions.
  • Leading. Meaning finding a new direction, not simply putting yourself at the front of the herd that’s heading toward the cliff.
  • Thinking means concentrating on one thing long enough to develop an idea about it. Not learning other people’s ideas, or memorizing a body of information.
  • You’re always signaling.
  • As a leader, you set the tone. Hate conflict? You’ll try and strip the team of an opportunity to vent, air laundry and so on.
    • ‘Decision on going to a War Room, lots of conflict, ‘guys let’s move on’.
  • As a leader and manager, you set and direct the team values
  • Communicate intent. Team members can then “read your mind”. Intent is used to improvise and adjust.
  • Learn the different types and styles of leadership
    • Authoritative leadership: mobilizes a team toward a common vision and set of end goals. “Come with me”.
    • Affiliative leadership: bonding and belonging. “People come first”. When the team needs to heal.
    • Coaching leadership: “try this”. Builds teams for the long haul.
    • Coercive leadership: “do what I tell you”.
    • Democratic: consensus through participation. “What do you think?”
  • Your job as an org leader is to make your org a ‘stable molecule’. Unstable molecules take too much effort to hold together.
  • Many successful, creative people aren’t good at execution. They succeed because they forge symbiotic relationships with highly reliable task-doers.
  • Cold Starting a new team/career change (Good Boz note): An algorithm for ramping up quickly. First step, meet with the people on the team:
    • First 25 minutes: ask them to tell you everything they think you should know. Take copious notes. Stop them to ask about things you don’t understand.
    • Next 3 minutes: ask about the biggest challenges the team has right now.
    • Final 2 minutes: ask who else you should talk to. Write down all names.
      • First one gives you a picture of the teams work, and helps you build a framework for integrating information quickly. The nature of what people choose to discuss is very valuable signal about the problems the team face (it may be about the work, the organization, or the process).
      • Second gives you a cheat sheet on where there is easy low hanging fruit to impress the team (our team meetings suck), and gives you a barometer for the broader challenges you’ll need to face over the months.
      • Third gives you a valuable map of influence in the organization. The more often names show up and the context in which they show up tends to provide a very different map of the organization than the one in the org chart.
Goals, Planning, Decision Making
  • Vision, goals, outcomes.

  • Always be setting context. Always.

  • The output of planning is an organization aligned around the plan.

  • “Nothing kills excitement like ambiguity”

  • Different settings require different communication strategies (individual vs. team).

  • Introduce signal and feedback loops in to the system: Pre mortems, post mortems

  • Goals must have a sense of being achievable. It’s easier for people to problem solve in discrete chunks.

  • Learn how to brainstorm. Never control the conversation. You can really get a sense for how messy the teams mind is from a good brainstorming session.

  • Listen to your team’s creative potential: when making movements towards new goals/directions, always encourage your team to bubble ideas and trust that they’ve probably got more derived insight than you do.

  • Become an expert decision maker:

    • Good decisions are measured by the process, not the outcome: a good decision is one that was sized and assessed rationally, where we’ve made reasonable judgements on all options, and their probabilities of occuring, and then made the rational call based on that. We too often conflate the outcome (good or bad) with the quality of the decision. Outcomes are probabilistic.

    • The goal (if we have one) is not to make perfect decisions but rather to make better decision than average. To do this, we required either good luck or better insight (more complete set of options or a better calculation of probabilities).

    • All decisions are bets.

    • Betting consists of choices, probability, risk, belief and decision. The rational process for betting is simple:

      • Assess all (or as many) possible outcomes as possible (choices)
      • For all outcomes, assign a probability of that outcome happening (probability)
      • For all outcomes, calculate the ‘upside’ or ‘payoff’ relative to all other outcomes and calculate any downside also. (risk)
      • Assess the size/stake/investment/commitment of the bet. (risk)
      • Assess ‘how you’re being fooled’ – cognitive bias, incomplete information, deception (belief)
      • Decide by finding the choice that has a payoff greater than the risk. (decision)
    • Not making a decision is also a bet (that the status quo has a higher payoff than what’s at risk)

    • Most bets are bets against ourselves – most of our decisions we are not betting against another person, rather we’re betting against all future versions of ourselves that we’re not choosing. We’re constantly deciding among alternative futures: going to the movies vs. staying at home. At stake in a decision is a return of money, time, happiness, health or whatever we value.

    • Risk: first articulated by economist Frank H. Knight in 1921: “something that you can put a price on”.

    • Uncertainty is ‘risk that is hard to measure’.

    • First level thinking: All you need is an opinion on the future “The outlook for the company is favorable, meaning the stock will go up”. Second level thinking does not accept the first conclusion: “What is the range of possible outcomes?” “What’s the probability I’m right?” “What’s the follow on effects?” “How could I be wrong?”. The Most Important Thing Illuminated

    • World Champion Chess Master Emanuel Lasker once said “when you see a good move… look for a better one”.

    • An important aspect to improving the odds of making good choices is the ability to distinguish between decisions within our circle of competence, and those on the outside:

      clipboard.png

  • Become an expert problem solver:

    • Most problems are unstructured, which makes them very hard to solve. Ill structured if the initial state is not defined, or the terminal state is undefined, or the procedure for transforming the initial state into the terminal state is undefined.
      • “What do you want to do with your life?” Unstructured in all senses.
    • Environment shapes plans: stable environment more complex plan. Is complexity good? Fast moving environment
    • Measure measure measure. Measurement is the science of reducing uncertainty, and is a probabilistic exercise. The cost of measurement should be lower than the benefit of better decision making.
    • Consider which decisions are worth making: zone of indifference.
    • Tactical: delay, option value, upside/downside
    • Leverage points: Chess players are routinely looking for leverage: I have an opportunity to attack the queen (but not capture it), the leverage point is generating other opportunities for attack given the queen offensive.
    • Alter the goal, it may generate new leverage points.
    • Imagine shrinking the team by half - what changes?
    • And review the decision (post mortem). Expertise is markedly improved when participants have a chance to review the decision, and the decision making process.
    • Story: Expert chess players spend a lot of time reviewing decisions they made to improve their play for the next tournament. While practice may seem like the intuitive reason experts become experts, it’s actually purposeful review and criticism of their previous games decisions that get them there.
    • Chess players learn through memory and experience where to concentrate their thinking. Elite chess players tend to be good at metacognition – thinking about the way they think – and correcting themselves if they don’t seem to be striking the right balance.
  • Then after all that, realize that sometimes your role is to manage a coalition: “A manager is usually portrayed as a great decision maker - the scientific decision maker. She’s got her spreadsheet and she’s got her statistical tests and she’s going to weigh the various options. But in fact, real management is mostly about managing coalitions, maintaining support for a project so it doesn’t evaporate.”

  • In normal companies, the truth is whatever important people agree it is.

  • Think Ahead: it’s really easy to get bogged down in the details of some work and forget the purpose of what you’re actually doing. Step back regularly, and ask yourself questions to recall and clarify /why/ you’re pursuing a goal.

    • If I achieved X, how would I use it?
    • What features of X are the most important for me?
    • Would a weaker/simpler version of X suffice?
  • On Goals:

    • Goals for some people are a source of energy and motivation, however it’s important to make sure you have full awareness of the impact the goal definition will have on you. As an example: perhaps you’re playing a game competitively, and you define a goal of “I want to beat player X, or I want to achieve rank Y”. Failing at one instance of the game might generate negative emotional impact “I’m a failure, because this means I’m not achieving my goal”. Redefining the goal as “I want to achieve excellence in this game, and that means learning from success and failure” can alter the emotional reaction.
    • Identify where a goal may be causing emotional stress, then look at the questions above: “What features of the goal are most important for me?” and “Would a weaker/simpler version of X suffice?”.
  • All warfare is based on deception.

  • Know when you’ve already won, and if you have, stop fighting, even if your opponent wants to keep going (this is a common strategy in Go apparently).

  • Inversion: ‘Invert, always invert’. Examine problems backwards as well as forwards.

    • Facebook IPO: 50 billion. To grow to the biggest company in the world, it needs to hit $380 billion. In order to do that, it would need to generate a 22% growth rate per year for 10 years as a ‘maximum upside’. Compared to the market of 8%, that’s not quite a rosy a picture as one would want for the risk. Inversion is taking a problem and working it backwards to a solution.
  • What matters more in decisions? Analysis or Process?

    • Both, but process matters more: you can have amazing analysis and poor process and therefore poor outcomes, but poor analysis and amazing process will by default weed out poor analysis.
    • Imagine a courtroom trial that consists of the prosecutor presenting PowerPoint slides, in 20 compelling charts he says why the defendant is guilty. The judge challenges some questions (prosecutor has good answers), and then rules guilty and we’re done. This process is shocking. Cross-examination matters.
  • Be sensitive to base rates: “Donald is either a librarian or a salesman. His personality can best be described as ‘retiring’. What are the odds he is a librarian?”. Salesman outnumber libraries 100:1 (1% base rate). (Bayes).

  • ‘Mimicking the herd invites regression to the mean’. If you act average, you will be average.

  • Two track analysis: What are the facts? And where is my brain fooling me?

  • Measurement:

    • We should care about measurement because it informs key, but uncertain decisions.
    • Measurement is the methods and process for reducing uncertainty.
    • Define the decision; Determine what you know now; Compute the value of additional information; Measure where information value is high; Make the decision and act. Rinse repeat.
    • Soft, touchy-feely-sounding-things like ’employee empowerment’, ‘creativity’ or ‘strategic alignment’ must have observable consequences if they matter at all.
    • Measurement: a quantitatively expressed reduction of uncertainty based on one or more observations.
    • Uncertainty: The existence of more than one possibility where the ’true’ outcome is not known. Measurement of uncertainty is a set of probabilities.
    • Risk: a state of uncertainty where some possibilities involve a loss or catastrophe or undesirable outcome. Measurement of risk is a set of quantified probabilities with quantified losses.
  • Goals vs. Systems:

    • Talked about here (http://blog.dilbert.com/2013/11/18/goals-vs-systems/), Scott Adams talks about using systems instead of goals. His example: losing ten pounds is a goal (that most people can’t maintain), whereas learning to eat right is a system that substitutes knowledge for willpower. Going to the gym 3-4 times a week is a goal, but if you don’t enjoy exercise it’ll be hard to achieve and maintain. Compare that with a system of being active every day of the week with an activity that feels good – the system will be more effective in achieving the outcome you want.
Your Role
  • Tune your managers to managerial excellence

  • Recognize that you’re overseeing management as opposed to other types of work.

    • Rely on the observations and reports of others, rather than directly experiencing situations
  • You’re now out of the business of ‘how’ and in to the business of ‘why’.

  • You’re signaling even more, character matters. The team may start to copy your behavior. [https://en.wikipedia.org/wiki/Social_cognitive_theory]

    • And they’re constantly looking signals of appreciation, recognition, leadership and more.
  • Your channeling your orgs values through your managers

  • As Jay Parikh would say, “Scale yourself!”

    clipboard.png

    • Strategic focus and execution:
      • Just like your managers, you should have a vision and a strategy, and that should map to the greater org strategy.
      • In order to drive impact to the organization, you must be plugged in to the organization.
      • Feed the ‘impact’ beast. Your team is hungry.
      • This will take up about 2-3x more time than it used to.
    • Lateral management:
      • Oil the machinery for cross-team collaboration. Build relationships with managers and IC’s in other parts of the org and lean on those, particularly in times of crisis. Build peace time relationships.
      • Your managers will be more inward focused than (particularly new ones). Anticipate this, build a feedback loop with that teams partners, channel that feedback.
    • Change leadership:
      • Change is hard, that’s why they pay you the big bucks.
      • Steady the ship as she’s turnin’.
    • People management:
      • You’re mostly a coach now. Deal with it.
      • Sometimes you need to be a passenger, even if you think the car is going to crash. More things are going to break than you can fix. Sometimes it’s okay to let them break. Arbitration between your teams needs and the organizational needs - you’re responsible for balancing those tradeoffs.
  • Anticipation of problems and opportunities is probably the single biggest value add you can bring to your team

  • Understand what system and culture you’re operating within:

    • (Blatently lifted from [https://steveblank.com/2018/04/23/why-the-future-of-tesla-may-depend-on-knowing-what-happened-to-billy-durant/]):
    • The modern corporate structure can be traced back to Alfred P. Sloan, who was president of General Motors from 1923 to 1956 when the U.S automotive industry grew to become one of the drivers of the U.S economy.
    • Sloan was the first to work out how to systematically organize a big company. He put in place planning, strategy, measurements and most importantly, the principles of decentralization.
    • When Sloan arrived at GM in 1920 he realized that the traditional centralized management structures organized by function (sales, manufacturing, distribution, and marketing) were a poor fit for managing GM’s diverse product lines. That year, as management tried to coordinate all the operating details across all the divisions, the company almost went bankrupt when poor planning led to excess inventory, with unsold cars piling up at dealers and the company running out of cash.
    • Borrowing from organizational experiments pioneered at DuPont (run by his board chair), Sloan organized the company by division rather than function and transferred responsibility down from corporate into each of the operating divisions (Chevrolet, Pontiac, Oldsmobile, Buick and Cadillac). Each of these GM divisions focused on its own day-to-day operations with each division general manager responsible for the division’s profit and loss. Sloan kept the corporate staff small and focused on policymaking, corporate finance, and planning. Sloan had each of the divisions start systematic strategic planning. Today, we take for granted divisionalization as a form of corporate organization, but in 1920, other than DuPont, almost every large corporation was organized by function.
    • Sloan put in place GM’s management accounting system (also borrowed from DuPont) that for the first time allowed the company to: 1) produce an annual operating forecast that compared each division’s forecast (revenue, costs, capital requirements and return on investment) with the company’s financial goals. 2) Provide corporate management with near real-time divisional sales reports and budgets that indicated when they deviated from plan. 3) Allowed management to allocate resources and compensation among divisions based on a standard set of corporate-wide performance criteria.
  • Failure for a manager to identify where they are on the response spectrum of ‘arrogant’, ‘balanced/objective’, ‘imposter’ and ’naive/ignorant’:

    • Consider this scenario: an IC report who was performing well is put into a new situation outside of their comfort zone and/or strengths. The IC begins to struggle, and is unable to root cause for themselves why they are struggling. They start to push hard (and possibly emotionally) on their manager to ‘fix things’, but they do it in a non-obvious way: they start raising issues and problems that they’re seeing in the team, the situation, and with the manager. The differences in manager response based on the spectrum can be quite diverse:
      • Arrogant: these problems aren’t problems, the real problem is the IC’s inability to deal with the situation. Interprets IC feedback as criticism. Believes IC is ‘blaming others’ and not taking responsibility. Leverages power-imbalance between IC and manager. Possible outcome: manager gives “feedback” to IC that they’re raising problems, not solutions and that they should own it more (or some such). Problems get worse until they hit a pain threshold for either the manager or IC. IC gets fired or IC quits. Manager hasn’t reflected on the possibility that it may be their own skill gap (switching from coaching to directive for instance) that caused the problem.
      • Imposter: these problems are criticisms of me and my ability to manage this style of person. Possible outcome: real root cause unaddressed, over-pivot to trying to own the problems and emotions on behalf of the IC, communication to IC that they’re not at fault. Possible quick ’re-pivoting’ of the IC’s work/situation to avoid the situation. Missed opportunity for coaching/growth of the IC.
      • Naive/ignorant: these problems seem like they’re temporary and perhaps unimportant. Once this person “grows”, they’ll overcome them. Possible outcome: IC quits. Manager will eventually get fired.
      • Balanced: manager reflects on a range of possible root causes here: IC isn’t criticizing, they’re struggling and unsafe, and struggling to articulate that they need help; my management style isn’t appropriate for this person given this situation; this person may be lacking skills or capability or maturity to deal with this situation and needs direct feedback; this may be a performance problem that needs to be managed; this may be a broader problem (team culture issue, relationship issue etc). Possible outcome: a higher probability of root causing real issue; installs higher signal ‘feedback loops’ which increase safety and increase probability of IC being successful or failing fast if required. Manager learns how to adjust style faster. Leads to better outcome for both manager and IC.
    • Managers with more experience seem to have a higher likelihood of drifting into ‘arrogance’ and not identifying that.
    • These different categories are possibly related to one’s default ego bias.
    • Arrogance is a more dangerous form of naivety (naive people can be ‘woken’, arrogance tends to be stubborn). Both are dangerous for IC’s regardless.
    • How do you identify where you are in the spectrum? How about others?
Notes on Team Execution: Lockdowns

[Written within a FAANG Infrastructure group around ~2015]

Given Infra is in lockdown right now, we thought we’d share our recipe for lockdown success. It’s by no means the only tasty recipe in town, so you should fork and customize for your own situation. Enjoy.

Ingredients:

  • A very clear “not sure we can achieve it, but fuck it’s close” goal.
  • ‘x’ hungry engineers that really want to achieve the goal.
  • A fixed, short time period, calendars cleared.
  • A endorphin inducing feedback loop, injected daily.
  • Strong “war cry” leaders that leave no person behind.
  • Pizza and beer.

The compiler team has completed four lockdown’s in the past two years and loved three out of the four, and sorta liked the fourth. The first one we did is what kicked off the tradition, and that was in response to the new compiler being significantly slower than the previous compiler (60% of the throughput…) and no good ideas as to why. We “locked down” with a janky and made up process, a lot of motivation, but not a lot of belief that it’d help us over the line. We clawed our way to 100% parity in 6 weeks (and an extra ~10% on top of that soon after), and we’ve been doing it ever since. Here’s how we do it, and what we’ve learned:

Build Awareness
  • Book a different space. Move people. Important to get people out of their day-to-day locations.
  • Set expectations early that a lockdown is coming. Schedules cleared etc.
  • Build excitement by mentioning it a lot at meetings and whatnot. Talk to other teams, ask if others want to join.
Build Out the Process

The process we use to run our lockdowns is the “endorphin inducing feedback loop”, which in turn builds a lot of momentum and intensity for the lockdown period. Ours is crafted to induce a few behaviors within the team that we don’t typically see outside lockdown: 1) emphasis on small, incremental wins that sum up to hitting the goal, 2) lots of rich communication between team members, 3) making it okay to fail. The process we built out is a weird derivative of “agile”, and it looks like this:

clipboard.png

We have four sections of a whiteboard: (1) is the backlog of tasks and activities we’re going to go after described by stickies (colors don’t actually matter), (2) contains a list of engineers and the tasks (stickies) they’re currently working on, (3) is what we’ve completed so far, divided in two buckets: done, and negative results, and (4) a graph of where we’re at right now relative to the goal.

So what’s going on here?

Backlog

This whiteboard section contains a two dimensional area where ideas for lockdown are plotted using stickies. We generate the ideas through several brainstorming sessions, and we constrain the ideas generated by limiting the ‘x’ and ‘y’ axis. For compiler lockdowns, the ‘x’ axis constrains the amount of time we want to spend on these tasks, and the ‘y’ axis forces us to estimate the impact on the goal. We chose three days as the limit to drive the behavior of incremental tuning, as opposed to new feature development or refactoring.

We tag the sticky with a task number and the summary of what the idea is. Here’s what it looks like close up:

clipboard.png

We typically have at least two brainstorming sessions (a couple of hours long) before the lockdown begins. It’s important to space them a day or two apart, so engineers have time to think about ideas in the shower and what not. During lockdown, we continue to hold brainstorming sessions (usually one a week) to keep the two dimensional space full and up to date. It is important to do these as a group, because the quality & position of the ideas is much higher from immediate group feedback, than if they were placed individually. The conversation usually spurs new ideas.

Who’s Working on What

This section is very simple. It contains a list of engineers unix handles and shows exactly which stickies they’re working on right now. We make sure nobody is holding on to more than 2-3 at a time.

What’s Done

This section is divided up into two spaces: “done” and “negative results”. For the compiler, this is important because it provides the team with signal on what ideas have been profitable vs. not and allows engineers to prioritize other ideas that are similar to profitable ones. It also makes it very clear that ideas which failed to produce results are useful signal, and therefore valuable.

clipboard.png

Are We There Yet?

Arguably the most important ingredient of the process we use is a graph tracking how we’re doing relative to the lockdown goal. We display this at all times, and update once a morning. This is a major source of the “endorphin inducing feedback loop” and our lockdowns would undoubtedly be less successful without one:

clipboard.png

The Mechanics

During the weeks of lockdown we cycle through this simple mechanic: brainstorm ideas, plot them on the backlog graph, engineers pull them off and put them next to their names, and when they’ve tested the idea they put it in the “done” or “negative result” section. Rinsing and repeating this process drives the graph up and to the right. What this doesn’t tell you is exactly what it feels like to be in the room while the mechanics take place. This is what you can expect:

  • Constraining the ‘x’ and ‘y’ axis means brainstorming sessions don’t go off the rails. When an idea is pitched and its deemed longer than the time constraint it gets put on the “post lockdown” backlog. These sessions usually trigger an early sense of excitement and anticipation.
  • Stickies on the two dimensional plot have two interesting side-effects: 1) the team ‘blesses’ the amount of time we should be spending on a given task and empower any engineer to fail fast after the time is up, and 2) stickies in this space have no owner and allow any engineer to simply walk up, grab a sticky and get to work. There is no fucking around with engineers second guessing themselves.
  • When an engineer does walk up to the stickies board to either grab a sticky, or move it to the “done” bucket, all eyes in the room are fixed on what they’ll pick off next, or where the sticky ends up. This leads to conversations about the task immediately, and usually follow up stickies are generated in discussion.
  • Engineers showing up in the morning immediately check the graph and start chatting about the effect of yesterday’s work. They feel excited about the graph moving in the right direction, and motivated to keep pushing.
  • It’s very easy to see how hard your teammates are working (it’s right there on the board) and it creates a bit of a social contract to not fuck around and not slack off.
  • There’s a lot of positive team reinforcement, “great job!” type thing. Leadership often arises from unexpected people.
  • The amount of conversation that takes place between engineers is the biggest game changer.
What Can Go Wrong?

Our last lockdown was good, but it wasn’t as great as the last three. We actually hit our goal, but the measure of success for us includes how we felt about the lockdown, and we felt good but not great about it. Here’s a few “antipatterns” we’ve learned:

  • Friction in the “endorphin inducing feedback loop” causes a lot of frustration. For us the tooling in our workflow was broken a lot during the last lockdown so we were often blind to how we were going day-to-day.
  • You are what you measure. Graphs are a proxy for what you care about. If you don’t have faith that the proxy is a real reflection of the goal you want to achieve, you won’t get that endorphin buzz.
  • There needs to be strong belief throughout the team that the desperate slog you’re in right now is deeply appreciated by the company (handy tip: invite Jay to your lockdown and ask him to bring beers - it’s a nice morale boost).

GOOD LUCK!

Random Notes

TODO: clean all these up, integrate them into the themes above.

Thinking about Thinking

Charles Darwin (from [https://www.fs.blog/2016/10/charles-darwins-reflections-mind/]):

  • He did not have a quick intellect or an ability to follow long, complex or mathematical reasoning. If you’re aware of your limitations, you can counter-weight it with other methods.
  • “I have no great quickness of apprehension or wit which is so remarkable in some clever men, for instance, Huxley. I am therefore a poor critic: a paper or book, when first read, generally excites my admiration, and it is only after considerable reflection that I perceive the weak points. My power to follow a long and purely abstract train of thought is very limited; and therefore I could never have succeeded with metaphysics or mathematics. My memory is extensive, yet hazy: it suffices to make me cautious by vaguely telling me that I have observed or read something opposed to the conclusion which I am drawing, or on the other hand in favour of it; and after a time I can generally recollect where to search for my authority. So poor in one sense is my memory, that I have never been able to remember for more than a few days a single date or a line of poetry.”
  • He did not feel easily able to write clearly and concisely. He compensated by getting things down quickly and then coming back to them later, thinking them through again and again.
  • He forced himself to be an incredibly effective and organized collector of information.
  • “As in several of my books facts observed by others have been very extensively used, and as I have always had several quite distinct subjects in hand at the same time, I may mention that I keep from thirty to forty large portfolios, in cabinets with labelled shelves, into which I can at once put a detached reference or memorandum. I have bought many books, and at their ends I make an index of all the facts that concern my work; or, if the book is not my own, write out a separate abstract, and of such abstracts I have a large drawer full. Before beginning on any subject I look to all the short indexes and make a general and classified index, and by taking the one or more proper portfolios I have all the information collected during my life ready for use. I have no great quickness of apprehension or wit which is so remarkable in some clever men, for instance, Huxley. I am therefore a poor critic: a paper or book, when first read, generally excites my admiration, and it is only after considerable reflection that I perceive the weak points. My power to follow a long and purely abstract train of thought is very limited; and therefore I could never have succeeded with metaphysics or mathematics. My memory is extensive, yet hazy: it suffices to make me cautious by vaguely telling me that I have observed or read something opposed to the conclusion which I am drawing, or on the other hand in favour of it; and after a time I can generally recollect where to search for my authority. So poor in one sense is my memory, that I have never been able to remember for more than a few days a single date or a line of poetry.”
Imposter syndrome:
  • “Inability to internalize their accomplishments and a persistent fear of being exposed as a fraud”
  • “Chronic self-doubt”
  • “Confidence issue”
  • “Rational response to insufficient feedback”
Quippy Mental Models:
  • Avoid Stupidity: “we continue to try more to profit from always remembering the obvious than from grasping the esoteric. … It is remarkable how much long-term advantage people like us have gotten by trying to be consistently not stupid, instead of trying to be very intelligent. There must be some wisdom in the folk saying, `It’s the strong swimmers who drown.’”

  • You must do hard things that create value. Being a taskmaster isn’t going to cut it anymore.

  • https://www.farnamstreetblog.com/2016/10/charles-darwins-reflections-mind/

  • Plans are maps that we become attached to. Scrap them, isolate the key variables that you need to maximize and minimize.

  • We seek competition as validation. Instead of going through the small door that everyone is rushing towards, try going around the back. https://www.youtube.com/watch?v=3Fx5Q8xGU8k

  • Tell me something that is true, that very few people agree with you on.

  • Domino theory of reality: small incremental steps in a story to take you from reality, to the surreal.

  • We all have things that we value that we want and we all have strengths and weaknesses that affect our paths for getting them. The most important quality that differentiates successful people from unsuccessful people is our capacity to learn and adapt to these things.

  • “How much do you let what you wish to be true stand in the way of seeing what is really true?”

  • People who overweigh the first-order consequences of their decisions and ignore the effects that the second- and subsequent-order consequences will have on their goals rarely reach their goals. For example, the first-order consequences of exercise (pain and time-sink) are commonly considered undesirable, while the second-order consequences (better health and more attractive appearance) are desirable

  • To achieve your goals, you have to prioritize, and that includes rejecting good alternatives.

  • Avoid setting goals based on what you think you can achieve.

  • “Most problems are potential improvements screaming at you”. The more painful the problem, the more it is screaming. To be successful, you need to perceive and then not tolerate problems. It is essential (and usually painful) to bring these problems to the surface.

  • To perceive problems, compare how the movie is unfolding relative to your script.

  • Ask yourself what is your biggest weakness that stands in the way of what you want.

  • (https://www.gwern.net/docs/iq/1996-jensen.pdf): Creativity comes from three sources of variance: (1) ideational fluency, or the capacity to tap a flow of relevant ideas, themes, or images, and to play with them, also known as “brainstorming”; (2) what Eysenck (1995) has termed the individuals’ relevance horizon; that is, the range or variety of elements, ideas, and associations that seem relevant to the problem (creativity involves wide relevance horizon); and (3) suspension of critical judgment. Creative persons are intellectually high risk takers.

  • On critical thinking: Learn to write, then write! https://www.youtube.com/watch?v=pY8MlNJrlug

  • Really Understand Bayes!

    clipboard.png

  • Get ‘unstuck’: Start with Problem Finding, then problem solving (design thinking). (https://www.npr.org/2017/01/03/507901716/how-silicon-valley-can-help-you-get-unstuck)

    • Tame problems (know what to solve)
    • Wicked problem (problems are highly dynamic, things are changing all the time). Wicked problems are great for design thinking – iterating multiple ideas with prototypes. You don’t have a map for solving the problem, you need to ‘way find’. He believes ’life design’ is a wicked problem. You may not have one destination. There is many right answers to the question of ‘what does your life look like’.
      • Build three different pictures of your next 5 years.
      • Create a set of prototypes around these three pictures.
      • Then pick one. People feel better about their choices once they’ve articulated the available set of options and then chosen the best.
      • ‘Design it as you go along’.
      • Design is orientated to action. Classify and ignore ‘gravity’ constraints (i.e. things you can’t do anything about). Accept gravity circumstances (they’re circumstances, not problems to solve) as fact.
      • Look honestly at your circumstances, then figure out what room you have to maneuver.
      • Fail early and often.
Notes from Principles:
  • Principles is an underrated book. Here are some notes from it:

  • Experience taught me how invaluable it is to reflect on and write down my decision-making criteria whenever I made a decision, so I got in the habit of doing that. With time, my collection of principles became like a collection of recipes for decision making.

  • “five steps”:

    • Set clear goals
    • Identify and don’t tolerate the problems that stand in the way of achieving those goals
    • Accurately diagnose these problems
    • Design plans that explicitly lay out tasks that will get around your problems and on to your goals
    • Implement these plans. Do the tasks.
  • Have clear goals. Prioritize. You can’t have everything you want.

  • Decide what you really want in life by reconciling your goals and your desires. What will ultimately fulfill you are things that feel right at both levels, both desires and goals.

  • Almost nothing can stop you from succeeding if you have a) flexibility and b) self-accountability. Flexibility is what allows you to accept what reality (or knowledgeable people) teaches you; self-accountability is really believing that failing to achieve a goal is your personal failure, you will see your failing to achieve it as indicative that you haven’t been creative or flexible or determined enough to do what it takes. And you will be much more motivated to find the way.

  • Problems

    • View painful problems as potential improvements that are screaming at you. Each and every problem you encounter is an opportunity; for that reason, it is essential that you bring them to the surface.
    • Be specific in identifying your problems: you need to be precise, because different problems have different solutions.
    • Don’t mistake a cause of a problem with the real problem.
    • Distinguish big problems from small ones. Then prioritize.
    • Once you identify a problem, don’t tolerate it.
  • Diagnosing problems:

    • Focus on the ‘what is’ before deciding ‘what to do about it’. Good diagnosis takes between 15 minutes and an hour depending on how well its done and its complexity. Gather evidence, determine root cause. Like principles, root causes manifest themselves over and over again in seemingly different situations. Finding them and dealing with them pays dividends again and again.
    • Distinguish proximate causes from root causes. Proximate causes are typically the actions (or lack of actions) that lead to problems, so they are described with vers (I missed the train because I didn’t check the train schedule) vs. (I didn’t check the train schedule because I’m forgetful). You can only truly solve your problems by removing their root causes and to do that, you must distinguish the symptoms from the disease.
    • Recognizing that knowing what someone is like will tell you what you can expect from them.
  • Plan:

    • Think about your problem as a set of outcomes produced by a machine. Practice higher level thinking by looking down on your machine and thinking about how it can be changed to produce better outcomes.
    • Remember that there are typically many paths to achieving your goals
    • Think of your plan as being like a movie script in that you visualize who will do what through time.
    • Write down your plan for everyone to see and to measure your progress against.
  • Push to completion:

    • Establish clear metrics to make certain that you are following your plan.
  • You will need to synthesize and shape well. The first three steps (setting goals, identifying problems, and diagnosing them) are synthesizing (by which I mean knowing where you want to go and what’s really going on). Designing solutions and making sure that the designs are implemented are shaping.

  • Everyone has at least one big thing that stands in the way of their success; find yours and deal with it. Write down what your one big thing is (such as identifying problems, designing solutions, pushing through to results) and why it exists (your emotions trip you up, you can’t visualize adequate possibilities). While you and most people probably have more than one major impediment, if you can remove or get around that one really big one, you will hugely improve your life.

  • The key to success lies in knowing how to both strive for a lot and fail well. By failing well, I mean being able to experience painful failures that provide big learnings without failing badly enough to get knocked out of the game.

  • “How do I know I’m right?”

  • Reflect on and write down your decision making criteria. With time your collection of principles will become a collection of recipes for decision making

  • Systematize your decision making. Encode them in rules, or programs.

  • When faced with the choice between two things you need that are seemingly at odds, go slowly to figure out how you can have as much of both as possible.

  • Shapers: all independent thinkers who do not let anything or anyone stand in the way of achieving their audacious goals. They have strong mental maps of how things should be done, and at the same time willingness to test those mental maps in the world of reality and change the ways they do things to make them work better. Able to see big picture and granular details (and levels in between) and synthesize the perspectives they gain at those different levels. Assertive, open minded, intolerant of people who work for them who aren’t excellent at what they do.

  • By knowing what someone is like we can have a pretty good idea of what we can expect from them.

  • Good habits come from thinking repeatedly in a principled way, like learning to speak a language. Good thinking comes from exploring the reasoning behind the principles.

  • Some people want to change the world and others want to operate in simple harmony with it and savor life. Neither is better. Each of us needs to decide what we value most and choose the paths we take to achieve it.

    clipboard.png

  • When trying to understand anything, economies, markets, the weather, whatever, one can approach the subject with two perspectives:

    • Top down: By trying to find the one code/law that drives them all. For example, in the case of markets, one could study universal laws like supply and demand that affect all economies and markets. In the case of species, one could focus on learning how the genetic code (DNA) works for all species.
    • Bottom up: By studying each specific case and the codes/laws that are true for them, for example the codes or laws particular to the market for wheat or the DNA sequences that make ducks different from other species.
  • Don’t get hung up on your views of how things ‘should’ be because you will miss out on learning how they really are. Whenever I observe something in nature that I (or mankind) think is wrong, I assume that “I’m wrong” and try and figure out what nature is doing makes sense.

  • Go to pain rather than avoid it: don’t let up on yourself and instead become comfortable always operating with some level of pain, you will evolve at a faster pace. Every time you confront something painful, you are at a potentially important juncture in your life – you have the opportunity to choose healthy and painful truth, or unhealthy but comfortable delusion.

  • No matter what you want in life, your ability to adapt and move quickly and efficiently through the process of personal evolution will determine your success and your happiness. If you do it well, you can change your psychological reaction to it so that what was painful can become something you crave.

  • Think of yourself as a machine operating within a machine and know that you have the ability to alter your machines to produce better outcomes.

    clipboard.png

  • By comparing your outcomes with your goals, you can determine how to modify your machine.

  • Distinguish between you as the designer of your machine and you as a worker with your machine. One of the hardest things for people to do is objectively look down on themselves within their circumstances (i.e. their machine) so that they can act as the machines designer and manager. To be successful, the designer/manager you has to be objective about the ‘worker you’ is really like, not believe in him more than he deserves or putting him in jobs he shouldn’t be in. Instead of having this strategic perspective, most people operate emotionally and in the moment; their lives are a series of undirected emotional experiences, going from one thing to the next. If you want to look back on your life and feel you’ve achieved what you wanted to, you can’t operate that way.

  • Successful people are those who can go above themselves to see things objectively and manage those things to shape change. They can take in the perspectives of others instead of being trapped in their own heads with their own biases.

  • When you encounter your weaknesses, you have four choices:

    • You can deny them (which is what most people do)
    • You can accept them and work at them in order to try and convert them into strengths (which might or might not work depending on your ability to change)
    • You can accept your weaknesses and find ways around them
    • Or, you can change what you’re going after.
  • Asking others who are strong in areas where you are weak to help you is a great skill that you should develop no matter what, as it will help you develop guardrails that will prevent you from doing what you shouldn’t be doing. All successful people are good at this.

Notes from Zero to One:
  • Zero to One is also a really underrated book. If you squint hard enough, it’s a book about psychology, philosophy and risk. Here are some notes:

  • Indefinite attidudes to the future explain what’s most dysfunctional in our world today. Process trumps substance: when people lack concrete plans to carry out, they use formal rules to assemble a portfolio of various options. [p61]

    clipboard.png

  • The indefiniteness of finance can be bizarre. Think about what happens when successful entrepreneurs sell their company. What do they do with the money? In a financialized world, it unfolds like this:

    • Founders give it to a large bank. Bankers don’t know what to do with it, they diversify by spreading it across a portfolio of institutional investors. Institutional investors don’t know what to do with it, they they diversify it across stocks. Companies try and increase their share price by generating free cash flows. If they do, they issue dividends or buy back shares and the cycle repeats. At no point does anyone in the chain know what to do with money in the real economy. In an indefinite world, people actually prefer unlimited optionality; money is more valuable than anything you could possibly do with it. Only in a definite future is money a means to an end, not the end itself. [p69]
  • Indefinite pessimism works because it’s self-fulfilling: if you’re a slacker with low expectations, they’ll probably be met. But indefinite optimism seems inherently unsustainable: how can the future get better if no one plans for it.

  • Remember our contrarian question: what important truth do very few people agree with you on? If we already understand as much of the natural world as we ever will then there are no good answers. Contrarian thinking doesn’t make any sense unless the world still has secrets left to give up:

    clipboard.png

  • Risk aversion: people are scared of secrets because they are scared of being wrong. By definition, a secret hasn’t been vetted by the mainstream. If your goal is to never make a mistake in your life, you shouldn’t look for secrets.

  • Secrets about people are relatively underappreciated. Maybe that’s because you don’t need a dozen years of higher education to ask the questions to uncover them: What are people not allowed to talk about? What is forbidden or taboo?

Assessing People, Situations, Decisions:

People:

  • Are they open minded or closed minded?
    • Open minded: more curious about why there is disagreement. Believe they can be wrong.
    • Closed minded: don’t want their ideas challenged. Frustrated when they can’t get the other person to agree with them instead of being curious about why the other person disagrees (this is somewhat in conflict with the emotional need of feeling heard). Block others from speaking.
    • Easiest diagnosis criteria: ratio of questions/listening to explanation.

Example of simple mental model to complex:

  • Performance review and compensation. What is your mental model, and what are the variables in it?
  • The most simple model:
    • The people that work for you have the same belief system about performance reviews and compensation as you do, and they act based on that.
    • And the most common belief for managers is this: I’m here for the mission, so compensation matters less; Performance reviews are designed to give me clear and actionable feedback so I can grow in my career and job.
    • Sometimes it’s “compensation doesn’t matter to me at all, and I’m suspicious of anyone for whom it does matter”.
  • Corporate Politics:
  • Thiel in this video [https://www.youtube.com/watch?time_continue=649&v=a9Ts4_65hKk] talks about ‘We’re in many bubbles’.
  • https://twitter.com/moskov/status/982287044880744448
  • Interesting response to “assume good intent”: https://thebias.com/2017/09/26/how-good-intent-undermines-diversity-and-inclusion/amp/
Resources: Advanced: Transactional Analysis
  • [Transactional Analysis is a pretty fringe part of psychology, but it’s probably worth a bit of time to study given it has systems for categorization and transitions of behaviors which can be useful mental models to port to different social contexts].

  • Observation of spontaneous social activity reveals that from time to time people show noticeable changes in posture, viewpoint, voice, vocabulary and other aspects of behavior. These behavioural changes are often accompanied by shifts in feeling. In an individual, a certain set of behaviors corresponds to one state of mind, while another set is related to a different psychic attitude, usually inconsistent with the first. These changes and differences give rise to the idea of ego states.

  • Ego states:

    • Parent: ego states which resemble the ego states of his parents “everyone carries his parents around inside him”. Parent comes in two forms: directly active (person responds as his own father or mother would) and indirect influence (responds the way they wanted him to respond)
    • Adult: ego state capable of objective data processing. Rational. Task of an adult is to regulate the activities of the Parent and the Child and to mediate objectively between them.
    • Child: ego states carried within a person which are fixated relics from earlier childhood years. Not ‘childish’. Child state can contribute to the individuals life: charm, pleasure, creativity, but if the child is confused and unhealthy, consequences may be unfortunate. Two forms: adaptive child (modifies his behavior under the Parental influence, behaves as they’d have wanted him to behave) and natural child (spontaneous expression: rebellion or creativity).
  • All three states have a high survival and living value. It’s only when one disturbs the healthy balance that analysis and reorganization are needed. Otherwise, each is entitled to equal respect and has its legitimate place in a full and productive life.

  • The first rule of communication is that communication will proceed smoothly as long as transactions are complementary; and its corollary is that as long as transactions are complementary, communication can, in principle, proceed indefinitely.

  • The converse rule is that communication is broken off when a crossed transaction occurs. The most common crossed transaction, and the one which causes the most social difficulties in the world (marriage, love friendship, work) is represented here:

    clipboard.png

    • “Maybe we should find out why you’ve been drinking more lately?”. An Adult->Adult transaction would be “Maybe we should. I’d certainly like to know!”. A crossed transaction will be “You’re always criticizing me, just like my father did” or “you blame me for everything!”. The vectors cross, and in order to make forward progress, the talk must be suspended until the vectors can be realigned.
  • More complex transaction types: ulterior transactions (those involving the activity of more than two ego states simultaneously – the basis for games. Two examples: Angular transactions (Salesman: “This one is better, but you can’t afford it”, Customer: “That’s the one I’ll take”).

    clipboard.png

    • Salesman’s Adult has an ulterior motive: stimulate the response from the child to get the outcome he wants.

    • Duplex ulterior transaction:

      clipboard.png

    • Social transaction taken literally (come see the barn), Child response.

https://example.org/blog/managing-managers-notes/
Hiring Mental Model

This is my mental model for hiring people into an established organization. TLDR: it’s about the courtship, how well the individuals career story fits with the opportunity, and overcoming uncertainty]

Philosophy and Principles
  • The goal is multivariate optimization: the multi-year experience of the person you’re trying to hire; the teams future experience with the addition of this person; and the company. Each has different goals and agendas, but all must be net-positive to proceed.
  • To hire or not is a decision weighed by the inputs above.
  • Hiring doesn’t stop at the signature. It’s your job to ensure the smoothest possible transition for the individual into the collective team. This is a many month process.
  • The act of hiring is about courtship. Invest about the same amount of energy into it, as you did when you courted a partner.
Assessment of Requirement

Before hiring anyone, you’ll need a view on:

  • What kinds of problem(s) is this team trying to solve? How complex are the problems? How certain are the solutions?
  • What is missing from the composition of the team that is preventing this team from solving these problems?
  • Does adding someone extra increase or decrease the velocity, strengths, and social capital of the team?
  • When this problem is solved, what expectation do you have of where this extra person will move next?
  • Assuming you can’t get all of what you want, what are you willing to compromise on? And how will you hedge against that compromise?

We care a lot about the composition of people, their personalities, skills, growth potential. An analogous real-world example would be managing a baseball team: individuals optimize for a particular position, and the general managers job is to figure out what composition of players will best likely achieve the outcome of winning a world series.

For software teams, positions are ill-defined (there’s no ‘first baseman’ classification for example), so composition is largely left to ‘feel’, but the kinds of skills you’d look for include:

  • Leadership: how able is the person to lead from the front when things get hard/uncertain
  • Social lubrication: how social/close is the team, and how able is this person to provide social lubrication
  • Technical capability: skills based, solved similar problems before
  • Predictor of the future: able to see multiple years in the future
  • Shit shoveller: there to learn, gain skills and grow. Willing to do less leveraged work
  • Server: able to collaborate and serve others (customers etc).
  • Naysayer: focused on exposing and hedging risk.
  • … and so on.
Team Strengths and Weaknesses

Teams can be thought of like individuals:

  • They have strengths and weaknesses
  • They have a dominant/default personality
  • They have a memory
  • They have wants and needs that are required to be satisfied

Often when you think about adding a new team member, you must also consider how you want this teams personality, strengths, etc, to evolve and grow to have the best chance of solving the problems they work on.

Adding a new person is a chance to nudge that evolution in a particular direction.

Team Social Capital

Assess your teams social capital (i.e. the measure of influence, gravitas, previous impact, goodwill, etc). Understand what social capital may be needed to solve the problem. Ensure that the individual you are hiring has the maximum impact on that measure.

As an example: a large new language project at a FAANG I worked at (a gradual type checker, that required all code be migrated to a new format) required a team with significant social capital so that partnerships with teams to do migrations had a higher level of ‘default trust’ - (i.e “that team is great, full of rockstars, happy to work with them”).

Build a strong relationship with your recruiting partners

A symbiotic relationship with your recruiter is necessary to pull off all the steps below. They have a deeper level of experience, can often provide ‘wing-person’ type views on how things are going, can be a neutral sounding board for the candidate, and will often perform a lot of the actions below.

Generating the Pipeline of Candidates

This mental model will focus on the hardest hiring job, which is finding and landing rare candidates who are in high demand. This requires a higher touch courtship.

Finding these people is generally easy:

  • Ask existing team members
  • Ask your existing network
  • Trawl LinkedIn
  • Find papers written in the domain, look at the Authors
  • Find references within those papers, look at those authors.
  • Trawl the authors LinkedIn network
  • Look at Github projects within that domain, find contributor names.
  • Look at previous conferences in the domain, generate list of speaker names.

Most other competent recruiters and engineering managers are doing the same thing, so here’s a few alternative strategies:

  • Find non-English speaking people on your teams and ask them to do the same thing above in their native language/country.
  • Find analogous industries where similar first principle skills apply and can be transferred (i.e. Physics -> Machine Learning, Finance -> Data Science etc). Perform procedure above.

Ensure pipeline is primed with diversity, given it’s an underlying team composition optimization.

Courtship

For-each candidate generated above:

  • Assess best engagement strategy:
    • E-mail reach out (poor)
    • Bump into person at conference (better)
    • Find mutual connection, ask for introduction
    • Find mutual connection, ask them to engage in the hiring process
    • Find problem that leads to mutual engagement (perhaps collaborating with them on their current project/problem)
    • Offer status/social capital engagement: speaking slot at conference, committee seat, consulting engagement
    • Offer “too good to refuse” social engagement: data center tour, meet and greet with high-status individuals who work at your company.

The goals for the early phase of the engagement is multi-fold:

  • Understand where they’re at with their current position/career. Important to assess timing of engagement.
  • Understand what they care about, what they’re optimizing for in their careers/life.
  • Discovering the ‘hidden variables’ in what they care about. Maybe they really love their manager, or they secretly hate your company. Variables that aren’t typically talked about in general conversation.
  • Once ready, move them into ‘curious’ mode. Curious about you, curious about the team, curious about the company.
Anti-Patterns for engagement:
  • Getting the timing wrong. Pushing too hard too early will likely force the candidate to disengage early to end any obligation they feel to respond.
  • Not deeply understanding what the candidate is likely optimizing for. Not enough time spent listening.
  • Missing a key hidden variable: perhaps the key decision maker in deciding to interview/sign the offer is the candidates partner/family, rather than the candidate themselves.
  • Being seen as overly optimizing for your own agenda/outcome.
  • Not building enough trust and rapport.
  • Overestimating your own social capital (i.e. an M1 trying to hire a Director).
Exploration

We need to transition curiosity into exploration. i.e. the candidate investing energy into exploring what might be possible — an alternative simulation of the next few years of their life and career.

Assuming you’ve listened carefully to what the candidate wants, you want to balance and emphasize a few things during this phase:

  • Help them explore but don’t overwhelm.
  • Give options for exploration (different roles, different teams), but not too many. Offer exploratory chats with other leaders (ensure high social capital engagement).
  • Try and position your role as “neutral shepherd”- you have a bias to land them in your team, but want what’s best for them and their family.
  • Hand hold the candidate through the exploration
  • Emphasize your own simulation of their story for a given role/team option.
  • Help them build a rich simulation for themselves of how their story will look for a given option. This requires a lot of Socratic method to draw out what they care about and what their current unmet needs are in their current role, and how these needs will be met with this option.
  • Be consistent, clear and present. Respond quickly, explain all the details.

The goal of exploration is to overcome the activation energy required to prepare for, and perform an interview. That’s it. Period. Activation energy might include overcoming fear that they’ll fail, in which case you might need to work through those issues with them too.

Anti-patterns for Exploration:
  • Overly focusing on things that do not include the candidate as part of the narrative: i.e. “we need to solve big problem X for the company”, instead of saying “we have an open role in team Y that will contribute skills Z to the team to help them solve problem X which will lead to result A. Given what we’ve talked about, I think you might do great things because of A, B, C. There’s plenty of growth opportunities in that role too, which we can talk about if you like”.
  • Remember, it’s all about the candidates story not yours.
  • If you can’t answer the question: “why would this candidate want to join this team?” then you haven’t done enough homework in Courtship.
Interview Preperation

Make sure the candidate fucking prepares. Do what you can to give them the best simulation of what the interview will be like, and what’s required of them.

Offer Stage

This is the most difficult part of the process, because there are so many hidden variables, and likely many things out of your control (compensation etc). The goal here is being an invisible hand of persuation.

The goals are as follows:

  • Figure out, or infer, as many hidden variables as possible, and neutralize them.
  • Get the candidate to be focused on things that matter in their decision making, and to ignore things that don’t matter.
  • Increase their certainty in their simulation of working here, and working with you/your team
  • Tie and reinforce that simulation to the things they personally care about.
  • Help the candidate overcome the ‘hard parts’ about changing direction in life:
    • difficult conversations with current management chains
    • obligations to existing commitments/team mates
    • uncertainty about the alternative simulation you offer
    • feelings about personal identity (i.e. my loyalty to current company, “I’ve always been a Googler”)

Almost always, declines in our offers are directly related to things above. We often don’t know what the hidden variables or thoughts and feelings that the candidate was using to make their decisions. Or said another way: these decisions are usually ’emotionally based’.

Occasionally, the signals can even be conflicting. For example, a candidate might say “I’m really interested in this role because it’s risky, and I’m keen to work on riskier things”. It’s likely the candidate knows that their risk aversion isn’t helping their career and they should change that behavior, but when it comes to crunch time, they fall back into previous behaviors. It’s your job to help the candidate keep an ’eye on the prize’ and help them overcome their own inherent flaws/biases.

All of this requires a deep level of trust, rapport and high tough engagement. Often if the candidate accepts, it’s because they believe and trust your simulation of their future.

Anti-Patterns for the Offer Stage

When a candidate informs their current management chain of their thoughts on accepting, there will be an aggressive counter, and a focus on the reasons why the candidate shouldn’t accept the offer: “It’s too risky; the company isn’t going anywhere; you can get what you want here; etc. One anti-pattern is to reject this criticism outright and tell the candidate that their management chain is biased or whatever. Resist the urge to do this. Instead, in a neutral and rational way, assess the criticism on it’s merit with the candidate — be open that there might be something there and help the candidate reflect on that with respect to the things they care about.

  • Pushing too hard or too fast.
  • Relying on obligation of the offer to persuade the candidate to accept.
  • Pushing/pointing out factors that aren’t huge influencing factors in the candidates decision making “look, our offer is far better on comp!”
  • Using “big wigs” as social capital based influencers “I’ll have you meet with our VP!”. They often might not care about your VP, and see it as more pressure and obligation to accept.
  • Disregarding the other people in the decision: partners, kids, location, time away from home, whatever.
Common Reasons Why People Don’t Accept

The abstract dimensions of reasons why people accept are:

  • Success / Growth potential
  • Safety
  • Prestige / Ego / Status
  • Rational
  • Purpose driven

The reasons I’ve seen why people don’t accept:

  • Too many senior people (safety)
  • Pitch on role describes too much responsibility (fear of failure, impostor syndrome)
  • Can’t learn/grow, can’t get promoted fast enough
  • Local manager vs. remote (safety)
  • Team vibe (prestige, safety)
  • Team social capital (prestige)
  • Don’t know how to contribute (success, safety)
  • Lack of interest/passion for the problem/space
  • Uncertainty
Hand Holding After Offer Accept

Do the following after offer acceptance:

  • Have everyone on the interview loop send a small note saying thanks for interviewing, really happy that you’re joining etc.
  • Have your own manager reach out, congratulate, and offer to have a conversation anytime they like between now and when they start.
  • Send your own e-mail congratulating them, and offering to check-in/stay in touch as much as they prefer.

The job is not done until they pick up their badge. Do not underestimate the power of others to influence and reverse the candidates decision. The biggest anti-pattern I’ve seen is that we go “radio silent” on the candidate after the signature is sealed. This gives confusing and conflicting signal to the candidate, making them more open to decision change.

Landing and Integration into the Team

Remember, this is a multivariate optimization: the company, the candidate, the team. Your job now is to smooth the way for social integration of the individual with the team. Focus on the following:

  • Communication with the team members. Early and often. When the candidate accepts, send a note to all team members describing who the person is, where they’ll fit in, what you think they may work on. You’re giving a general and flexible simulation of the teams future with this individual in it.
  • Signal your excitement.
  • Write down a list of potential team members that might consider this disruptive to their own goals/career agenda. For-each of these people:
  • Have a 1:1 with them, listen and understand their thoughts and feelings about this new person joining.
  • Ensure they have a correct simulation, and help them feel settled about the decision.
  • Identify any emotional reactions you might not be seeing. Address them.
  • Do the above often, the more regular the reinforcement, the easier the transition will be when the candidate arrives.
  • Find an IC to be responsible for landing/ramp up within the local team. They should be responsible for measuring the social integration of the individual also.
Landing and Integration into the Company

Your job is to build a plan to have the candidate get gradual and learned exposure to the company culture, it’s rules, it’s principles etc. You are responsible for the adjustment of the individuals behaviors to better ‘fit’ with the company at large.

You’re also responsible for helping the candidate build their own social capital. For this, you’ll need to spend some of your own. When the candidate lands:

  • Send a list of ‘people you should meet with’ for general social introductions. These are usually outside their direct team.
  • Send each of those people a personal e-mail asking them to spend time with them, and what to focus on.
  • Follow up with these people to see if there are any red-flags.

Build a timeline view for the candidate on what you expect and when. Make this super clear.

Meet regularly. Check in regularly. Ensure social capital is being built, and team integration is going well. Adjust if not.

Retrospective

Once the candidate has landed and has integrated. Have a conversation about how the hiring went from their perspective. Your goal is simple: validate the assumptions you had, the hidden variables you predicted, and the optimizations you believed the candidate was making at the time.

This will help you improve your predictive power for next time.

Hiring is done at this point. Manage them well.

https://example.org/blog/hiring/
Communication Techniques for Mutual Understanding

I was watching “The half of it” on Netflix over the weekend (a lighthearted comedy-drama written by an ex-Microsoft software engineer-turned-writer, Alice Wu) and a scene in the movie just happened to succinctly summarize a common problem I see almost daily at work. The smart loner Ellie, is trying to coach popular-jock Paul, on the art of conversation so that Paul can charm his high school love interest:

conversation.gif

In a subsequent ping-pong scene, Ellie says to Paul “match energy, match strokes, and just say one thing”, which is an apt sporting metaphor for the basic skill of communicating with another.

In this note, I’m going to try and cover interesting things I know about improving communication between people to achieve mutual understanding. I borrow heavily from the techniques of analysis from an unpopular branch of psychology from the 50’s called “Transactional Analysis”. The philosophy of Transactional Analysis isn’t all that relevant (and largely outdated) but its methods of analyzing the back-and-forward between people (called ‘strokes’, just like the ping-pong metaphor) that are highly relevant to achieve mutual understanding.

I will try and cover:

  • Techniques for analyzing and measuring the “strokes” we’re using while communicating with others - the energy, tone, emotion, focus, and agenda.
  • Analyze and measure the strokes of those we’re communicating with (our partners).
  • Understand, predict, react, and respond to the stroke differences between us and our partners to achieve the best communication outcome: mutual understanding.

If you’ve walked out of a 1:1, or a group meeting before with a feeling of “I didn’t feel heard”, or “I have no idea where we landed with X”, or “I don’t know why Joe and Jane didn’t get on the same page”, then this note might help you analyze and answer the question of why.

Let’s start with techniques for measuring and analyzing strokes.

Measuring and Analyzing Strokes

When I’m having an important conversation with anyone, I have a mental ‘background thread’ running in my brain trying to measure and categorize what I say, and what my partner is saying over time. That background thread is either asking questions of myself, or categorizing the strokes we’re playing in real time, like:

  • What is my agenda right now and why do I have that agenda?
  • What is my prediction of my partners agenda or unmet needs?
  • What (if any) emotions am I feeling?
  • What is my prediction of my partners emotions?
  • What is the body language of my partner saying?
  • Is there a power imbalance between us?
  • Is my partner feeling heard and understood?
  • Is there sufficient psychological safety?
  • Am I deceiving, or being deceived?
  • What does the tone, emotion or focus of what I’m saying need to be to satisy my partners unmet needs?

Answering these questions in your head generates the data necessary to pursue the ultimate question:

  • Have we’ve achieved mutual understanding? And if not, why not?

It may seem like an overwhelming list, but after lots of practice (and applying some measurement tricks) it becomes automatic. One example of a excellent measurement to answer the question of “is my partner feeling heard and understood” is to count how many times they say “Yes, but…”. The higher the count, the higher the probability they don’t feel heard. Another simple trick to address my partner feeling heard: try and measure the ratio of time that they’re speaking vs. you – the balance might need to be different depending on the kind of conversation, but a good general rule is to err on the side of listening more than talking.

Answering these questions helps categorize what kind of “strokes” are currently being played, and if they’re the right ones to achieve mutual understanding.

Let’s look at some of these question categories in more detail:

What’s Your Agenda? What’s Mine?

When starting communication for something important, it’s likely you and your partner have a pre-existing agenda, and often, they’re different. It’s important to know what those agenda’s are, and how their existence and their differences might get in the way of mutual understanding. In relationship therapy (the romantic kind), they say “an agenda is like an invisible wall between you and your partner” and it’s the most common category of mis-stroke that gets in the way of mutual understanding.

Agenda mis-strokes might look something like the following, a simple conversation between team mates:

  • Player A: “I don’t feel like my career is progressing as fast as it should.”
  • Player B: “Have you thought about focusing on skills for the next level?”
  • A: “Yes, but I don’t really have enough time”
  • B: “Why don’t you clear some time in your calendar for learning?”
  • A: “Yes, but then it might mean I don’t get enough work delivered.”
  • B: “You should talk with your manager about expectations”
  • A: “Yes, but I’m worried my manager will react poorly.”
  • Awkward silence, frustration.

This is trivialized example but it will get us started on analysis of strokes. What do you predict is the agenda of Player A? What about Player B? Had B accurately predicted A’s agenda, what might have she done differently? Had you been given one line of A’s dialog, I’d first assess the agenda as “A wants some help/coaching for their career issues”. By the second or third A response, I may re-categorize A’s agenda as “blow off some steam and frustration”. B started with “I’m going to help”, and never course corrected. A didn’t get what they really wanted, which was a friendly ear for a bit of venting. “Yes, but” counting would have generated a signal to reassess, and most importantly, change strokes.

The important learning here is how to do the analysis and not the particular example. When you’re starting out analyzing strokes, it’s best to analyze post-hoc conversation: just think back to the back-and-forward, and reflect on the questions above. Upon reflection, was there an opportunity to change your strokes for a better outcome of mutual understanding? Once you’re practiced enough at post-hoc analysis, you’ll be able to move these questions to the background thread of your mind, while you’re in the moment.

Let’s look at some others:

Power Imbalance

It’s rare for two people involved in a conversation to hold equal power, as differences in power are influenced by a large range of things: structural (manager, subordinate), gender, age, experience, knowledge and so on. Unaddressed, this imbalance significantly decreases the probability of mutual understanding, as those with power tend to more easily pursue their own agenda without objection, and those without power tend to become more restrained, silent, perhaps subservient. Analysis of strokes between players tends to reflect that dynamic over time. In the workplace (and particularly within dysfunctional teams), this can look like collective ‘yes-men’, where critics of the work tend to self-silence, and objective data will be looked at through a lens favorable to the agenda of those in power.

For those with more power: ensure that you see active strokes of disagreement and debate, alternative view-points, free expression of thought. Express vulnerability as a tool to ’re-balance power’. For those with less power: catch the emotional reaction of “holding back” during conversation. For both players in group settings: observe the rest of the players, find the silent, and encourage and promote their voices.

Emotional Strokes

This topic deserves its own detailed note as it’s complex, and can have the most negative impact if not handled well. In lieu of that, here are three examples of emotionally driven strokes to think about:

  1. Destructive: stonewalling, contempt, criticism, defensiveness. From any player.
  2. Your own emotional reaction influencing your partners strokes
  3. The emotional reaction that your partner is having, but not visibly sharing.

All three have a high probability of getting in the way of the core goal of mutual understanding, but (1) in particular, has almost zero chance of achieving the goal. Here’s an example set of transactions between a manager (A), and a report (B) who manages a several teams, but one in question we’ll call ‘Team X’:

  • A: “I have been observing one of your teams ‘Team X’, and I’ve formed a weak view that they’re not really delivering what they said they would. What’s going on here?
  • B: Exasperated “Oh what? Team ‘X’ is amazing, they’ve been working hard on delivering FizBuzz widget, Acme product and all sorts of other things. I will set up a review with them and you immediately. The picture you have is completely inaccurate.”
  • A: “Oh, sorry-sorry – I’m sure they’re amazing, but I want us to talk through their results to get a better read of the situation.”
  • B: Still exasperated “I’m sure it’s that they’re just not communicating their achievements well enough. You meeting with them will solve that problem”.
  • A: Annoyed “Yes, but …”

Both players in this set of interactions play flawed strokes: ‘B’ reacts emotionally, playing defensive and slightly contemptuous strokes. ‘A’ plays two flawed strokes, (1) the opening, being a closed form question which may be interpreted as criticism of the manager or their team, and (2) reacting with annoyance that the intent of the original stroke was misunderstood.

Both players could have pivoted early to increase the odds of mutual understanding. ‘B’, instead of defensively countering, could have asked an open-formed, curiosity seeking question like: “Oh interesting. I’d like to learn more about the signals you’re seeing, and your general impressions of the team”. ‘A’, when seeing ‘B’s strong defensive reaction, could have gone two ways: (a) change focus to the ‘meta’ of the defensiveness, trying to understand why they got exasperated/defensive, or (b) addressed the misplayed opening stroke which caused the defensiveness in the first place.

Emotional reactions tend to be re-occurring patterns for individuals. It helped me to sit down and think about my own patterns of emotional reaction: I don’t respond well to individual criticism; get extremely upset at perceived violations of trust; get overly-righteous at situations of injustice, etc. And often, my reactions in these situations can look like TM ‘B’ above: aggressive, defensive, contemptuous. I’ve learnt techniques to capture these emotional reactions before they escape my mouth, improving the odds of playing better strokes for more productive outcomes.

Safety

I always say “trust is safety” or “replace the word trust with safety”, as I think that safety among peers and partners more clearly represents what is required to have an effective partnership and to increase odds of mutual understanding. It’s also a useful word to generate requirements for effective transactions between people:

Not safe:

  • Treading cautiously, focused on ‘saying the right thing’.
  • Worried about reaction
  • Closed off, hiding
  • Fearful
  • Unable to predict reaction
  • Unable to predict flow of interactions

Safe: essentially being the opposite of the above. And I’d put special emphasis on ‘prediction’. The better someone is able to predict you, the more likely they’re going to feel safe with you. Without safety, anything of significant meaning or anything “high stakes”, has minimal chance of achieving mutual understanding.

It therefore follows: improving safety is about increasing predictability between players, increasing neutral and positive interactions, increasing shared realities/mutual understanding.

Accurate Prediction is Everything

Remember the desired goal here: to understand, predict, react and respond appropriately to strokes between you and your partner in a way that improves the odds of mutual understanding. To sort of ‘get in a flow state’ between players, where both players feel safe enough to play their full, unabridged, most impactful strokes.

What is required for this:

  • accurate assessment of your own reactionary strokes (emotional in particular), and pivoting where necessary
  • accurate prediction of reactions to, and interpretations of, strokes (for both you and your partner)
  • understanding of how the environment influences strokes (power imbalances, agendas, politics), and adjusting your strokes as necessary

A perfect interaction would be playing “perfect strokes to your partner, and them back to you”. But as mentioned, strokes are predictive and based on models that you and your partner build of each other over time - models are probabilistic, which is why we talk about ‘improving odds’, not ‘achieving perfection’. This also implies that we need to help our partners build a better model of us, so as mentioned in ‘safety’, we should add:

  • enable our partners to improve their predictive models of our strokes, by being consistent, predictable.
  • enable our partners to feel that we’re open, transparent, safe, and adaptable when stroke differences occur.

The more transparent and predictable you are, the safer people feel. This improves odds of people you work with raising hard issues, pushing for more diversity of thought, and giving you feedback early.

Getting Started

It’s a long note, so I’ll summarize the recipe:

  • Measure your own strokes
  • Measure your partners strokes
  • Analyze (either in the moment, or post hoc) those measurements
  • Adjust strokes to improve odds of mutual understanding

It’s difficult to do this in real-time to begin with, so I’ll offer a simple way to get started: recruit an observer. In this period of VC only, it offers opportunities for others to watch strokes in real-time for you, and give you feedback on your interactions with others. Think about how you think the conversation went, then ask your observer for their observations, see how well they match.

In 1:1 settings, try keeping a pen and paper handy so you can jot down quick notes on the flow of conversation for post-hoc meeting analysis.

Doing this repeatedly will force your brain to upload the measurement and analysis into your ‘muscle memory’, for real-time use.

TLDR:
  • Mutual Understanding is hard, but better communication techniques can improve the odds of achieving it.
  • Measure and analyze your conversations
  • Understand common ‘conversational blockers’ like safety, agenda, power imbalance
https://example.org/blog/communication-techniques-for-mutual-understanding/
Write down your how

Regularly writing down both what I’m thinking and how I think about things has been the highest impact career tool I’ve learned to date (it’s up there with learning Vim). It helps me get ‘unstuck’ when I’m uncertain, understand my reactions to events, and teach and grow my colleagues. The what and how parts are distinctive, with how being the most important. I’ll explain this distinction using a common example of where I, and the folks I work with, get stuck: making a decision about something important. I’ll then explain why writing down how you think, and then deconstructing and improving that, is the key to rapid personal development.

The “What”

Okay, so let’s talk about decision making as an example. Long ago, before I was enlightened, this is how I made decisions:

  1. Think hard about the decision in my own head.
  2. Constantly flip-flop over the decision choices.
  3. Ask someone for their opinion.
  4. Unconfidently make a choice.

Spending time deliberating this in my own head meant that I was limited to the memory capacity of my brain, constantly paging in and out options to evaluate. For complex decisions, this felt tiring, and inefficient. So I moved to lists, and a more structured way of ‘weighing up’ options (which really just looked like making odds on a horse race, and gambling on the option which gave me the best risk adjusted return):

This was better. I’m breaking down the decision making process into smaller chunks: list out the options and, for any given option, simulate the future, calculate the risks, etc. It felt easier, and the process seems more quantifiable, and perhaps even more rational. It was also significantly easier to communicate with others the current ‘state’ of the decision making process so that they could help.

This process is the writing down of my what for a given decision. And writing down the what is often where most people stop, having tasted the pure satisfaction of getting things out of their head, breaking them down, and putting them on paper.

The “How”

Taking on bigger career challenges meant significantly more complex decisions, and I started getting stuck more often. Based on the advice of smart people who deal with lots of complexity, I started focusing on how I make decisions: writing down, deconstructing, and analyzing my how, which was vastly higher leverage and far more satisfying. This satisfaction comes in several ways, because once you’ve written down how you think, you can:

  • Look at your how objectively and identify gaps
  • Identify the steps where your brain can fool you (bias!)
  • Share your how with others
  • Improve it!

Sharing your how with people has two really awesome benefits: 1) they can give you feedback, and 2) it gives your colleagues the ability to anticipate and predict the what that the how generates.

When I write down the how for a given area, I follow a standard template:

  • Philosophy and Principles
  • The Model
  • Test Cases
  • Resources I used

This is best demonstrated with an example. Here’s a link to my Decision Making Mental Model[1], which describes how I think about making and executing decisions (single page version is here). The Philosophy and Principles section frames the how with context. The Model section is a step-by-step process, with extra reference details for things I often forget (like in this case, “how to measure uncertainty”). Test Cases are written down accounts of the how in real life action (usually the more crazy cases) – I use these to mentally test incremental improvements I make. The Resources section is all the books and papers I’ve consumed that influenced my how.

If you’ve read that completely, it should be obvious the monstrous gaps between deliberating in your head, to creating lists with probabilities, to the process outlined in my how. I’d now argue the most important parts to decision making are:

  • “am I being fooled?“
  • communication
  • checkpointing
  • postmortem

These are parts of the process that I barely even thought about before I embarked on improving my how. It’s a significant up-leveling.

Incorporating the “how”

You might be thinking “shit, this looks like a lot of work, it’s probably not worth it”. Before you throw in the towel, do the following: identify an area where you feel uncertain about something, write down that topic, then write down how you currently think about it. Here are examples if you’re struggling to bootstrap:

  • Leadership
  • Holding people accountable
  • Building an effective plan for you or your team
  • Resolving conflict

Then write down how you think about that as a simple bullet point list. If you struggle a little, and think it’s a bit incomplete, then hopefully you’re self motivated to keep on writing, thinking, reading, sharing, and improving your how.

Once I have something that feels rigid and complete, I refer to and follow it constantly. I use it to generate my what, and I write down the results of that too – it’s a written record of my how in action, which I can review over time to continuously improve. I have hundreds of pages of hows, and loads of spreadsheets that track their output, and I’ve been incrementally improving them for years.

If you write down and improve your how, you get a significantly better what for free.

https://example.org/blog/write-down-your-how/