By Akshay Sarma, Principal Engineer, Verizon Media & Brian Xiao, Software Engineer, Verizon Media
This is the first of an ongoing series of blog posts sharing releases and announcements for Bullet, an open-sourced lightweight, scalable, pluggable, multi-tenant query system.
Bullet allows you to query any data flowing through a streaming system without having to store it first through its UI or API. The queries are injected into the running system and have minimal overhead. Running hundreds of queries generally fit into the overhead of just reading the streaming data. Bullet requires running an instance of its backend on your data. This backend runs on common stream processing frameworks (Storm and Spark Streaming currently supported).
The data on which Bullet sits determines what it is used for. For example, our team runs an instance of Bullet on user engagement data (~1M events/sec) to let developers find their own events to validate their code that produces this data. We also use this instance to interactively explore data, throw up quick dashboards to monitor live releases, count unique users, debug issues, and more.
Since open sourcing Bullet in 2017, we’ve been hard at work adding many new features! We’ll highlight some of these here and continue sharing update posts for future releases.
Windowing
Bullet used to operate in a request-response fashion - you would submit a query and wait for the query to meet its termination conditions (usually duration) before receiving results. For short-lived queries, say, a few seconds, this was fine. But as we started fielding more interactive and iterative queries, waiting even a minute for results became too cumbersome.
Enter windowing! Bullet now supports time and record-based windowing. With time windowing, you can break up your query into chunks of time over its duration and retrieve results for each chunk. For example, you can calculate the average of a field, and stream back results every second:
In the above example, the aggregation is operating on all the data since the beginning of the query, but you can also do aggregations on just the windows themselves. This is often called a Tumbling window:
With record windowing, you can get the intermediate aggregation for each record that matches your query (a Sliding window). Or you can do a Tumbling window on records rather than time. For example, you could get results back every three records:
Overlapping windows in other ways (Hopping windows) or windows that reset based on different criteria (Session windows, Cascading windows) are currently being worked on. Stay tuned!
Apache Pulsar support as a native PubSub
Bullet uses a PubSub (publish-subscribe) message queue to send queries and results between the Web Service and Backend. As with everything else in Bullet, the PubSub is pluggable. You can use your favorite pubsub by implementing a few interfaces if you don’t want to use the ones we provide. Until now, we’ve maintained and supported a REST-based PubSub and an Apache Kafka PubSub. Now we are excited to announce supporting Apache Pulsar as well! Bullet Pulsar will be useful to those users who want to use Pulsar as their underlying messaging service.
If you aren’t familiar with Pulsar, setting up a local standalone is very simple, and by default, any Pulsar topics written to will automatically be created. Setting up an instance of Bullet with Pulsar instead of REST or Kafka is just as easy. You can refer to our documentation for more details.
Plug your data into Bullet without code
While Bullet worked on any data source located in any persistence layer, you still had to implement an interface to connect your data source to the Backend and convert it into a record container format that Bullet understands. For instance, your data might be located in Kafka and be in the Avro format. If you were using Bullet on Storm, you would perhaps write a Storm Spout to read from Kafka, deserialize, and convert the Avro data into the Bullet record format. This was the only interface in Bullet that required our customers to write their own code. Not anymore! Bullet DSL is a text/configuration-based format for users to plug in their data to the Bullet Backend without having to write a single line of code.
Bullet DSL abstracts away the two major components for plugging data into the Bullet Backend. A Connector piece to read from arbitrary data-sources and a Converter piece to convert that read data into the Bullet record container. We currently support and maintain a few of these - Kafka and Pulsar for Connectors and Avro, Maps and arbitrary Java POJOs for Converters. The Converters understand typed data and can even do a bit of minor ETL (Extract, Transform and Load) if you need to change your data around before feeding it into Bullet. As always, the DSL components are pluggable and you can write your own (and contribute it back!) if you need one that we don’t support.
We appreciate your feedback and contributions! Explore Bullet on GitHub, use and help contribute to the project, and chat with us on Google Groups. To get started, try our Quickstarts on Spark or Storm to set up an instance of Bullet on some fake data and play around with it.
OpenTSDB is one of the first dedicated open source time series databases built on top of Apache HBase and the Hadoop Distributed File System. Today, we are proud to share that version 2.4.0 is now available and has many new features developed in-house and with contributions from the open source community. This release would not have been possible without support from our monitoring team, the Hadoop and HBase developers, as well as contributors from other companies like Salesforce, Alibaba, JD.com, Arista and more. Thank you to everyone who contributed to this release!
A few of the exciting new features include:
Rollup and Pre-Aggregation Storage
As time series data grows, storing the original measurements becomes expensive. Particularly in the case of monitoring workflows, users rarely care about last years’ high fidelity data. It’s more efficient to store lower resolution “rollups” for longer periods, discarding the original high-resolution data. OpenTSDB now supports storing and querying such data so that the raw data can expire from HBase or Bigtable, and the rollups can stick around longer. Querying for long time ranges will read from the lower resolution data, fetching fewer data points and speeding up queries.
Likewise, when a user wants to query tens of thousands of time series grouped by, for example, data centers, the TSD will have to fetch and process a significant amount of data, making queries painfully slow. To improve query speed, pre-aggregated data can be stored and queried to fetch much less data at query time, while still retaining the raw data. We have an Apache Storm pipeline that computes these rollups and pre-aggregates, and we intend to open source that code in 2019. For more details, please visit http://opentsdb.net/docs/build/html/user_guide/rollups.html.
Histograms and Sketches
When monitoring or performing data analysis, users often like to explore percentiles of their measurements, such as the 99.9th percentile of website request latency to detect issues and determine what consumers are experiencing. Popular metrics collection libraries will happily report percentiles for the data they collect. Yet while querying for the original percentile data for a single time series is useful, trying to query and combine the data from multiple series is mathematically incorrect, leading to errant observations and problems. For example, if you want the 99.9th percentile of latency in a particular region, you can’t just sum or recompute the 99.9th of the 99.9th percentile.
To solve this issue, we needed a complex data structure that can be combined to calculate an accurate percentile. One such structure that has existed for a long time is the bucketed histogram, where measurements are sliced into value ranges and each range maintains a count of measurements that fall into that bucket. These buckets can be sized based on the required accuracy and the counts from multiple sources (sharing the same bucket ranges) combined to compute an accurate percentile.
Bucketed histograms can be expensive to store for highly accurate data, as many buckets and counts are required. Additionally, many measurements don’t have to be perfectly accurate but they should be precise. Thus another class of algorithms could be used to approximate the data via sampling and provide highly precise data with a fixed interval. Data scientists at Yahoo (now part of Oath) implemented a great Java library called Data Sketches that implements the Stochastic Streaming Algorithms to reduce the amount of data stored for high-throughput services. Sketches have been a huge help for the OLAP storage system Druid (also sponsored by Oath) and Bullet, Oath’s open source real-time data query engine.
The latest TSDB version supports bucketed histograms, Data Sketches, and T-Digests.
Some additional features include:
HBase Date Tiered Compaction support to improve storage efficiency.
A new authentication plugin interface to support enterprise use cases.
An interface to support fetching data directly from Bigtable or HBase rows using a search index such as ElasticSearch. This improves queries for small subsets of high cardinality data and we’re working on open sourcing our code for the ES schema.
Greater UID cache controls and an optional LRU implementation to reduce the amount of JVM heap allocated to UID to string mappings.
Configurable query size and time limits to avoid OOMing a JVM with large queries.
Try the releases on GitHub and let us know of any issues you run into by posting on GitHub issues or the OpenTSDB Forum. Your feedback is appreciated!
OpenTSDB 3.0
Additionally, we’ve started on 3.0, which is a rewrite that will support a slew of new features including:
Querying and analyzing data from the plethora of new time series stores.
A fully configurable query graph that allows for complex queries OpenTSDB 1x and 2x couldn’t support.
Streaming results to improve the user experience and avoid overwhelming a single query node.
Advanced analytics including support for time series forecasting with Yahoo’s EGADs library.
Please join us in testing out the current 3.0 code, reporting bugs, and adding features.
Today we’re kicking off a blog post series of need-to-know updates on Vespa, summarizing the features and fixes detailed in Github issues.
We welcome your contributions and feedback about any new features or improvements you’d like to see.
For December, we’re excited to share the following product news:
Streaming Search Performance Improvement
Streaming Search is a solution for applications where each query only searches a small, statically determined subset of the corpus. In this case, Vespa searches without building reverse indexes, reducing storage cost and making writes more efficient. With the latest changes, the document type is used to further limit data scanning, resulting in lower latencies and higher throughput. Read more here.
ONNX Integration
ONNX is an open ecosystem for interchangeable AI models. Vespa now supports importing models in the ONNX format and transforming the models into Tensors for use in ranking. This adds to the TensorFlow import included earlier this year and allows Vespa to support many training tools. While Vespa’s strength is real-time model evaluation over large datasets, to get started using single data points, try the stateless model evaluation API. Explore this integration more in Ranking with ONNX models.
Precise Transaction Log Pruning
Vespa is built for large applications running continuous integration and deployment. This means nodes restart often for software upgrades, and node restart time matters. A common pattern is serving while restarting hosts one by one. Vespa has optimized transaction log pruning with prepareRestart, due to flushing as much as possible before stopping, which is quicker than replaying the same data after restarting. This feature is on by default. Learn more in live upgrade and prepareRestart.
Grouping on Maps
Grouping is used to implement faceting. Vespa has added support to group using map attribute fields, creating a group for values whose keys match the specified key, or field values referenced by the key. This support is useful to create indirections and relations in data and is great for use cases with structured data like e-commerce. Leverage key values instead of field names to simplify the search definition. Read more in Grouping on Map Attributes.
By Ohad Shacham, Yonatan Gottesman, Edward Bortnikov Scalable Systems Research, Verizon/Oath
Omid, an open source transaction processing platform for Big Data, was born as a research project at Yahoo (now part of Verizon), and became an Apache Incubator project in 2015. Omid complements Apache HBase, a distributed key-value store in Apache Hadoop suite, with a capability to clip multiple operations into logically indivisible (atomic) units named transactions. This programming model has been extremely popular since the dawn of SQL databases, and has more recently become indispensable in the NoSQL world. For example, it is the centerpiece for dynamic content indexing of search and media products at Verizon, powering a web-scale content management platform since 2015.
Today, we are excited to share a new chapter in Omid’s history. Thanks to its scalability, reliability, and speed, Omid has been selected as transaction management provider for Apache Phoenix, a real-time converged OLTP and analytics platform for Hadoop. Phoenix provides a standard SQL interface to HBase key-value storage, which is much simpler and in many cases more performant than the native HBase API. With Phoenix, big data and machine learning developers get the best of all worlds: increased productivity coupled with high scalability. Phoenix is designed to scale to 10,000 query processing nodes in one instance and is expected to process hundreds of thousands or even millions of transactions per second (tps). It is widely used in the industry, including by Alibaba, Bloomberg, PubMatic, Salesforce, Sogou and many others.
We have just released a new and significantly improved version of Omid (1.0.0), the first major release since its original launch. We have extended the system with multiple functional and performance features to power a modern SQL database technology, ready for deployment on both private and public cloud platforms.
A few of the significant innovations include:
Protocol re-design for low latency
The early version of Omid was designed for use in web-scale data pipeline systems, which are throughput-oriented by nature. We re-engineered Omid’s internals to now support new ultra-low-latency OLTP (online transaction processing) applications, like messaging and algo-trading. The new protocol, Omid Low Latency (Omid LL), dissipates Omid’s major architectural bottleneck. It reduces the latency of short transactions by 5 times under light load, and by 10 to 100 times under heavy load. It also scales the overall system throughput to 550,000 tps while remaining within real-time latency SLAs. The figure below illustrates Omid LL scaling versus the previous version of Omid, for short and long transactions.
Throughput vs latency, transaction size=1 op
Throughput vs latency, transaction size=10 ops
Figure 1. Omid LL scaling versus legacy Omid. The throughput scales beyond 550,000 tps while the latency remains flat (low milliseconds).
ANSI SQL support
Phoenix provides secondary indexes for SQL tables — a centerpiece tool for efficient access to data by multiple keys. The CREATE INDEX command is on-demand; it is not allowed to block already deployed applications. We added Omid support for accomplishing this without impeding concurrent database operations or sacrificing consistency. We further introduced a mechanism to avoid recursive read-your-own-writes scenarios in complex queries, like “INSERT INTO T … SELECT FROM T …” statements. This was achieved by extending Omid’s traditional Snapshot Isolation consistency model, which provides single-read-point-single-write-point semantics, with multiple read and write points.
Performance improvements
Phoenix extensively employs stored procedures implemented as HBase filters in order to eliminate the overhead of multiple round-trips to the data store. We integrated Omid’s code within such HBase-resident procedures, allowing for a smooth integration with Phoenix and also reduced the overhead of transactional reads (for example, filtering out redundant data versions).
We collaborated closely with the Phoenix developer community while working on this project, and contributed code to Phoenix that made Omid’s integration possible. We look forward to seeing Omid’s adoption through a wide range of Phoenix applications. We always welcome new developers to join the community and help push Omid forward!
By Scott Bush, Director, Hadoop Software Engineering, Oath
On Tuesday, September 25, we hosted a special day-long Hadoop Contributors Meetup at our Sunnyvale, California campus. Much of the early Hadoop development work started at Yahoo, now part of Oath, and has continued over the past decade. Our campus was the perfect setting for this meetup, as we continue to make Hadoop a priority.
More than 80 Hadoop users, contributors, committers, and PMC members gathered to hear talks on key issues facing the Hadoop user community.
Speakers from Ampool, Cloudera, Hortonworks, Microsoft, Oath, and Twitter detailed some of the challenges and solutions pertinent to their parts of the Hadoop ecosystem. The talks were followed by a number of parallel, birds of a feather breakout sessions to discuss HDFS, Tez, containers and low latency processing. The day ended with a reception and consensus that the event went well and should be repeated in the near future.
Presentation recordings (YouTube playlist) and slides (links included in the video description) are available here:
I had the wonderful opportunity to present Vespa at the SF Big Analytics Meetup on September 26th, hosted by Amplitude. Several members of the Vespa team (Kim, Frode and Kristian) also attended. We all enjoyed meeting with members of the Big Analytics community to discuss how Vespa could be helpful for their companies. Thank you to Chester Chen, T.J. Bay, and Jin Hao Wan for planning the meetup, and here’s our presentation, in case you missed it (slides are also available here):
Largely developed by Yahoo engineers, Vespa is our big data processing and serving engine, available as open source on GitHub. It’s in use by many products, such as Yahoo News, Yahoo Sports, Yahoo Finance and Oath Ads Platforms.
Vespa use is growing even more rapidly; since it is open source under a permissive Apache license, Vespa can power other external third-party apps as well.
By Ian Flint, Network Automation Architect and Varun Varma, Senior Principal Engineer
The Oath network automation team is proud to announce that we are open-sourcing Panoptes, a distributed system for collecting, enriching and distributing network telemetry.
We developed Panoptes to address several issues inherent in legacy polling systems, including overpolling due to multiple point solutions for metrics, a lack of data normalization, consistent data enrichment and integration with infrastructure discovery systems.
Panoptes is a pluggable, distributed, high-performance data collection system which supports multiple polling formats, including SNMP and vendor-specific APIs. It is also extensible to support emerging streaming telemetry standards including gNMI.
Architecture
The following block diagram shows the major components of Panoptes:
Panoptes is written primarily in Python, and leverages multiple open-source technologies to provide the most value for the least development effort. At the center of Panoptes is a metrics bus implemented on Kafka. All data plane transactions flow across this bus; discovery publishes devices to the bus, polling publishes metrics to the bus, and numerous clients read the data off of the bus for additional processing and forwarding. This architecture enables easy data distribution and integration with other systems. For example, in preparing for open-source, we identified a need for a generally available time series datastore. We developed, tested and released a plugin to push metrics into InfluxDB in under a week. This flexibility allows Panoptes to evolve with industry standards.
Check scheduling is accomplished using Celery, a horizontally scalable, open-source scheduler utilizing a Redis data store. Celery’s scalable nature combined with Panoptes’ distributed nature yields excellent scalability. Across Oath, Panoptes currently runs hundreds of thousands of checks per second, and the infrastructure has been tested to more than one million checks per second.
Panoptes ships with a simple, CSV-based discovery system. Integrating Panoptes with a CMDB is as simple as writing an adapter to emit a CSV, and importing that CSV into Panoptes. From there, Panoptes will manage the task of scheduling polling for the desired devices. Users can also develop custom discovery plugins to integrate with their CMDB and other device inventory data sources.
Finally, any metrics gathering system needs a place to send the metrics. Panoptes’ initial release includes an integration with InfluxDB, an industry-standard time series store. Combined with Grafana and the InfluxData ecosystem, this gives teams the ability to quickly set up a fully-featured monitoring environment.
Deployment at Oath
At Oath, we anticipate significant benefits from building Panoptes. We will consolidate four siloed polling solutions into one, reducing overpolling and the associated risk of service interruption. As vendors move toward streaming telemetry, Panoptes’ flexible architecture will minimize the effort required to adopt these new protocols.
There is another, less obvious benefit to a system like Panoptes. As is the case with most large enterprises, a massive ecosystem of downstream applications has evolved around our existing polling solutions. Panoptes allows us to continue to populate legacy datastores without continuing to run the polling layers of those systems. This is because Panoptes’ data bus enables multiple metrics consumers, so we can send metrics to both current and legacy datastores.
At Oath, we have deployed Panoptes in a tiered, federated model. We install the software in each of our major data centers and proxy checks out to smaller installations such as edge sites. All metrics are polled from an instance close to the devices, and metrics are forwarded to a centralized time series datastore. We have also developed numerous custom applications on the platform, including a load balancer monitor, a BGP session monitor, and a topology discovery application. The availability of a flexible, extensible platform has greatly reduced the cost of producing robust network data systems.
Easy Setup
Panoptes’ open-source release is packaged for easy deployment into any Linux-based environment. Deployment is straightforward, so you can have a working system up in hours, not days.
We are excited to share our internal polling solution and welcome engineers to contribute to the codebase, including contributing device adapters, metrics forwarders, discovery plugins, and any other relevant data consumers.
We’re excited to share that The Apache Software Foundation announced today that Apache Pulsar has graduated from the incubator to a Top-Level Project. Apache Pulsar is an open-source distributed pub-sub messaging system, created by Yahoo in June 2015 and submitted to the Apache Incubator in June 2017.
Apache Pulsar is integral to the streaming data pipelines supporting Oath’s core products including Yahoo Mail, Yahoo Finance, Yahoo Sports and Oath Ad Platforms. It handles hundreds of billions of data events each day and is an integral part of our hybrid cloud strategy. It enables us to stream data between our public and private clouds and allows data pipelines to connect across the clouds.
Oath continues to support Apache Pulsar, with contributions including best-effort messaging, load balancer and end-to-end encryption. With growing data needs handled by Apache Pulsar at Oath, we’re focused on reducing memory pressure in brokers and bookkeepers, and creating additional connectors to other large-scale systems.
Apache Pulsar’s future is bright and we’re thrilled to be part of this great project and community.
At Oath, multiple ad platforms use a high throughput, low latency distributed key-value database that runs in data centers all over the world. The database stores billions of records and handles millions of read and write requests per second at millisecond latencies. The data we have in this database must be persistent, and the working set is larger than what we can fit in memory. Therefore, a key component of the database performance is a fast storage engine. Our current solution had served us well, but it was primarily designed for a read-heavy workload and its write throughput started to be a bottleneck as write traffic increased.
There were other additional concerns as well; it took hours to repair a corrupted DB, or iterate over and delete records. The storage engine also didn’t expose enough operational metrics. The primary concern though was the write performance, which based on our projections, would have been a major obstacle for scaling the database. With these concerns in mind, we began searching for an alternative solution.
We searched for a key-value storage engine capable of dealing with IO-bound workloads, with submillisecond read latencies under high read and write throughput. After concluding our research and benchmarking alternatives, we didn’t find a solution that worked for our workload, thus we were inspired to build HaloDB. Now, we’re glad to announce that it’s also open source and available to use under the terms of the Apache license.
HaloDB has given our production boxes a 50% improvement in write capacity while consistently maintaining a submillisecond read latency at the 99th percentile.
Architecture
HaloDB primarily consists of append-only log files on disk and an index of keys in memory. All writes are sequential writes which go to an append-only log file and the file is rolled-over once it reaches a configurable size. Older versions of records are removed to make space by a background compaction job.
The in-memory index in HaloDB is a hash table which stores all keys and their associated metadata. The size of the in-memory index, depending on the number of keys, can be quite large, hence for performance reasons, is stored outside the Java heap, in native memory. When looking up the value for a key, corresponding metadata is first read from the in-memory index and then the value is read from disk. Each lookup request requires at most a single read from disk.
Performance
The chart below shows the results of performance tests with real production data. The read requests were kept at 50,000 QPS while the write QPS was increased. HaloDB scaled very well as we increased the write QPS while consistently maintaining submillisecond read latencies at the 99th percentile.
The chart below shows the 99th percentile latency from a production server before and after migration to HaloDB.
If HaloDB sounds like a helpful solution to you, please feel free to use it, open issues, and contribute!
By Dmitry Basin, Edward Bortnikov, Anastasia Braginsky, Eshcar Hillel, Idit Keidar, Hagar Meir, Gali Sheffi
Real-time analytics applications are on the rise. Modern decision support and machine intelligence engines strive to continuously ingest large volumes of data while providing up-to-date insights with minimum delay. For example, in Flurry Analytics, an Oath service which provides mobile developers with rich tools to explore user behavior in real time, it only takes seconds to reflect the events that happened on mobile devices in its numerous dashboards. The scalability demand is immense – as of late 2017, the Flurry SDK was installed on 2.6B devices and monitored 1M+ mobile apps. Mobile data hits the Flurry backend at a huge rate, updates statistics across hundreds of dimensions, and becomes queryable immediately. Flurry harnesses the open-source distributed interactive analytics engine named Druid to ingest data and serve queries at this massive rate.
In order to minimize delays before data becomes available for analysis, technologies like Druid should avoid maintaining separate systems for data ingestion and query serving, and instead strive to do both within the same system. Doing so is nontrivial since one cannot compromise on overall correctness when multiple conflicting operations execute in parallel on modern multi-core CPUs. A promising approach is using concurrent data structure (CDS) algorithms which adapt traditional data structures to multiprocessor hardware. CDS implementations are thread-safe – that is, developers can use them exactly as sequential code while maintaining strong theoretical correctness guarantees. In recent years, CDS algorithms enabled dramatic application performance scaling and became popular programming tools. For example, Java programmers can use the ConcurrentNavigableMap JDK implementations for the concurrent ordered key-value map abstraction that is instrumental in systems like Druid.
Today, we are excited to share Oak, a new open source project from Oath, available under the Apache License 2.0. The project was created by the Scalable Systems team at Yahoo Research. It extends upon our earlier research work, named KiWi.
Oak is a Java package that implements OakMap – a concurrent ordered key-value map. OakMap’s API is similar to Java’s ConcurrentNavigableMap. Java developers will find it easy to switch most of their applications to it. OakMap provides the safety guarantees specified by ConcurrentNavigableMap’s programming model. However, it scales with the RAM and CPU resources well beyond the best-in-class ConcurrentNavigableMap implementations. For example, it compares favorably to Doug Lea’s seminal ConcurrentSkipListMap, which is used by multiple big data platforms, including Apache HBase, Druid, EVCache, etc. Our benchmarks show that OakMap harnesses 3x more memory, and runs 3x-5x faster on analytics workloads.
OakMap’s implementation is very different from traditional implementations such as ConcurrentSkipListMap. While the latter maintains all keys and values as individual Java objects, OakMap stores them in very large memory buffers allocated beyond the JVM-managed memory heap (hence the name Oak - abbr. Off-heap Allocated Keys). The access to the key-value pairs is provided by a lightweight two-level on-heap index. At its lower level, the references to keys are stored in contiguous chunks, each responsible for a distinct key range. The chunks themselves, which dominate the index footprint, are accessed through a lightweight top-level ConcurrentSkipListMap. The figure below illustrates OakMap’s data organization.
OakMap structure.
The maintenance of OakMap’s chunked index in a concurrent setting is the crux of its complexity as well as the key for its efficiency. Experiments have shown that our algorithm is advantageous in multiple ways:
1. Memory scaling. OakMap’s custom off-heap memory allocation alleviates the garbage collection (GC) overhead that plagues Java applications. Despite the permanent progress, modern Java GC algorithms do not practically scale beyond a few tens of GBs of memory, whereas OakMap scales beyond 128GB of off-heap RAM.
2. Query speed. The chunk-based layout increases data locality, which speeds up both single-key lookups and range scans. All queries enjoy efficient, cache-friendly access, in contrast with permanent dereferencing in object-based maps. On top of these basic merits, OakMap provides safe direct access to its chunks, which avoids an extra copy for rebuilding the original key and value objects. Our benchmarks demonstrate OakMap’s performance benefits versus ConcurrentSkipListMap:
A) Up to 2x throughput for ascending scans.
B) Up to 5x throughput for descending scans.
C) Up to 3x throughput for lookups.
3. Update speed. Beyond avoiding the GC overhead typical for write-intensive workloads, OakMap optimizes the incremental maintenance of big complex values – for example, aggregate data sketches, which are indispensable in systems like Druid. It adopts in situ computation on objects embedded in its internal chunks to avoid unnecessary data copy, yet again. In our benchmarks, OakMap achieves up to 1.8x data ingestion rate versus ConcurrentSkipListMap.
With key-value maps being an extremely generic abstraction, it is easy to envision a variety of use cases for OakMap in large-scale analytics and machine learning applications – such as unstructured key-value storage, structured databases, in-memory caches, parameter servers, etc. For example, we are already working with the Druid community on rebuilding Druid’s core Incremental Index component around OakMap, in order to boost its scalability and performance.
We look forward to growing the Oak community! We invite you to explore the project, use OakMap in your applications, raise issues, suggest improvements, and contribute code. If you have any questions, please feel free to send us a note on the Oak developers list: oakproject@googlegroups.com. It would be great to hear from you!
When Yahoo and AOL came together a year ago as a part of the new Verizon subsidiary Oath, we took on the challenge of unifying their identity platforms based on current identity standards. Identity standards have been a critical part of the Internet ecosystem over the last 20+ years. From single-sign-on and identity federation with SAML; to the newer identity protocols including OpenID Connect, OAuth2, JOSE, and SCIM (to name a few); to the explorations of “self-sovereign identity” based on distributed ledger technologies; standards have played a key role in providing a secure identity layer for the Internet.
As we navigated this journey, we ran across a number of different use cases where there was either no standard or no best practice available for our varied and complicated needs. Instead of creating entirely new standards to solve our problems, we found it more productive to use existing standards in new ways.
One such use case arose when we realized that we needed to migrate the identity stored in mobile apps from the legacy identity provider to the new Oath identity platform. For most browser (mobile or desktop) use cases, this doesn’t present a huge problem; some DNS magic and HTTP redirects and the user will sign in at the correct endpoint. Also it’s expected for users accessing services via their browser to have to sign in now and then.
However, for mobile applications it’s a completely different story. The normal user pattern for mobile apps is for the user to sign in (via OpenID Connect or OAuth2) and for the app to then be issued long-lived tokens (well, the refresh token is long lived) and the user never has to sign in again on the device (entering a password on the device is NOT a good experience for the user).
So the issue is, how do we allow the mobile app to move from one
identity provider to another without the user having to re-enter their
credentials? The solution came from researching what standards currently
exist that might addres this use case (see figure “Standards Landscape”
below) and finding the OAuth 2.0 Token Exchange draft specification (https://tools.ietf.org/html/draft-ietf-oauth-token-exchange-13).
The Token Exchange draft allows for a given token to be exchanged for new tokens in a different domain. This could be used to manage the “audience” of a token that needs to be passed among a set of microservices to accomplish a task on behalf of the user, as an example. For the use case at hand, we created a specific implementation of the Token Exchange specification (a profile) to allow the refresh token from the originating Identity Provider (IDP) to be exchanged for new tokens from the consolidated IDP. By profiling this draft standard we were able to create a much better user experience for our consumers and do so without inventing proprietary mechanisms.
During this identity technical consolidation we also had to address how to support sharing signed-in users across mobile applications written by the same company (technically, signed with the same vendor signing key). Specifically, how can a signed-in user to Yahoo Mail not have to re-sign in when they start using the Yahoo Sports app? The current best practice for this is captured in OAuth 2.0 for Natives Apps (RFC 8252). However, the flow described by this specification requires that the mobile device system browser hold the user’s authenticated sessions. This has some drawbacks such as users clearing their cookies, or using private browsing mode, or even worse, requiring the IDPs to support multiple users signed in at the same time (not something most IDPs support).
While, RFC 8252 provides a mechanism for single-sign-on (SSO) across mobile apps provided by any vendor, we wanted a better solution for apps provided by Oath. So we looked at how could we enable mobile apps signed by the vendor to share the signed-in state in a more “back channel” way. One important fact is that mobile apps cryptographically signed by the same vender can securely share data via the device keychain on iOS and Account Manager on Android.
Using this as a starting point we defined a new OAuth2 scope, device_sso, whose purpose is to require the Authorization Server (AS) to return a unique “secret” assigned to that specific device. The precedent for using a scope to define specification behaviour is OpenID Connect itself, which defines the “openid” scope as the trigger for the OpenID Provider (an OAuth2 AS) to implement the OpenID Connect specification. The device_secret is returned to a mobile app when the OAuth2 code is exchanged for tokens and then stored by the mobile app in the device keychain and with the id_token identifying the user who signed in.
At this point, a second mobile app signed by the same vendor can look in the keychain and find the id_token, ask the user if they want to use that identity with the new app, and then use a profile of the token exchange spec to obtain tokens for the second mobile app based on the id_token and the device_secret. The full sequence of steps looks like this:
As a result of our identity consolidation work over the past year, we derived a set of principles identity architects should find useful for addressing use cases that don’t have a known specification or best practice. Moreover, these are applicable in many contexts outside of identity standards:
Spend time researching the existing set of standards and draft standards. As the diagram shows, there are a lot of standards out there already, so understanding them is critical.
Don’t invent something new if you can just profile or combine already existing specifications.
Make sure you understand the spirit and intent of the existing specifications.
For those cases where an extension is required, make sure to extend the specification based on its spirit and intent.
Ask the community for clarity regarding any existing specification or draft.
Contribute back to the community via blog posts, best practice documents, or a new specification.
As we learned during the consolidation of our Yahoo and AOL identity platforms, and as demonstrated in our examples, there is no need to resort to proprietary solutions for use cases that at first look do not appear to have a standards-based solution. Instead, it’s much better to follow these principles, avoid the NIH (not-invented-here) syndrome, and invest the time to build solutions on standards.
Well, we actually won’t show you how we create the magic in our big OATH consumer mail factory. But nevertheless we wanted to share how interested developers could leverage some of our unique features we offer for our Yahoo and AOL Mail customers.
To drive experiences like our travel and shopping smart views or message threading, we tag qualified mails with something we call DECOS and THREADID. While we will not indulge in explaining how exactly we use them internally, we wanted to share how they can be used and accessed through IMAP.
So let’s just look at a sample IMAP command chain. We’ll just assume that you are familiar with the IMAP protocol at this point and you know how to properly talk to an IMAP server.
So here’s how you would retrieve DECO and THREADIDs for specific messages:
By Mohit Goenka, Gnanavel Shanmugam, and Lance Welsh
At Yahoo Mail, we’re constantly striving to upgrade our product experience. We do this not only by adding new features based on our members’ feedback, but also by providing the best technical solutions to power the most engaging experiences. As such, we’ve recently introduced a number of novel and unique revisions to the way in which we use Redux that have resulted in significant stability and performance improvements. Developers may find our methods useful in achieving similar results in their apps.
Improvements to product metrics
Last year Yahoo Mail implemented a brand new architecture using Redux. Since then, we have transformed the overall architecture to reduce latencies in various operations, reduce JavaScript exceptions, and better synchronized states. As a result, the product is much faster and more stable.
Stability improvements:
when checking for new emails – 20%
when reading emails – 30%
when sending emails – 20%
Performance improvements:
10% improvement in page load performance
40% improvement in frame rendering time
We have also reduced API calls by approximately 20%.
How we use Redux in Yahoo Mail
Redux architecture is reliant on one large store that represents the application state. In a Redux cycle, action creators dispatch actions to change the state of the store. React Components then respond to those state changes. We’ve made some modifications on top of this architecture that are atypical in the React-Redux community.
For instance, when fetching data over the network, the traditional methodology is to use Thunk middleware. Yahoo Mail fetches data over the network from our API. Thunks would create an unnecessary and undesirable dependency between the action creators and our API. If and when the API changes, the action creators must then also change. To keep these concerns separate we dispatch the action payload from the action creator to store them in the Redux state for later processing by “action syncers”. Action syncers use the payload information from the store to make requests to the API and process responses. In other words, the action syncers form an API layer by interacting with the store. An additional benefit to keeping the concerns separate is that the API layer can change as the backend changes, thereby preventing such changes from bubbling back up into the action creators and components. This also allowed us to optimize the API calls by batching, deduping, and processing the requests only when the network is available. We applied similar strategies for handling other side effects like route handling and instrumentation. Overall, action syncers helped us to reduce our API calls by ~20% and bring down API errors by 20-30%.
Another change to the normal Redux architecture was made to avoid unnecessary props. The React-Redux community has learned to avoid passing unnecessary props from high-level components through multiple layers down to lower-level components (prop drilling) for rendering. We have introduced action enhancers middleware to avoid passing additional unnecessary props that are purely used when dispatching actions. Action enhancers add data to the action payload so that data does not have to come from the component when dispatching the action. This avoids the component from having to receive that data through props and has improved frame rendering by ~40%. The use of action enhancers also avoids writing utility functions to add commonly-used data to each action from action creators.
In our new architecture, the store reducers accept the dispatched action via action enhancers to update the state. The store then updates the UI, completing the action cycle. Action syncers then initiate the call to the backend APIs to synchronize local changes.
Conclusion
Our novel use of Redux in Yahoo Mail has led to significant user-facing benefits through a more performant application. It has also reduced development cycles for new features due to its simplified architecture. We’re excited to share our work with the community and would love to hear from anyone interested in learning more.
The mail team at OATH is busy integrating Yahoo and AOL technology to deliver an even better experience across all our consumer mail products. While privacy and security are top priority for us, we also want to improve the experience and remove unnecessary clutter across all of our products.
Starting this week we will be serving images in mails via our own secure proxy servers. This will not only increase speed and security in our own mail products and reduce the risk of phishing and other scams, but it will also mean that our users don’t have to fiddle around with those “enable images” settings. Messages and inline images will now just show up as originally intended.
We are aware that commercial mail senders are relying on images (so-called pixels) to track delivery and open rates. Our proxy solution will continue to support most of these cases and ensure that true mail opens are recorded.
For senders serving dynamic content based on the recipient’s location(leveraging standard IP-based browser and app capabilities)we recommend falling back on other tools and technologies which do not rely on IP-based targeting.
All of our consumer mail applications (Yahoo and AOL) will benefit from this change. This includes our desktop products as well as our mobile applications across iOS and Android.
If you have any feedback or want to discuss those changes with us personally, just send us a note to mail-questions@oath.com.
Kuhu Shukla (bottom center) and team at the 2017 DataWorks Summit
By Kuhu Shukla
This post first appeared here on the Apache Software Foundation blog as part of ASF’s “Success at Apache” monthly blog series.
As I sit at my desk on a rather frosty morning with my coffee, looking up new JIRAs from the previous day in the Apache Tez project, I feel rather pleased. The latest community release vote is complete, the bug fixes that we so badly needed are in and the new release that we tested out internally on our many thousand strong cluster is looking good. Today I am looking at a new stack trace from a different Apache project process and it is hard to miss how much of the exceptional code I get to look at every day comes from people all around the globe. A contributor leaves a JIRA comment before he goes on to pick up his kid from soccer practice while someone else wakes up to find that her effort on a bug fix for the past two months has finally come to fruition through a binding +1.
Yahoo – which joined AOL, HuffPost, Tumblr, Engadget, and many more brands to form the Verizon subsidiary Oath last year – has been at the frontier of open source adoption and contribution since before I was in high school. So while I have no historical trajectories to share, I do have a story on how I found myself in an epic journey of migrating all of Yahoo jobs from Apache MapReduce to Apache Tez, a then-new DAG based execution engine.
Oath grid infrastructure is through and through driven by Apache technologies be it storage through HDFS, resource management through YARN, job execution frameworks with Tez and user interface engines such as Hive, Hue, Pig, Sqoop, Spark, Storm. Our grid solution is specifically tailored to Oath’s business-critical data pipeline needs using the polymorphic technologies hosted, developed and maintained by the Apache community.
On the third day of my job at Yahoo in 2015, I received a YouTube link on An Introduction to Apache Tez. I watched it carefully trying to keep up with all the questions I had and recognized a few names from my academic readings of Yarn ACM papers. I continued to ramp up on YARN and HDFS, the foundational Apache technologies Oath heavily contributes to even today. For the first few weeks I spent time picking out my favorite (necessary) mailing lists to subscribe to and getting started on setting up on a pseudo-distributed Hadoop cluster. I continued to find my footing with newbie contributions and being ever more careful with whitespaces in my patches. One thing was clear – Tez was the next big thing for us. By the time I could truly call myself a contributor in the Hadoop community nearly 80-90% of the Yahoo jobs were now running with Tez. But just like hiking up the Grand Canyon, the last 20% is where all the pain was. Being a part of the solution to this challenge was a happy prospect and thankfully contributing to Tez became a goal in my next quarter.
The next sprint planning meeting ended with me getting my first major Tez assignment – progress reporting. The progress reporting in Tez was non-existent – “Just needs an API fix,” I thought. Like almost all bugs in this ecosystem, it was not easy. How do you define progress? How is it different for different kinds of outputs in a graph? The questions were many.
I, however, did not have to go far to get answers. The Tez community actively came to a newbie’s rescue, finding answers and posing important questions. I started attending the bi-weekly Tez community sync up calls and asking existing contributors and committers for course correction. Suddenly the team was much bigger, the goals much more chiseled. This was new to anyone like me who came from the networking industry, where the most open part of the code are the RFCs and the implementation details are often hidden. These meetings served as a clean room for our coding ideas and experiments. Ideas were shared, to the extent of which data structure we should pick and what a future user of Tez would take from it. In between the usual status updates and extensive knowledge transfers were made.
Oath uses Apache Pig and Apache Hive extensively and most of the urgent requirements and requests came from Pig and Hive developers and users. Each issue led to a community JIRA and as we started running Tez at Oath scale, new feature ideas and bugs around performance and resource utilization materialized. Every year most of the Hadoop team at Oath travels to the Hadoop Summit where we meet our cohorts from the Apache community and we stand for hours discussing the state of the art and what is next for the project. One such discussion set the course for the next year and a half for me.
We needed an innovative way to shuffle data. Frameworks like MapReduce and Tez have a shuffle phase in their processing lifecycle wherein the data from upstream producers is made available to downstream consumers. Even though Apache Tez was designed with a feature set corresponding to optimization requirements in Pig and Hive, the Shuffle Handler Service was retrofitted from MapReduce at the time of the project’s inception. With several thousands of jobs on our clusters leveraging these features in Tez, the Shuffle Handler Service became a clear performance bottleneck. So as we stood talking about our experience with Tez with our friends from the community, we decided to implement a new Shuffle Handler for Tez. All the conversation points were tracked now through an umbrella JIRA TEZ-3334 and the to-do list was long. I picked a few JIRAs and as I started reading through I realized, this is all new code I get to contribute to and review. There might be a better way to put this, but to be honest it was just a lot of fun! All the whiteboards were full, the team took walks post lunch and discussed how to go about defining the API. Countless hours were spent debugging hangs while fetching data and looking at stack traces and Wireshark captures from our test runs. Six months in and we had the feature on our sandbox clusters. There were moments ranging from sheer frustration to absolute exhilaration with high fives as we continued to address review comments and fixing big and small issues with this evolving feature.
As much as owning your code is valued everywhere in the software community, I would never go on to say “I did this!” In fact, “we did!” It is this strong sense of shared ownership and fluid team structure that makes the open source experience at Apache truly rewarding. This is just one example. A lot of the work that was done in Tez was leveraged by the Hive and Pig community and cross Apache product community interaction made the work ever more interesting and challenging. Triaging and fixing issues with the Tez rollout led us to hit a 100% migration score last year and we also rolled the Tez Shuffle Handler Service out to our research clusters. As of last year we have run around 100 million Tez DAGs with a total of 50 billion tasks over almost 38,000 nodes.
In 2018 as I move on to explore Hadoop 3.0 as our future release, I hope that if someone outside the Apache community is reading this, it will inspire and intrigue them to contribute to a project of their choice. As an astronomy aficionado, going from a newbie Apache contributor to a newbie Apache committer was very much like looking through my telescope - it has endless possibilities and challenges you to be your best.
About the Author:
Kuhu Shukla is a software engineer at Oath and did her Masters in Computer Science at North Carolina State University. She works on the Big Data Platforms team on Apache Tez, YARN and HDFS with a lot of talented Apache PMCs and Committers in Champaign, Illinois. A recent Apache Tez Committer herself she continues to contribute to YARN and HDFS and spoke at the 2017 Dataworks Hadoop Summit on “Tez Shuffle Handler: Shuffling At Scale With Apache Hadoop”. Prior to that she worked on Juniper Networks’ router and switch configuration APIs. She likes to participate in open source conferences and women in tech events. In her spare time she loves singing Indian classical and jazz, laughing, whale watching, hiking and peering through her Dobsonian telescope.
By Murali Krishna Bachhu, Anurag Damle, and Utkarsh Shrivastava
As engineers on the Yahoo Mail team at Oath, we pride ourselves on the things that matter most to developers: faster development cycles, more reliability, and better performance. Users don’t necessarily see these elements, but they certainly feel the difference they make when significant improvements are made. Recently, we were able to upgrade all three of these areas at scale by adopting webpack® as Yahoo Mail’s underlying module bundler, and you can do the same for your web application.
What is webpack?
webpack is an open source module bundler for modern JavaScript applications. When webpack processes your application, it recursively builds a dependency graph that includes every module your application needs. Then it packages all of those modules into a small number of bundles, often only one, to be loaded by the browser.
webpack became our choice module bundler not only because it supports on-demand loading, multiple bundle generation, and has a relatively low runtime overhead, but also because it is better suited for web platforms and NodeJS apps and has great community support.
Comparison of webpack to other open source bundlers
How did we integrate webpack?
Like any developer does when integrating a new module bundler, we started integrating webpack into Yahoo Mail by looking at its basic config file. We explored available default webpack plugins as well as third-party webpack plugins and then picked the plugins most suitable for our application. If we didn’t find a plugin that suited a specific need, we wrote the webpack plugin ourselves (e.g., We wrote a plugin to execute Atomic CSS scripts in the latest Yahoo Mail experience in order to decrease our overall CSS payload**).
During the development process for Yahoo Mail, we needed a way to make sure webpack would continuously run in the background. To make this happen, we decided to use the task runner Grunt. Not only does Grunt keep the connection to webpack alive, but it also gives us the ability to pass different parameters to the webpack config file based on the given environment. Some examples of these parameters are source map options, enabling HMR, and uglification.
Before deployment to production, we wanted to optimize the javascript bundles for size to make the Yahoo Mail experience faster. webpack provides good default support for this with the UglifyJS plugin. Although the default options are conservative, they give us the ability to configure the options. Once we modified the options to our specifications, we saved approximately 10KB.
Code snippet showing the configuration options for the UglifyJS plugin
Faster development cycles for developers
While developing a new feature, engineers ideally want to see their code changes reflected on their web app instantaneously. This allows them to maintain their train of thought and eventually results in more productivity. Before we implemented webpack, it took us around 30 seconds to 1 minute for changes to reflect on our Yahoo Mail development environment. webpack helped us reduce the wait time to 5 seconds.
More reliability
Consumers love a reliable product, where all the features work seamlessly every time. Before we began using webpack, we were generating javascript bundles on demand or during run-time, which meant the product was more prone to exceptions or failures while fetching the javascript bundles. With webpack, we now generate all the bundles during build time, which means that all the bundles are available whenever consumers access Yahoo Mail. This results in significantly fewer exceptions and failures and a better experience overall.
Better Performance
We were able to attain a significant reduction of payload after adopting webpack.
Reduction of about 75 KB gzipped Javascript payload
50% reduction on server-side render time
10% improvement in Yahoo Mail’s launch performance metrics, as measured by render time above the fold (e.g., Time to load contents of an email).
Below are some charts that demonstrate the payload size of Yahoo Mail before and after implementing webpack.
Payload before using webpack (JavaScript Size = 741.41KB)
Payload after switching to webpack (JavaScript size = 669.08KB)
Conclusion
Shifting to webpack has resulted in significant improvements. We saw a common build process go from 30 seconds to 5 seconds, large JavaScript bundle size reductions, and a halving in server-side rendering time. In addition to these benefits, our engineers have found the community support for webpack to have been impressive as well. webpack has made the development of Yahoo Mail more efficient and enhanced the product for users. We believe you can use it to achieve similar results for your web application as well.
**Optimized CSS generation with Atomizer
Before we implemented webpack into the development of Yahoo Mail, we looked into how we could decrease our CSS payload. To achieve this, we developed an in-house solution for writing modular and scoped CSS in React. Our solution is similar to the Atomizer library, and our CSS is written in JavaScript like the example below:
Sample snippet of CSS written with Atomizer
Every React component creates its own styles.js file with required style definitions. React-Atomic-CSS converts these files into unique class definitions. Our total CSS payload after implementing our solution equaled all the unique style definitions in our code, or only 83KB (21KB gzipped).
During our migration to webpack, we created a custom plugin and loader to parse these files and extract the unique style definitions from all of our CSS files. Since this process is tied to bundling, only CSS files that are part of the dependency chain are included in the final CSS.
When it comes to performance and reliability, there is perhaps no application where this matters more than with email. Today, we announced a new Yahoo Mail experience for desktop based on a completely rewritten tech stack that embodies these fundamental considerations and more.
We built the new Yahoo Mail experience using a best-in-class front-end tech stack with open source technologies including React, Redux, Node.js, react-intl (open-sourced by Yahoo), and others. A high-level architectural diagram of our stack is below.
New Yahoo Mail Tech Stack
In building our new tech stack, we made use of the most modern tools available in the industry to come up with the best experience for our users by optimizing the following fundamentals:
Performance
A key feature of the new Yahoo Mail architecture is blazing-fast initial loading (aka, launch).
We introduced new network routing which sends users to their nearest geo-located email servers (proximity-based routing). This has resulted in a significant reduction in time to first byte and should be immediately noticeable to our international users in particular.
We now do server-side rendering to allow our users to see their mail sooner. This change will be immediately noticeable to our low-bandwidth users. Our application is isomorphic, meaning that the same code runs on the server (using Node.js) and the client. Prior versions of Yahoo Mail had programming logic duplicated on the server and the client because we used PHP on the server and JavaScript on the client.
Using efficient bundling strategies (JavaScript code is separated into application, vendor, and lazy loaded bundles) and pushing only the changed bundles during production pushes, we keep the cache hit ratio high. By using react-atomic-css, our homegrown solution for writing modular and scoped CSS in React, we get much better CSS reuse.
In prior versions of Yahoo Mail, the need to run various experiments in parallel resulted in additional branching and bloating of our JavaScript and CSS code. While rewriting all of our code, we solved this issue using Mendel, our homegrown solution for bucket testing isomorphic web apps, which we have open sourced.
Rather than using custom libraries, we use native HTML5 APIs and ES6 heavily and use PolyesterJS, our homegrown polyfill solution, to fill the gaps. These factors have further helped us to keep payload size minimal.
With all the above optimizations, we have been able to reduce our JavaScript and CSS footprint by approximately 50% compared to the previous desktop version of Yahoo Mail, helping us achieve a blazing-fast launch.
In addition to initial launch improvements, key features like search and message read (when a user opens an email to read it) have also benefited from the above optimizations and are considerably faster in the latest version of Yahoo Mail.
We also significantly reduced the memory consumed by Yahoo Mail on the browser. This is especially noticeable during a long running session.
Reliability
With this new version of Yahoo Mail, we have a 99.99% success rate on core flows: launch, message read, compose, search, and actions that affect messages. Accomplishing this over several billion user actions a day is a significant feat. Client-side errors (JavaScript exceptions) are reduced significantly when compared to prior Yahoo Mail versions.
Product agility and launch velocity
We focused on independently deployable components. As part of the re-architecture of Yahoo Mail, we invested in a robust continuous integration and delivery flow. Our new pipeline allows for daily (or more) pushes to all Mail users, and we push only the bundles that are modified, which keeps the cache hit ratio high.
Developer effectiveness and satisfaction
In developing our tech stack for the new Yahoo Mail experience, we heavily leveraged open source technologies, which allowed us to ensure a shorter learning curve for new engineers. We were able to implement a consistent and intuitive onboarding program for 30+ developers and are now using our program for all new hires. During the development process, we emphasise predictable flows and easy debugging.
Accessibility
The accessibility of this new version of Yahoo Mail is state of the art and delivers outstanding usability (efficiency) in addition to accessibility. It features six enhanced visual themes that can provide accommodation for people with low vision and has been optimized for use with Assistive Technology including alternate input devices, magnifiers, and popular screen readers such as NVDA and VoiceOver. These features have been rigorously evaluated and incorporate feedback from users with disabilities. It sets a new standard for the accessibility of web-based mail and is our most-accessible Mail experience yet.
Open source
We have open sourced some key components of our new Mail stack, like Mendel, our solution for bucket testing isomorphic web applications. We invite the community to use and build upon our code. Going forward, we plan on also open sourcing additional components like react-atomic-css, our solution for writing modular and scoped CSS in React, and lazy-component, our solution for on-demand loading of resources.
Many of our company’s best technical minds came together to write a brand new tech stack and enable a delightful new Yahoo Mail experience for our users.
We encourage our users and engineering peers in the industry to test the limits of our application, and to provide feedback by clicking on the Give Feedback call out in the lower left corner of the new version of Yahoo Mail.
Building the technology powering the best consumer email inbox in the world is no easy task. When you start on such a journey, it is important to consider how to deliver such an experience to the users. After all, any consumer feature we build can only make a difference after it is delivered to everyone via the tech pipeline.
As we began building out the new version of Yahoo Mail, we wanted to ensure that our internal developer productivity would not be hindered by how our pipelines work. Keeping this in mind, we identified the following principles as most important while designing the delivery pipeline for the new Yahoo Mail experience:
Product updates are pushed at regular intervals
Releases are stable
Builds are not blocked by irrational test failures
Developers are notified of code pushes
Hotfixes
Rollbacks
Heartbeat pushes
Product updates are pushed at regular intervals
We ensure that our engineers can push any code changes to all Mail users everyday, with the ability to push multiple times a day, if necessary or desired. This is possible because of the time we spent building a solid testing infrastructure, which continues to evolve as we scale to new users and add new features to the product. Every one of our builds runs 10,000+ unit tests and 5,000+ integration tests on various combinations of operating systems and browsers. It is important to push product updates regularly as it allows all our users to get the best Mail experience possible.
Releases are stable
Every code release starts with the company’s internal audience first, where all our employees get to try out the latest changes before they go out to production. This begins with our alpha and beta environments that our Mail engineers use by default. Our build then goes out to the canary environment, which is a small subset of production users, before making it to all users. This gives us the ability to analyze quality metrics on internal and canary servers before rolling the build out to 100% of users in production. Once we go through this process, the code pushed to all our users is thoroughly baked and tested.
Builds are not blocked by irrational test failures
Running tests using web drivers on multiple browsers, as is standard when testing frontend code, comes with the problem of tests irrationally failing. As part the Yahoo Mail continuous delivery pipeline, we employ various novel strategies to recover from such failures. One such strategy is recording the data related to failed tests in the first pass of a build, and then rerunning only the failed tests in the subsequent passes. This is achieved by creating a metadata file that stores all our build-related information. As part of this process, a new bundle is created with a new set of code changes. Once a bundle is created with build metadata information, the same build job can be rerun multiple times such that subsequent reruns would only run the failing tests. This significantly improves rerun times and eliminates the chances of build detentions introduced by irrational test failures. The recorded test information is analyzed independently to understand the pattern of failing tests. This helps us in improving the stability of those intermittently failing tests.
Developers are notified of code pushes
Our build and deployment pipelines collect data related to all the authors contributing to any release through code commits or by merging various pull requests. This enables the build pipeline to send out email notifications to all our Mail developers as their code flows through each environment in our build pipeline (alpha, beta, canary, and production). With this ability, developers are well aware of where their code is in the pipeline and can test their changes as needed.
Hotfixes
We have also created a pipeline to deploy major code fixes directly to production. This is needed even after the existence of tens of thousands of tests and multitudes of checks. Every now and then, a bug may make its way into production. For such instances, we have hotfixes that are very useful. These are code patches that we quickly deploy on top of production code to address critical issues impacting large sets of users.
Rollbacks
If we find any issues in production, we do our best to minimize the impact on users by swiftly utilizing rollbacks, ensuring there is zero to minimal impact time. In order to do rollbacks, we maintain lists of all the versions pushed to production along with their release bundles and change logs. If needed, we pick the stable version that was previously pushed to production and deploy it directly on all the machines running our production instance.
Heartbeat pushes
As part of our continuous delivery efforts, we have also developed a concept we call heartbeat pushes. Heartbeat pushes are notifications we send users to refresh their browsers when we issue important builds that they should immediately adopt. These can include bug fixes, product updates, or new features. Heartbeat allows us to dynamically update the latest version of Yahoo Mail when we see that a user’s current version needs to be updated.
Yahoo Mail Continuous Delivery Flow
In building the new Yahoo Mail experience, we knew that we needed to revamp from the ground up, starting with our continuous integration and delivery pipeline. The guiding principles of our new, forward-thinking infrastructure allow us to deliver new features and code fixes at a very high launch velocity and ensure that our users are always getting the latest and greatest Yahoo Mail experience.
By Michael Natkovich, Akshai Sarma, Nathan Speidel, Marcus Svedman, and Cat Utah
Big Data is no longer just Apache server logs. Nowadays, the data may be user engagement data, performance metrics, IoT (Internet of Things) data, or something else completely atypical. Regardless of the size of the data, or the type of querying patterns on it (exploratory, ad-hoc, periodic, long-term, etc.), everyone wants queries to be as fast as possible and cheap to run in terms of resources. Data can be broadly split into two kinds: the streaming (generally real-time) kind or the batched-up-over-a-time-interval (e.g., hourly or daily) kind. The batch version is typically easier to query since it is stored somewhere like a data warehouse that has nice SQL-like interfaces or an easy to use UI provided by tools such as Tableau, Looker, or Superset. Running arbitrary queries on streaming data quickly and cheaply though, is generally much harder… until now. Today, we are pleased to share our newly open sourced, forward-looking general purpose query engine, called Bullet, with the community on GitHub.
With Bullet, you can:
Powerful and nested filtering
Fetching raw data records
Aggregating data using Group Bys (Sum, Count, Average, etc.), Count Distincts, Top Ks
Getting distributions of fields like Percentiles or Frequency histograms
One of the key differences between how Bullet queries data and the standard querying paradigm is that Bullet does not store any data. In most other systems where you have a persistence layer (including in-memory storage), you are doing a look-back when you query the layer. Instead, Bullet operates on data flowing through the system after the query is started – it’s a look-forward system that doesn’t need persistence. On a real-time data stream, this means that Bullet is querying data after the query is submitted. This also means that Bullet does not query any data that has already passed through the stream. The fact that Bullet does not rely on a persistence layer is exactly what makes it extremely lightweight and cheap to run.
To see why this is better for the kinds of use cases Bullet is meant for – such as quickly looking at some metric, checking some assumption, iterating on a query, checking the status of something right now, etc. – consider the following: if you had a 1000 queries in a traditional query system that operated on the same data, these query systems would most likely scan the data 1000 times each. By the very virtue of it being forward looking, 1000 queries in Bullet scan the data only once because the arrival of the query determines and fixes the data that it will see. Essentially, the data is coming to the queries instead of the queries being farmed out to where the data is. When the conditions of the query are satisfied (usually a time window or a number of events), the query terminates and returns you the result.
A Brief Architecture Overview
High Level Bullet Architecture
The Bullet architecture is multi-tenant, can scale linearly for more queries and/or more data, and has been tested to handle 700+ simultaneous queries on a data stream that had up to 1.5 million records per second, or 5-6 GB/s. Bullet is currently implemented on top of Storm and can be extended to support other stream processing engines as well, like Spark Streaming or Flink. Bullet is pluggable, so you can plug in any source of data that can be read in Storm by implementing a simple data container interface to let Bullet work with it.
The UI, web service, and the backend layers constitute your standard three-tier architecture. The Bullet backend can be split into three main subsystems:
Request Processor – receives queries, adds metadata, and sends it to the rest of the system
Data Processor – reads data from an input stream, converts it to a unified data format, and matches it against queries
Combiner – combines results for different queries, performs final aggregations, and returns results
The web service can be deployed on any servlet container, like Jetty. The UI is a Node-based Ember application that runs in the client browser. Our full documentation contains all the details on exactly how we perform computationally-intractable queries like Count Distincts on fields with cardinality in the millions, etc. (DataSketches).
Usage at Yahoo
An instance of Bullet is currently running at Yahoo in production against a small subset of Yahoo’s user engagement data stream. This data is roughly 100,000 records per second and is about 130 MB/s compressed. Bullet queries this with about 100 CPU Virtual Cores and 120 GB of RAM. This fits on less than 2 of our (64 Virtual Cores, 256 GB RAM each) test Storm cluster machines.
One of the most popular use cases at Yahoo is to use Bullet to manually validate the instrumentation of an app or web application. Instrumentation produces user engagement data like clicks, views, swipes, etc. Since this data powers everything we do from analytics to personalization to targeting, it is absolutely critical that the data is correct. The usage pattern is generally to:
Submit a Bullet query to obtain data associated with your mobile device or browser (filter on a cookie value or mobile device ID)
Open and use the application to generate the data while the Bullet query is running
Go back to Bullet and inspect the data
In addition, Bullet is also used programmatically in continuous delivery pipelines for functional testing instrumentation on product releases. Product usage is simulated, then data is generated and validated in seconds using Bullet. Bullet is orders of magnitude faster to use for this kind of validation and for general data exploration use cases, as opposed to waiting for the data to be available in Hive or other systems. The Bullet UI supports pivot tables and a multitude of charting options that may speed up analysis further compared to other querying options.
We also use Bullet to do a bunch of other interesting things, including instances where we dynamically compute cardinalities (using a Count Distinct Bullet query) of fields as a check to protect systems that can’t support extremely high cardinalities for fields like Druid.
What you do with Bullet is entirely determined by the data you put it on. If you put it on data that is essentially some set of performance metrics (data center statistics for example), you could be running a lot of queries that find the 95th and 99th percentile of a metric. If you put it on user engagement data, you could be validating instrumentation and mostly looking at raw data.
We hope you will find Bullet interesting and tell us how you use it. If you find something you want to change, improve, or fix, your contributions and ideas are always welcome! You can contact us here.
Today, we are pleased to offer Daytona, an open-source framework for automated performance testing and analysis, to the community. Daytona is an application-agnostic framework to conduct integrated performance testing and analysis with repeatable test execution, standardized reporting, and built-in profiling support.
Daytona gives you the capability to build a customized test harness in a single, unified framework to test and analyze the performance of any application. You’ll get easy repeatability, consistent reporting, and the ability to capture trends. Daytona’s UI accepts a performance testing script that can run on a command line. This includes websites, databases, networks, or any workload you need to test and tune for performance. You can submit tests to the scheduler queue from the Daytona UI or from your CI/CD tool. You can deploy Daytona as a hosted service in your on-prem environment or on the public cloud of your choice. In fact, you can even host test harnesses for multiple applications with a single centralized service so that developers, architects, and systems engineers from different parts of your organization can work together on a unified view and manage your performance analysis on a continuous basis.
Daytona’s differentiation lies in its ability to aggregate and present essential aspects of application, system, and hardware performance metrics with a simple and unified user interface. This helps you maintain your focus on performance analysis without changing context across various sources and formats of data. The overall goal of performance analysis is to find ways of maximizing application throughput with minimum hardware resource and the best user experience. Metrics and insights from Daytona help achieve this objective.
Prior to Daytona, we created multiple, heterogenous performance tools to meet the specific needs of various applications. This meant that we often stored test results inconsistently, making it harder to analyze performance in a comprehensive manner. We had a difficult time sharing results and analyzing differences in test runs in a standard manner, which could lead to confusion.
With Daytona, we are now able to integrate all our load testing tools under a single framework and aggregate test results in one common central repository. We are gaining insight into the performance characteristics of many of our applications on a continuous basis. These insights help us optimize our applications which results in better utilization of our hardware resources and helps improve user experience by reducing the latency to serve end-user requests. Ultimately, Daytona helps us reduce capital expenditure on our large-scale infrastructure and makes our applications more robust under load. Sharing performance results in a common format encourages the use of common optimization techniques that we can leverage across many different applications.
Daytona was built knowing that we would want to publish it as open source and share the technology with the community for validation and improvement of the framework. We hope the community can help extend its use cases and make it suitable for an even broader set of applications and workloads.
Architecture
Daytona is comprised of a centralized scheduler, a distributed set of agents running on SUTs (systems under test), a MySQL database to store all metadata for tests, and a PHP-based UI. A test harness can be customized by answering a simple set of questions about the application/workload. A test can be submitted to Daytona’s queue through the UI or through a CLI (Command Line Interface) from the CI/CD system. The scheduler process polls the database for a test to be run and sends all the actions associated with the execution of the test to the agent running on a SUT. An agent process executes the test, collects application and system performance metrics, and sends the metrics back as a package to the scheduler. The scheduler saves the test metadata in the database and test results in the local file system. Tests from multiple harnesses proceed concurrently.
Architecture and Life Cycle Of A Test
Looking Forward
Our goal is to integrate Daytona with popular open source CI/CD tools and we welcome contributions from the community to make that happen. It is available under Apache License Version 2.0. To evaluate Daytona, we provide simple instructions to deploy it on your in-house bare metal, VM, or public cloud infrastructure. We also provide instructions so you can quickly have a test and development environment up and running on your laptop with Docker. Please join us on the path of making application performance analysis an enjoyable and insightful experience. Visit the Daytona Yahoo repo to get started!
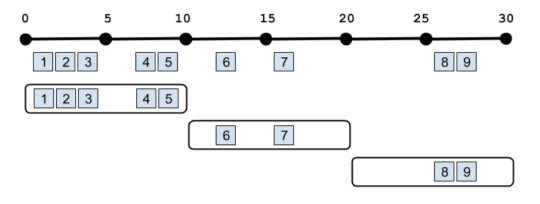
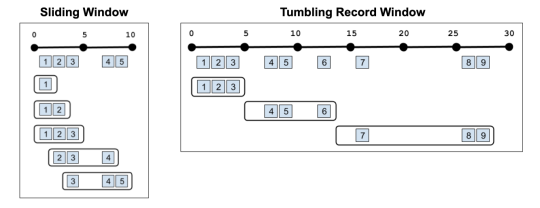
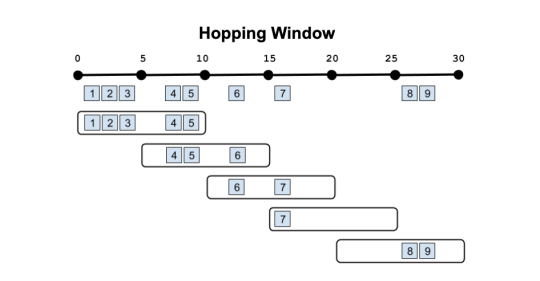
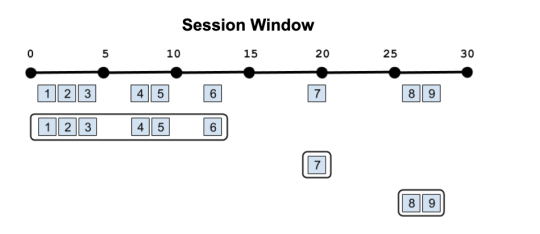
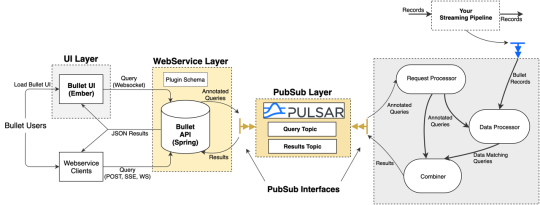


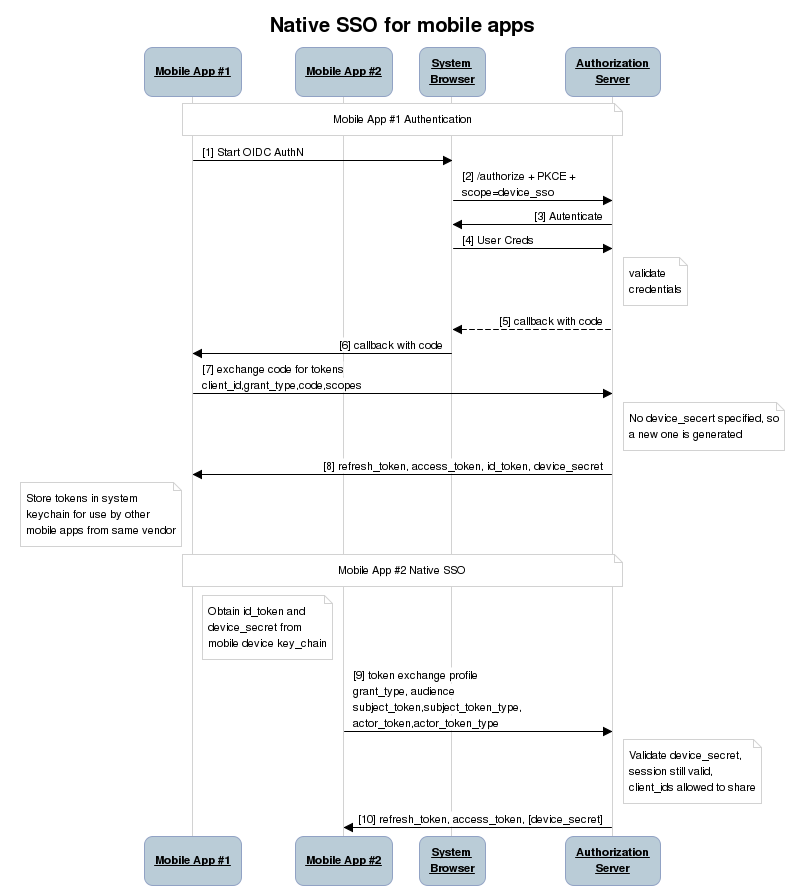
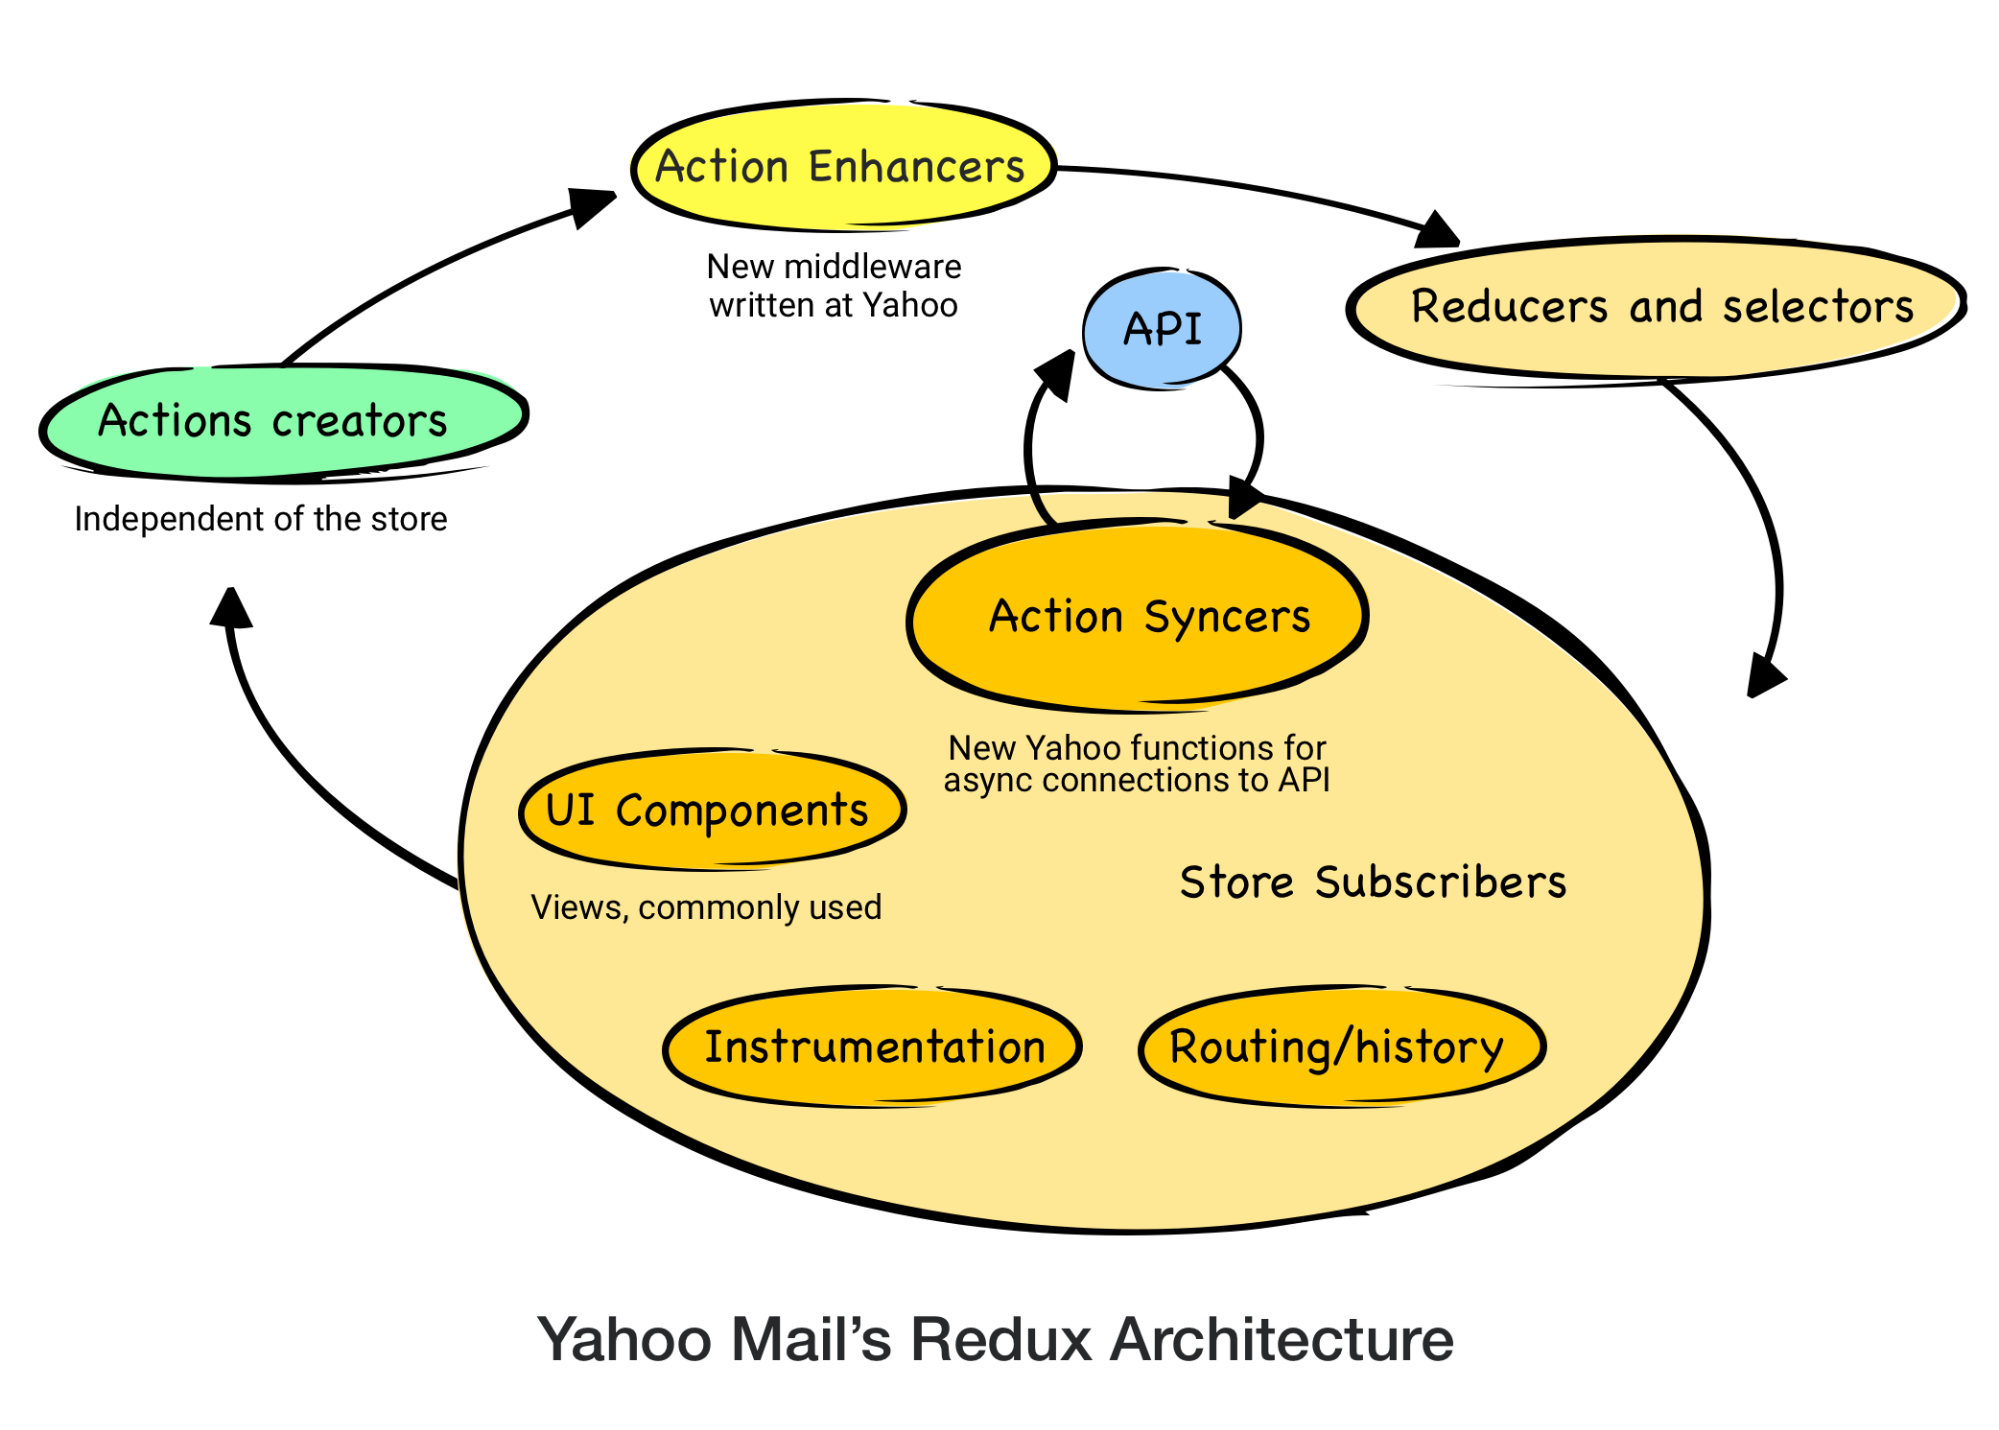


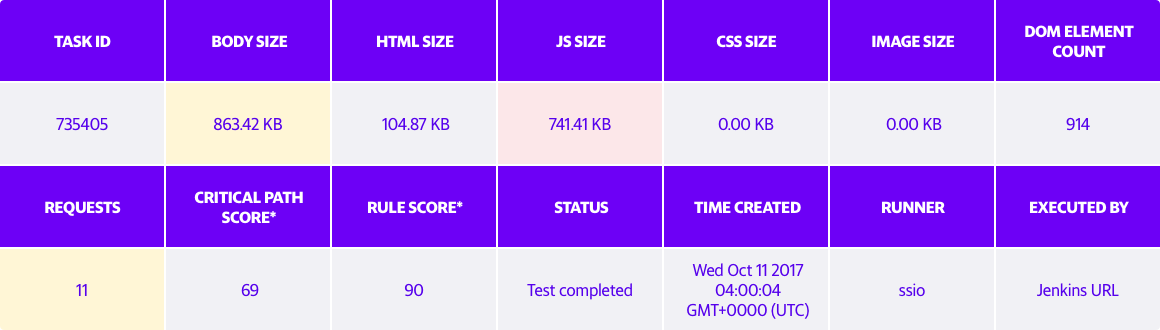
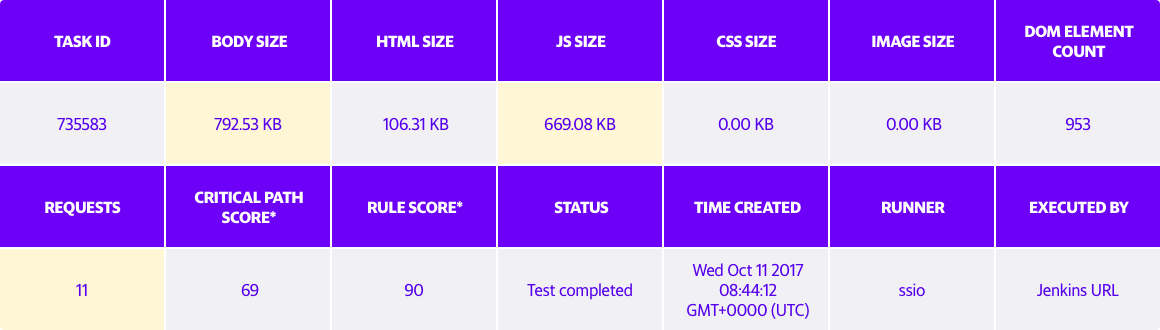
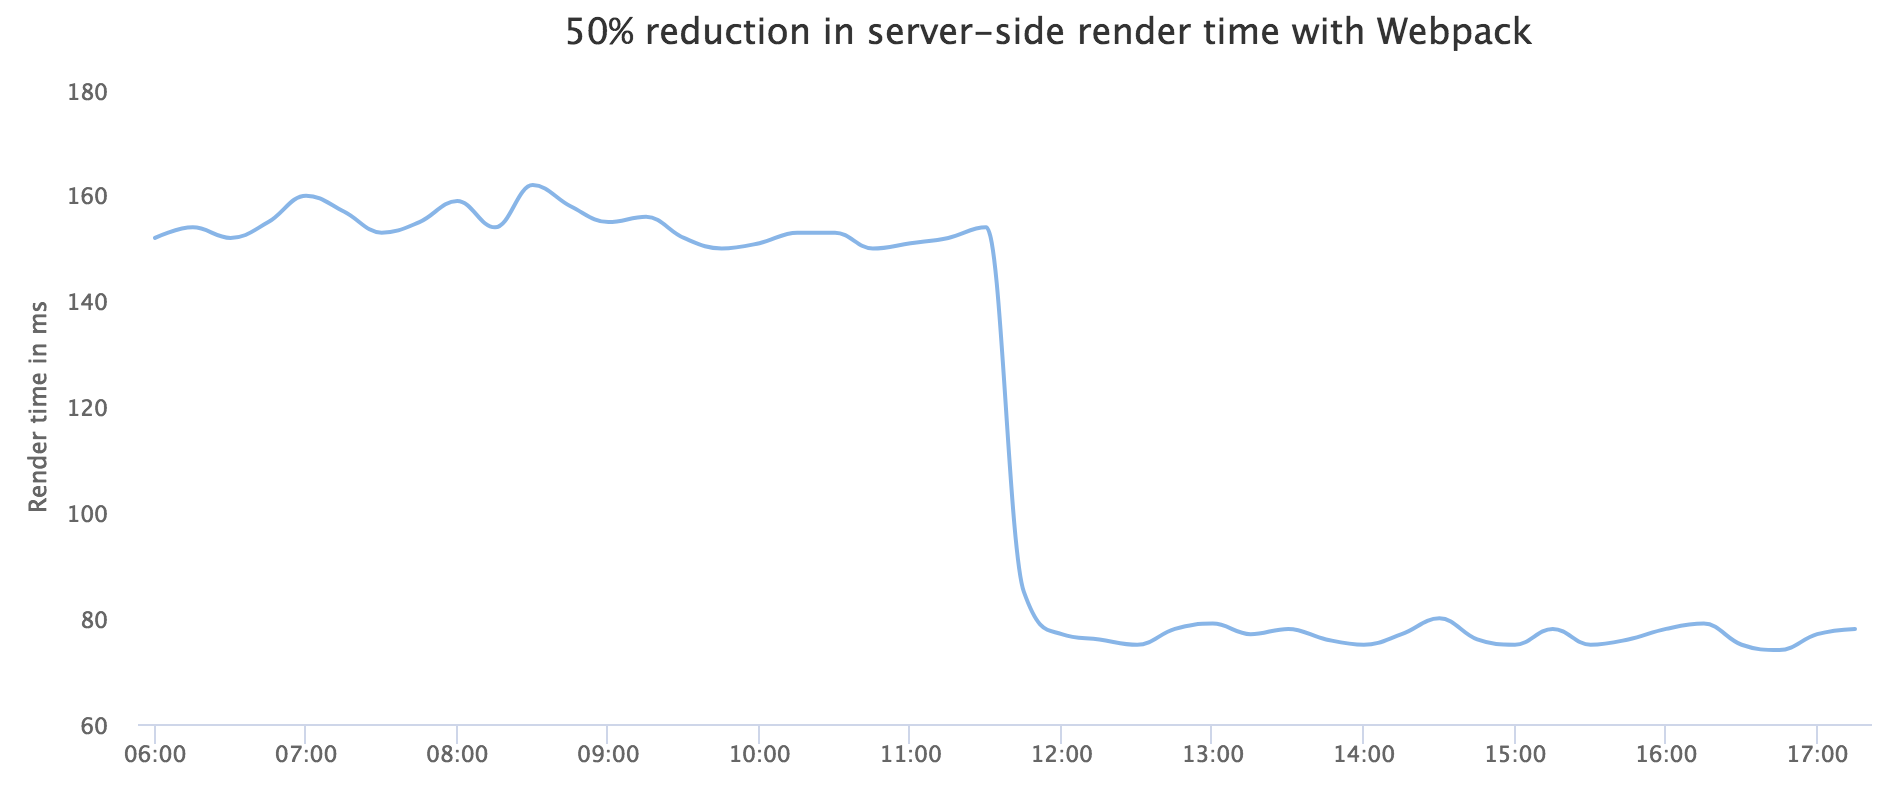
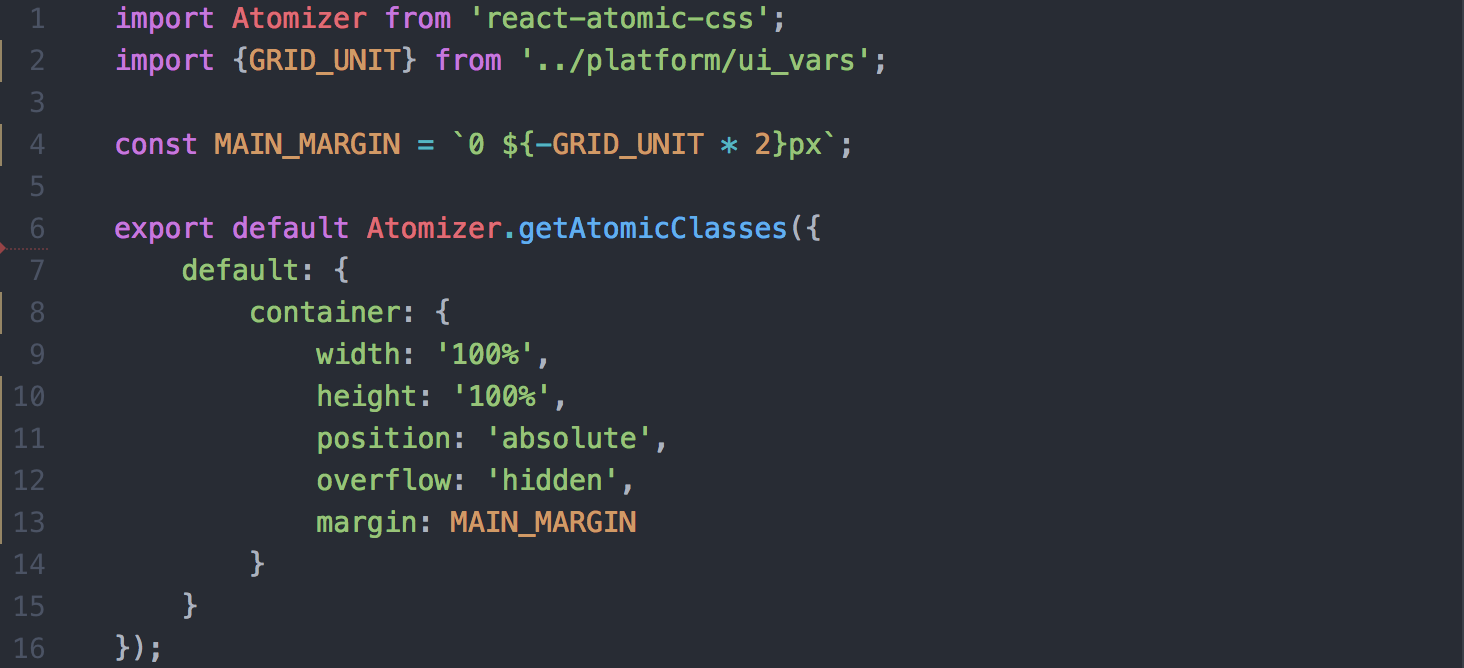
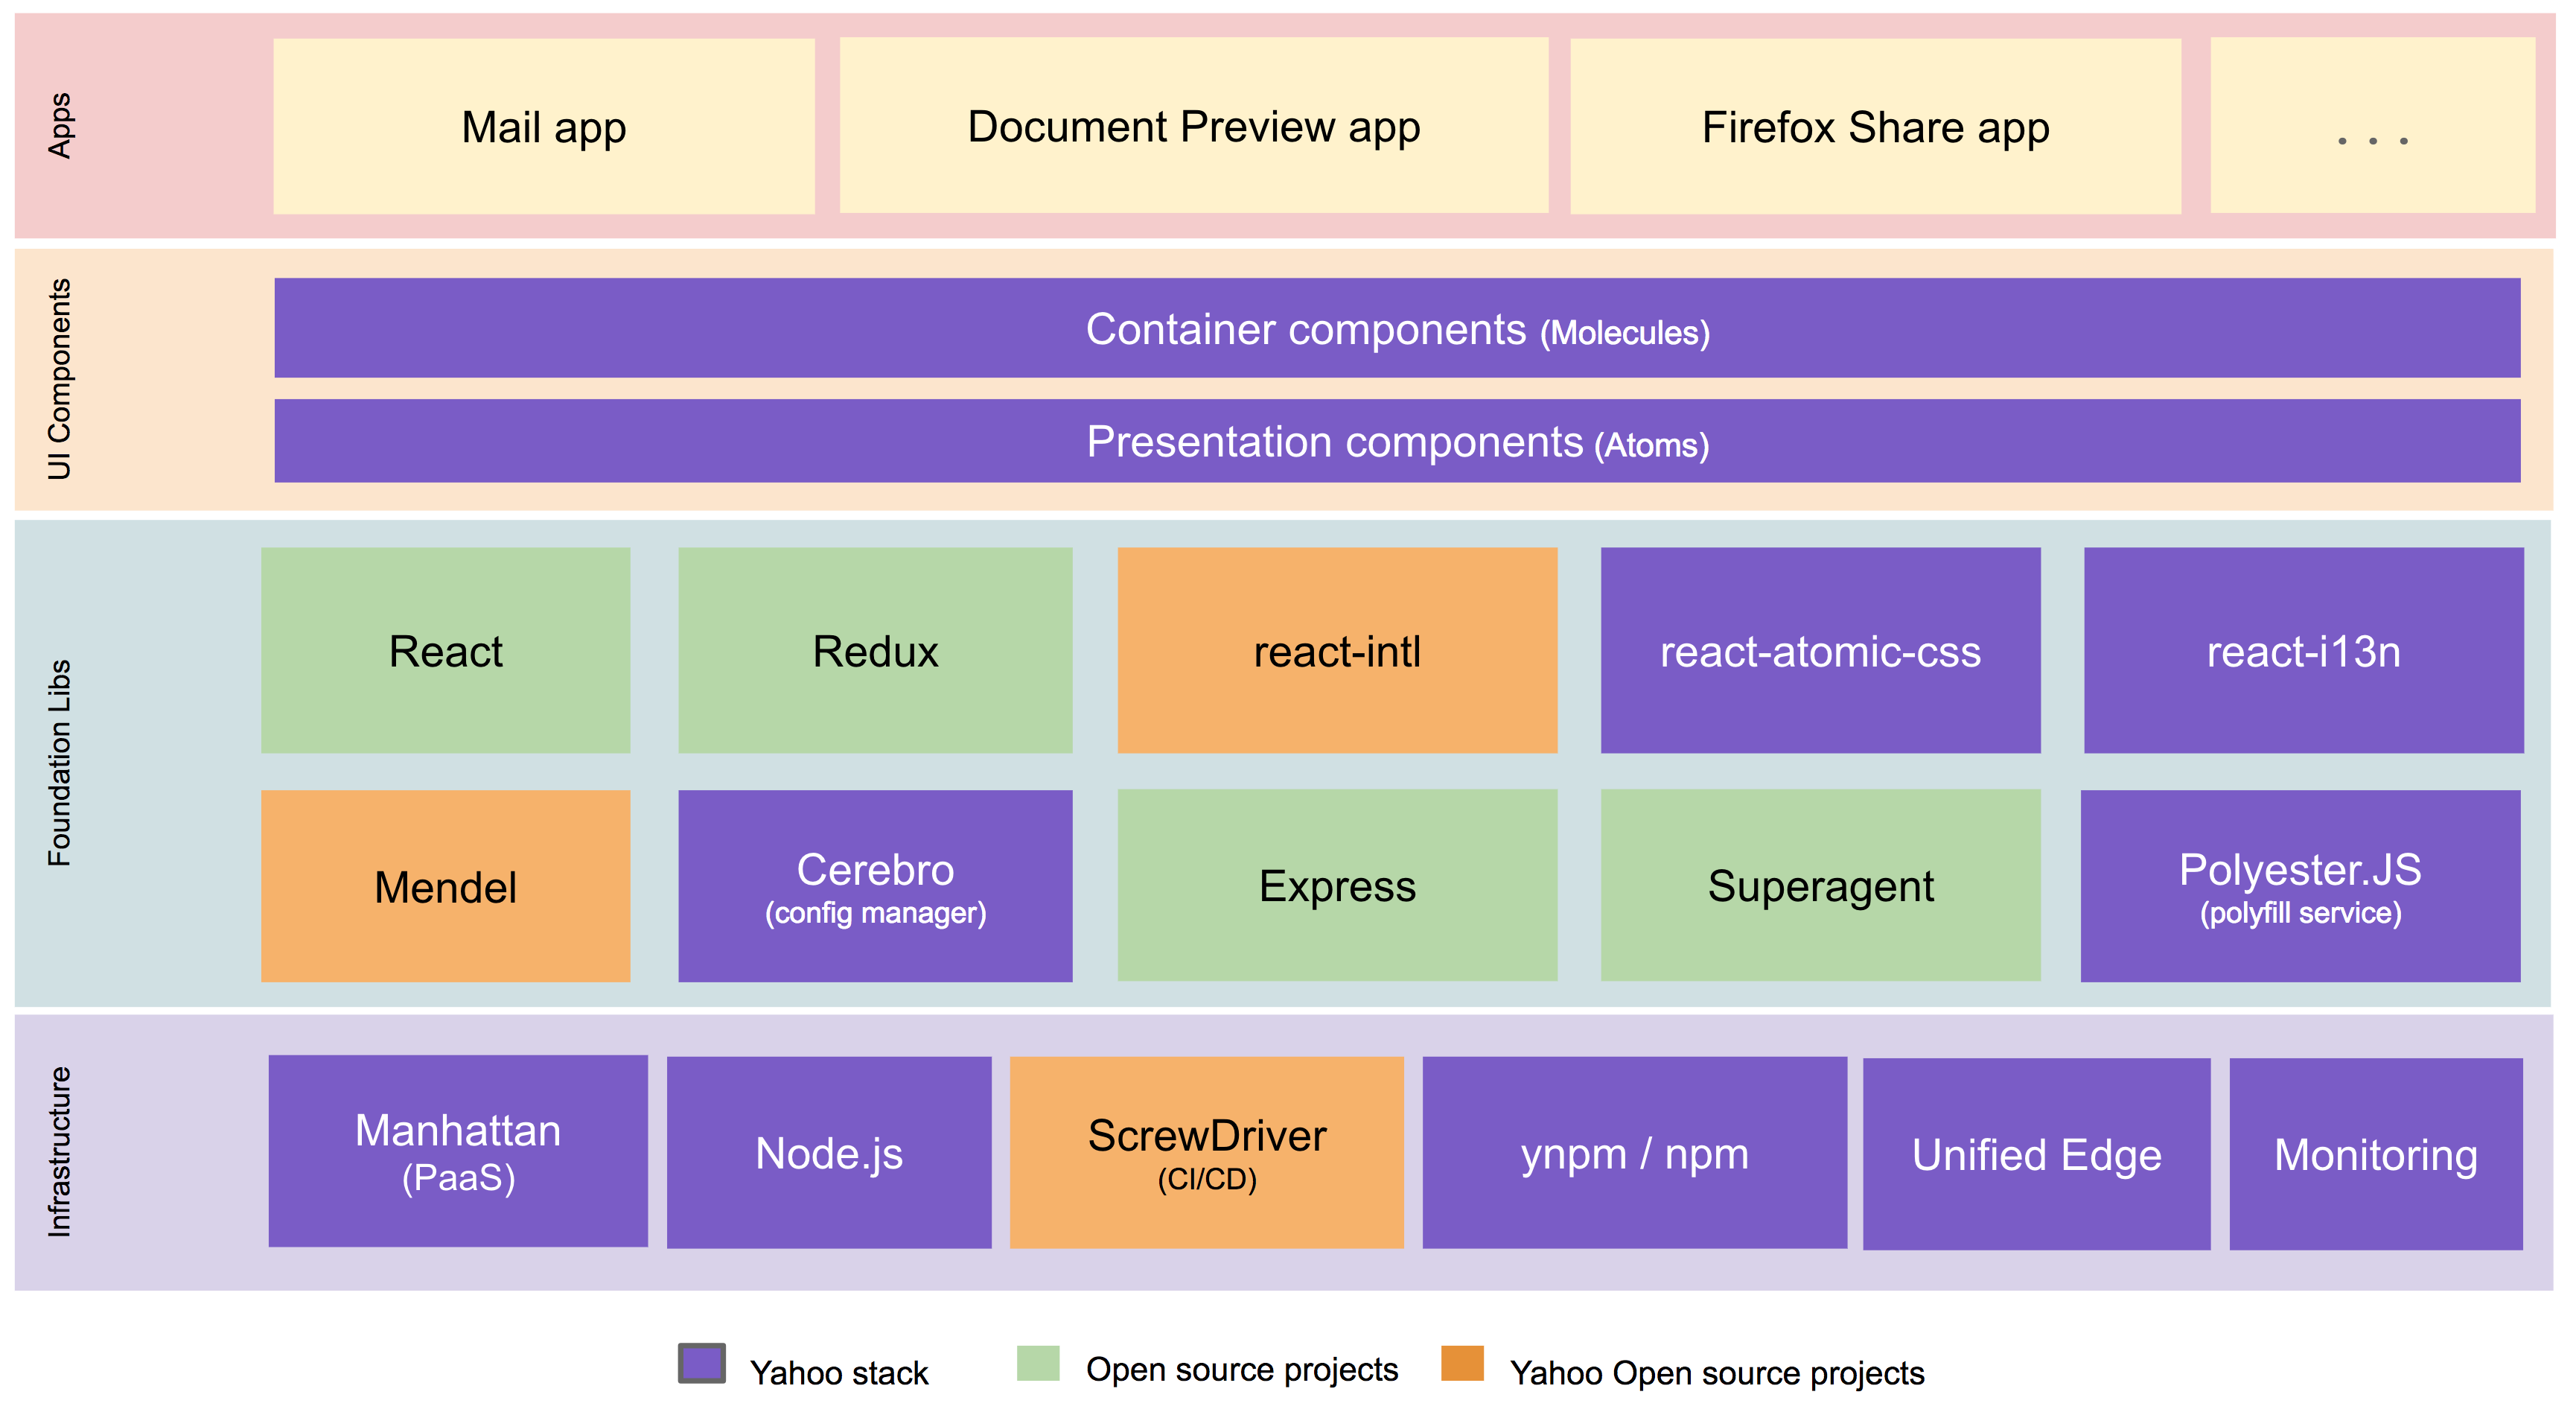
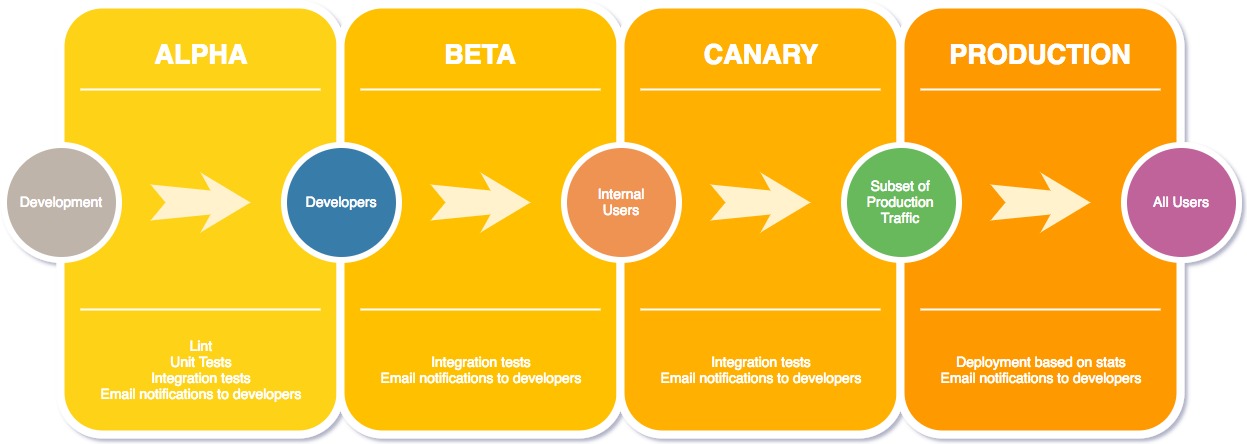


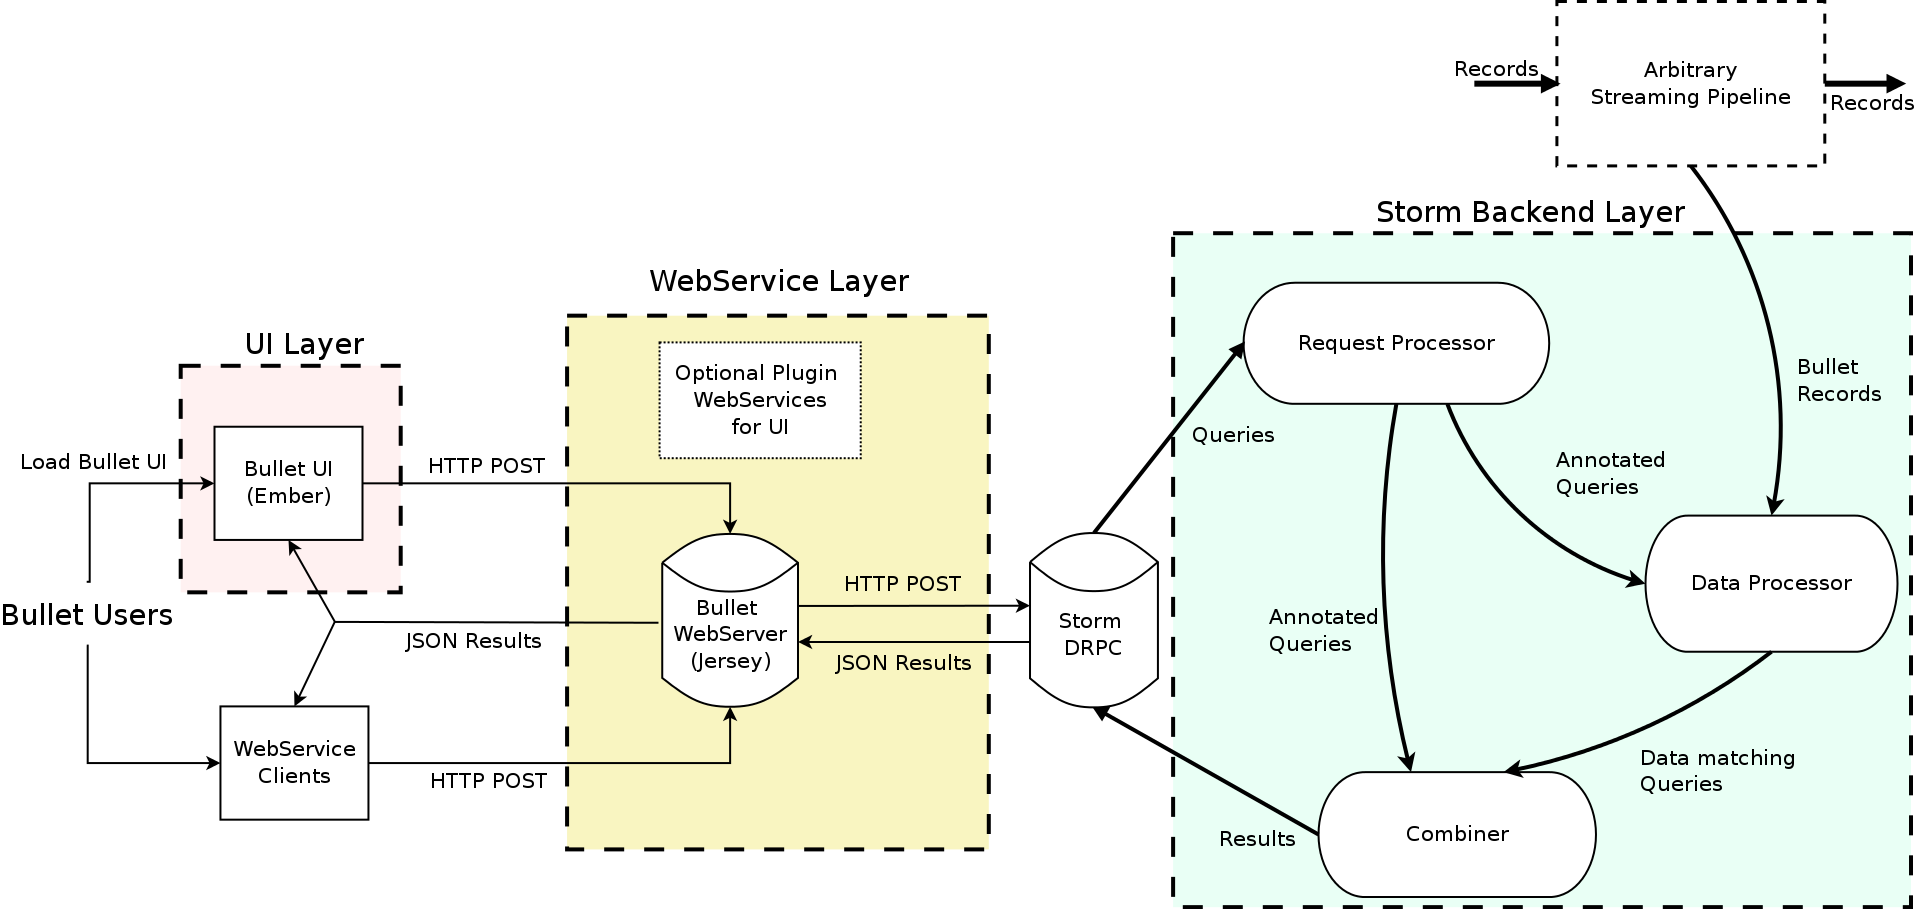