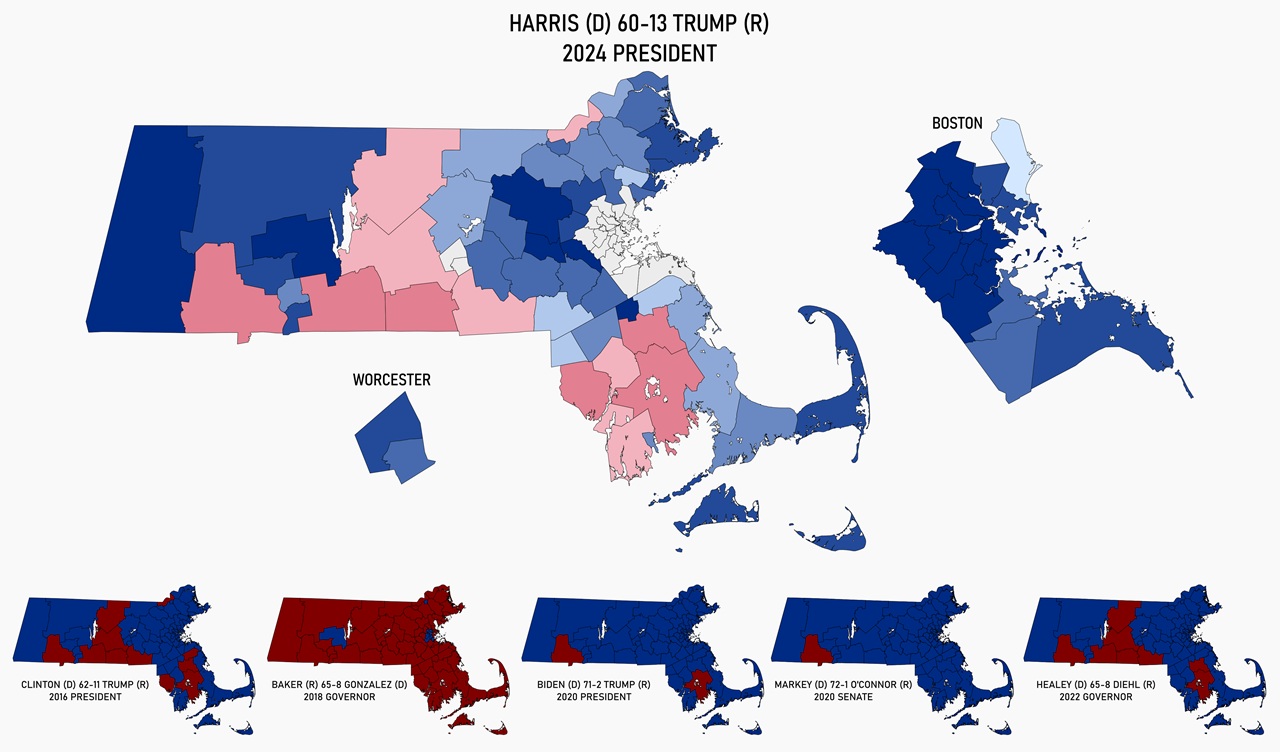
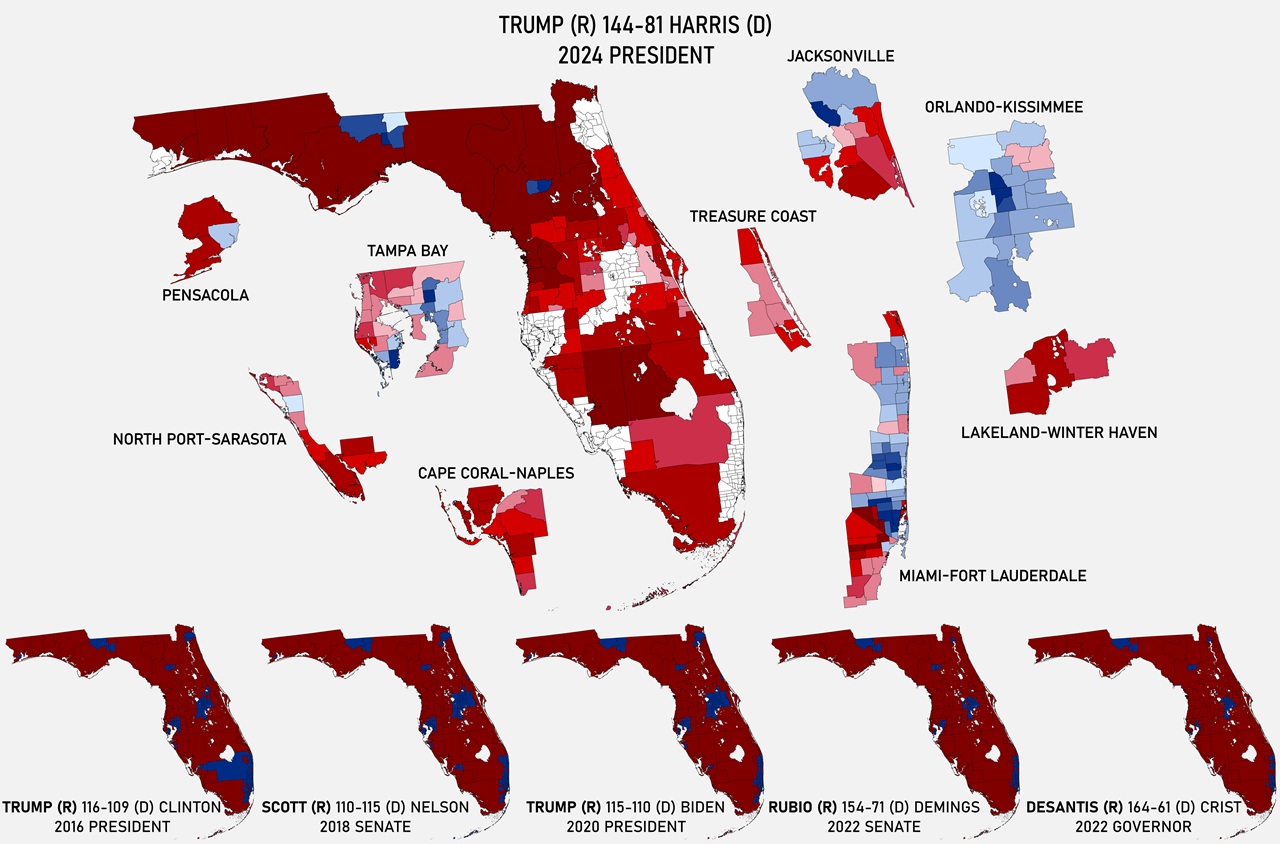
Map created by reddit user AegeanRepublic The map above shows what the US House would look like if it had 100k people per district vs the over 750k people per district today. Overall, you’d have a house with 3,350 members, which in this map would mean 1692 Democrats and 1658 Republicans. About the inserst: INSETS […]
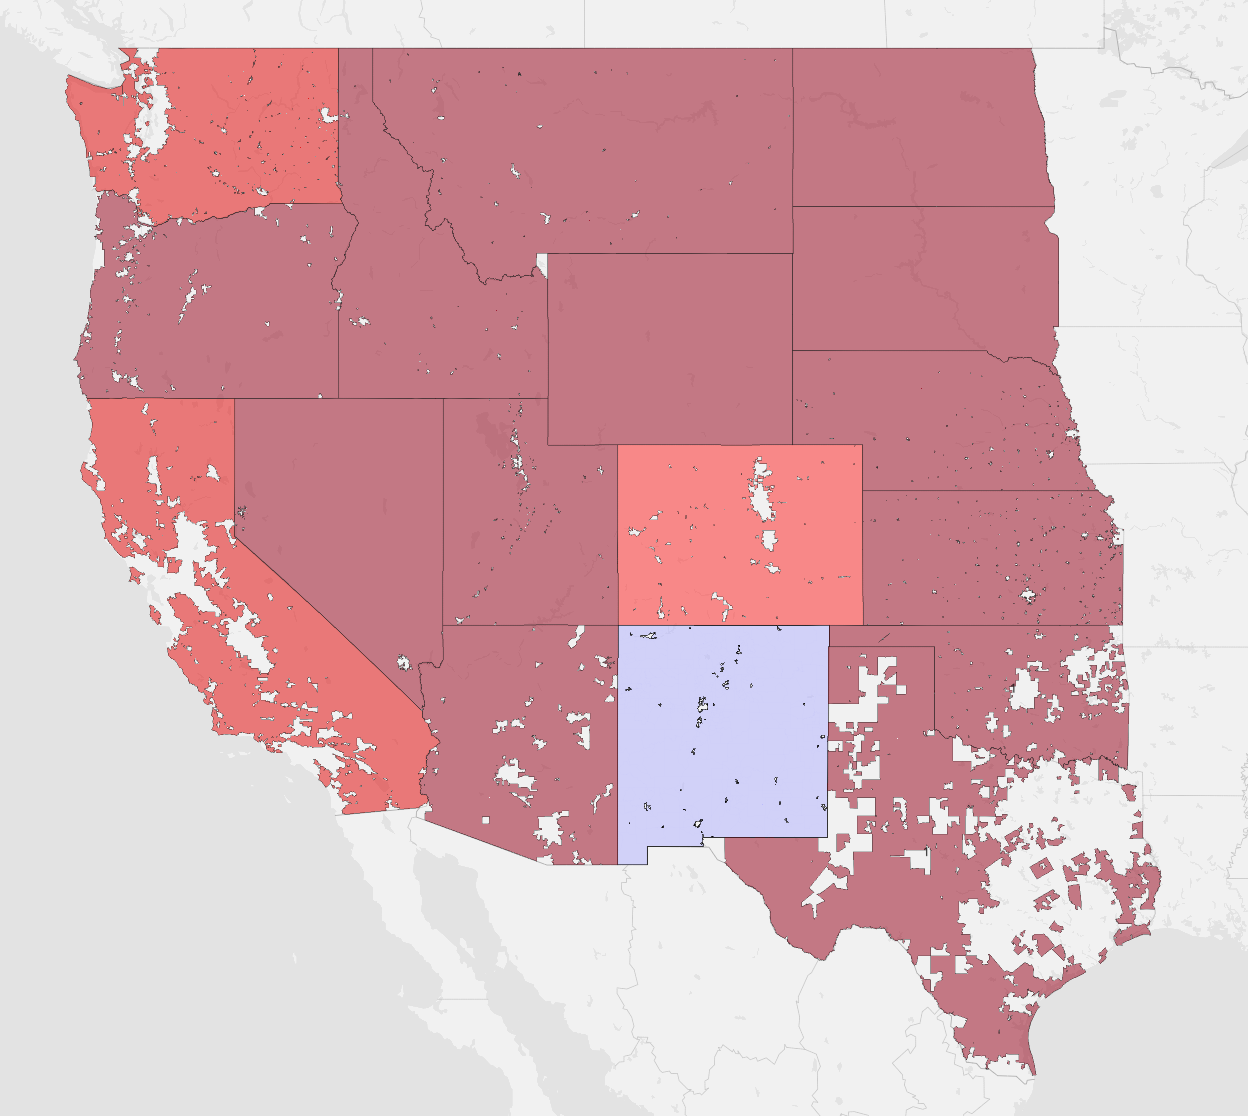
The map above was created by reddit user Tiny_Big_4998 who explains what it shows: It’s always been hard for me to wrap my head around the true scale of population density in the American West. I’m used to seeing maps on a county or state level, which really dilutes things through aggregation. I see that […]
Show full content
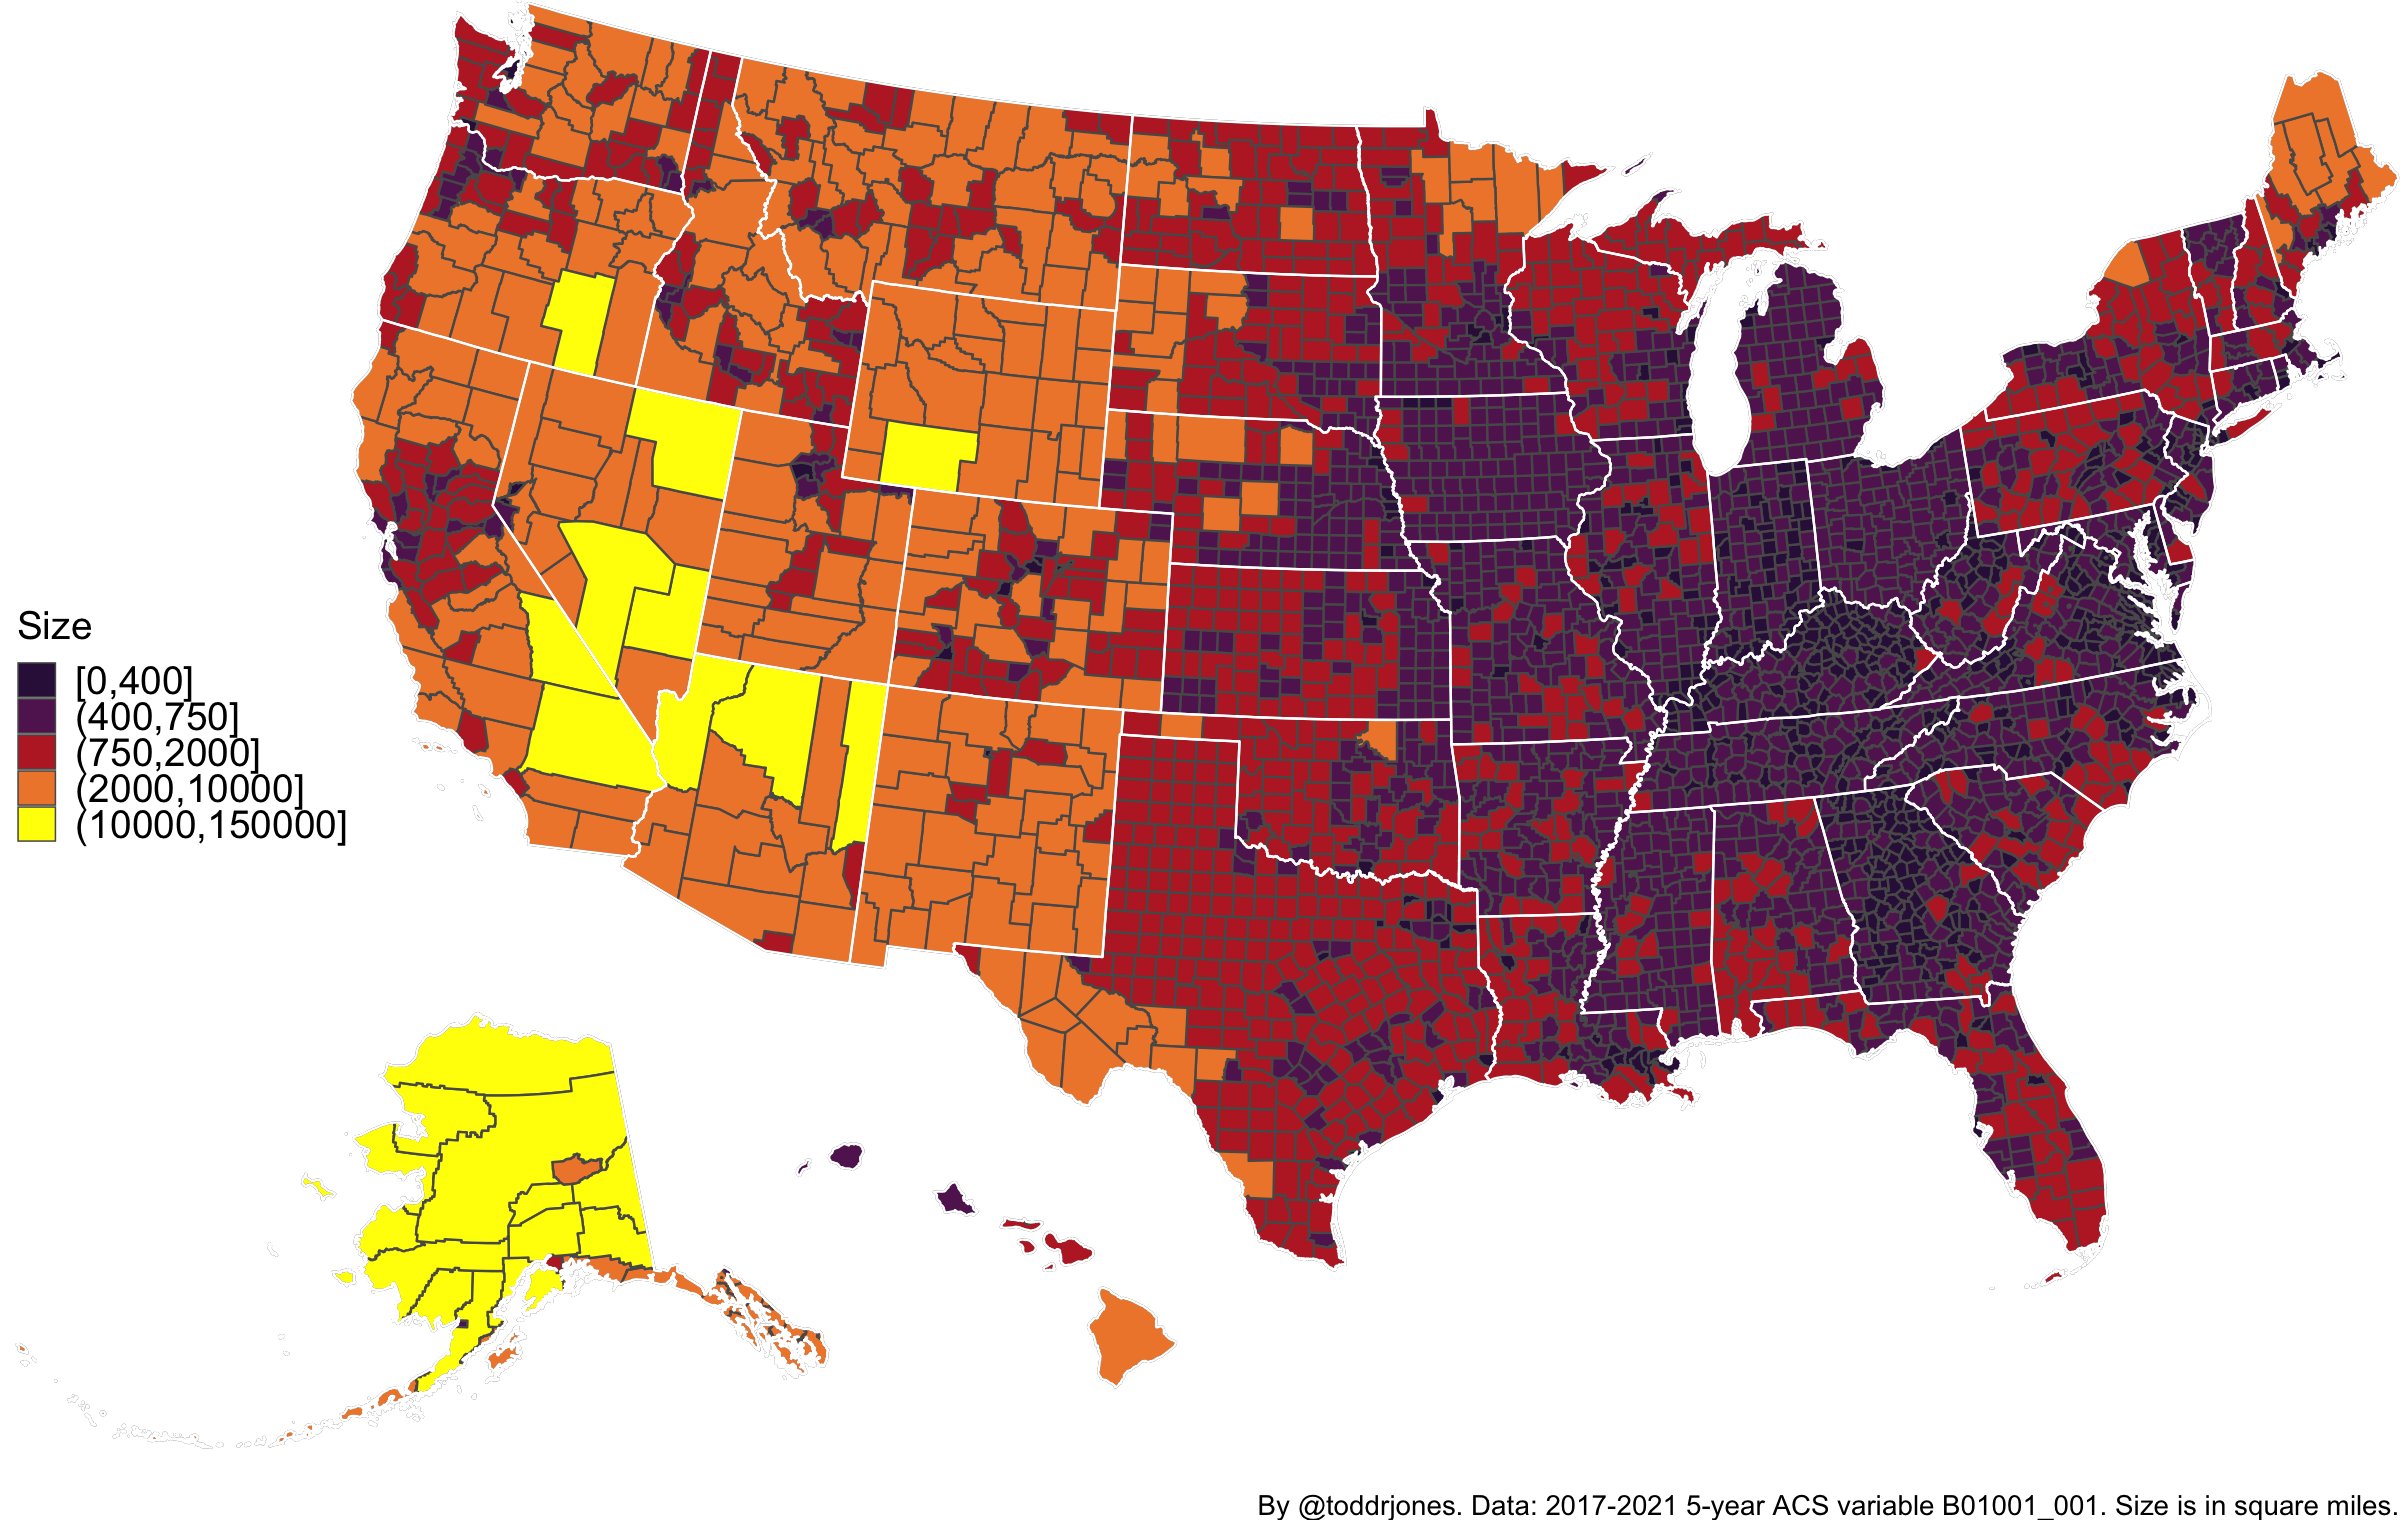
The map above was created by reddit user Tiny_Big_4998 who explains what it shows:
It’s always been hard for me to wrap my head around the true scale of population density in the American West.
I’m used to seeing maps on a county or state level, which really dilutes things through aggregation.
I see that a county has 20,000 people, and think “Wow, that’s really small.” Then, I find out that 17,000 of them live in 2 or 3 small towns, and think “holy shit, that’s unimaginably small.”
This map shows the largest possible (non-contiguous and absolutely illegal) congressional district in every western state.
Some, like California, were shockingly uncrowded (with 1/52nd of the population occupying ~85% of the space), while others like Montana or Idaho see half the population occupying well over 99.5% of the total area.
Oklahoma and Texas were surprising for the opposite reason— even the rural areas in the western half of the state were still pretty dense.
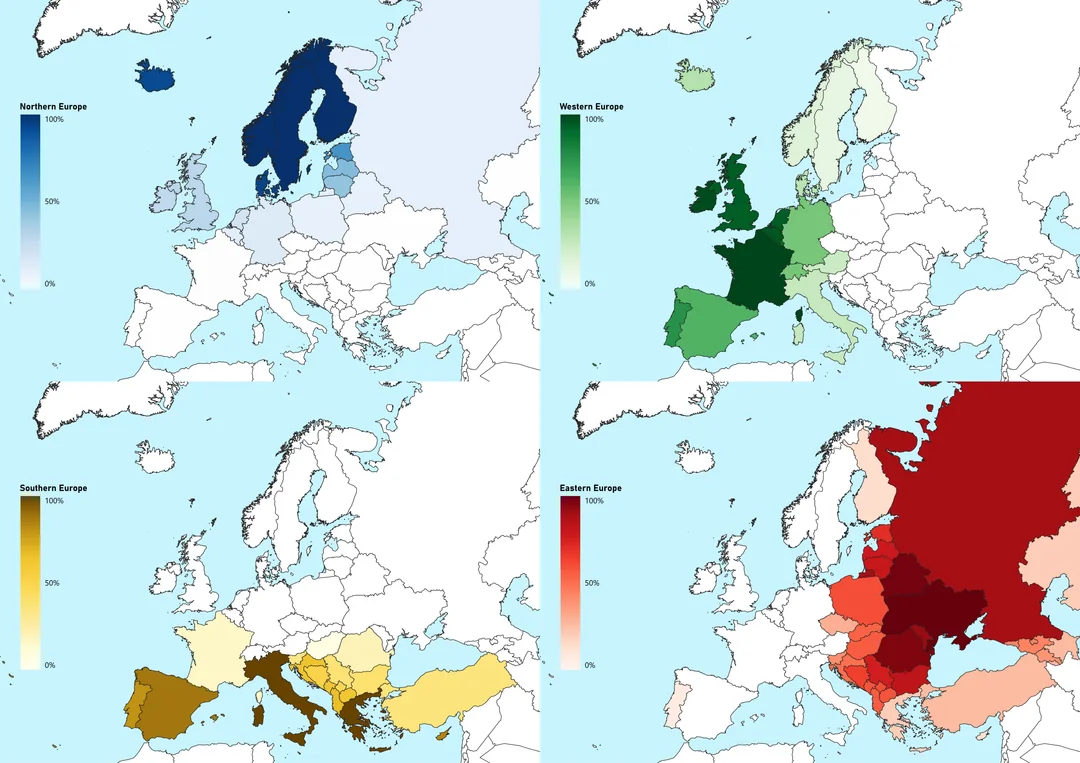
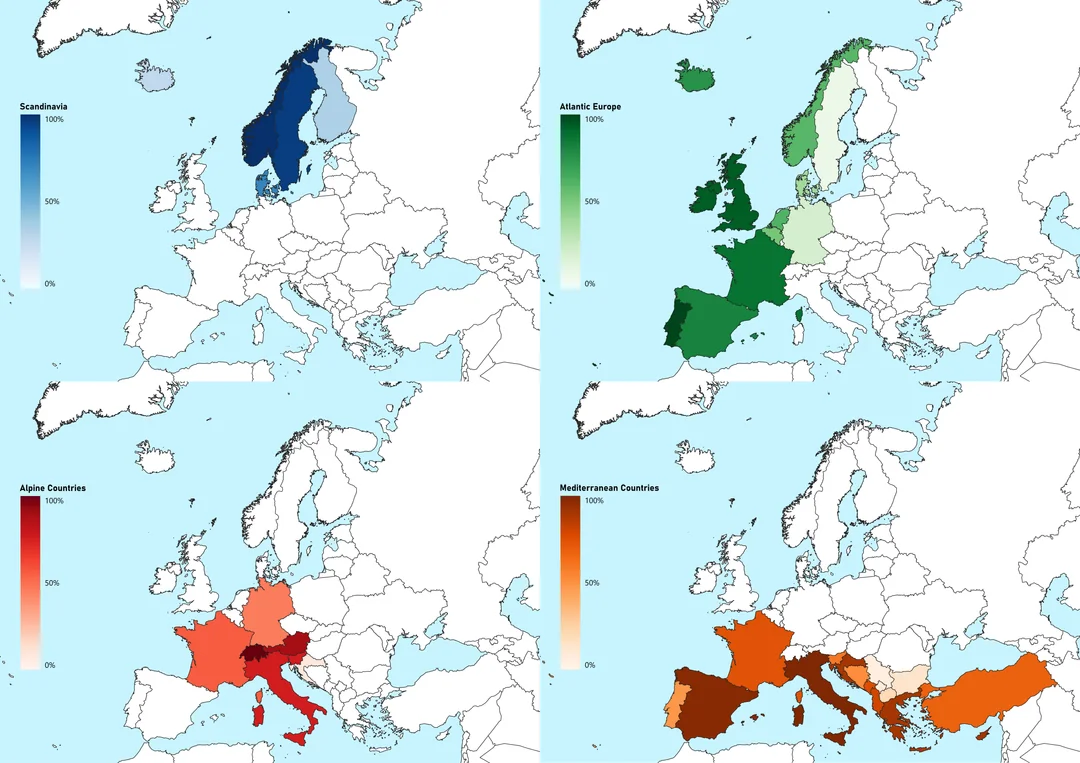
The following maps were all created by reddit user DM_me_fun_stuff_pls who explains: After my last post on the Regions of Europe, a week ago, I have gotten over 200 responses on my survey on it, thank you for that! So here are the results of the survey. Notes on the Survey and Map: Each category […]
Show full content
The following maps were all created by reddit user DM_me_fun_stuff_pls who explains:
After my last post on the Regions of Europe, a week ago, I have gotten over 200 responses on my survey on it, thank you for that! So here are the results of the survey.
Notes on the Survey and Map: Each category is normalized to the most voted country in each category. So 100% does not mean every single respondent chose this country but that it was the most chosen (although most of the times it was close).
It would probably be great and interesting to go into a lower level of subdivisions for some of these Regions, but honestly I don’t know how I would go about doing a survey for that, that is not a complete chore to respond to…
And now the maps:
Northern, Western, Southern & Eastern Europe
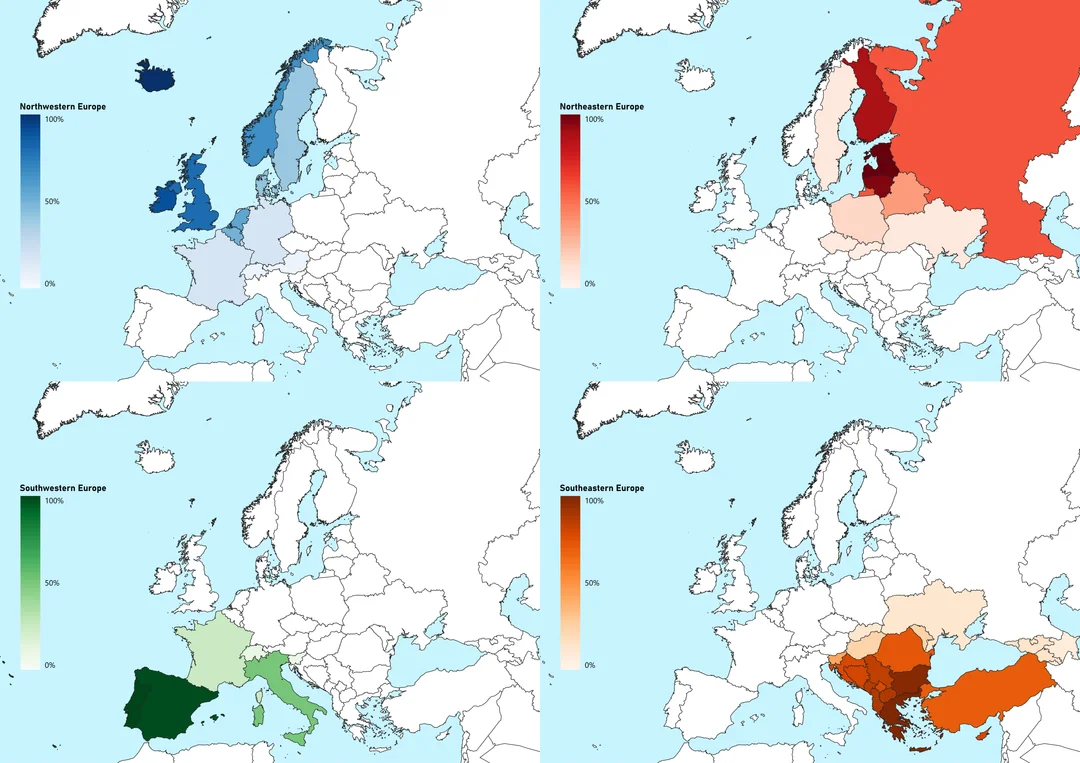
Northwestern, Northeastern, Southwestern & Southeastern Europe
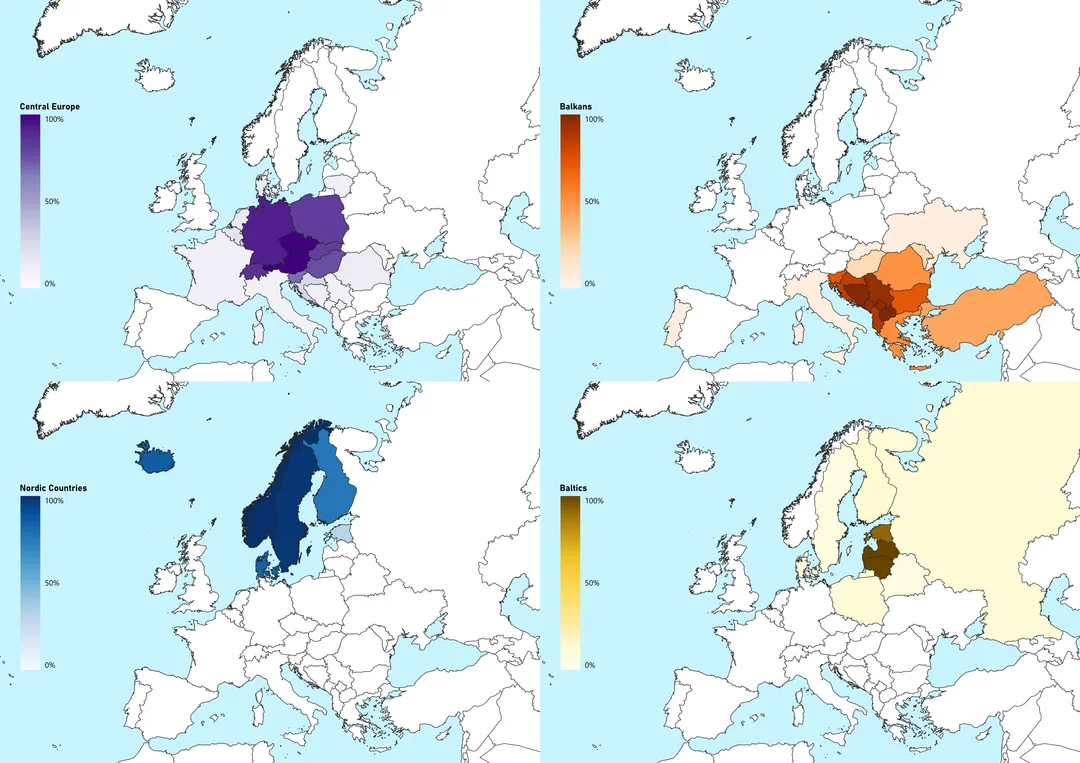
Central Europe, The Balkans, Nordic Countries, Baltic Countries
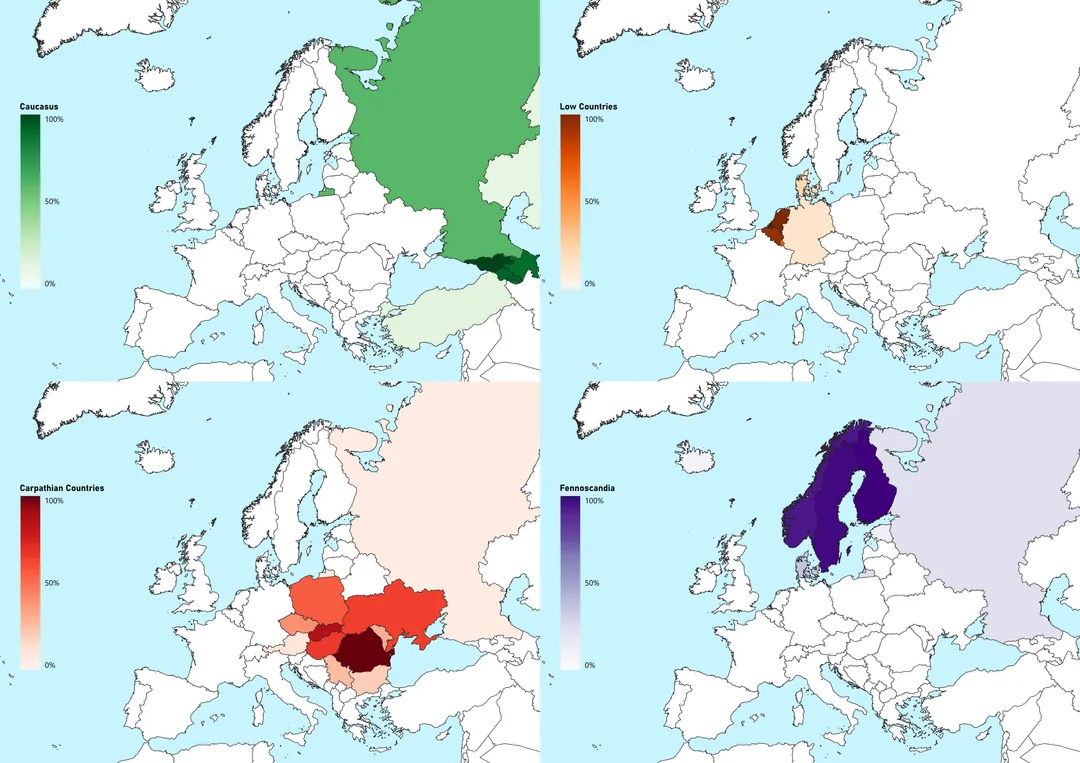
Caucus, Low Countries, Carpathians, & Fennoscandia Countries
Scandinavian, Atlantic, Alpine, & Mediterranean Countries
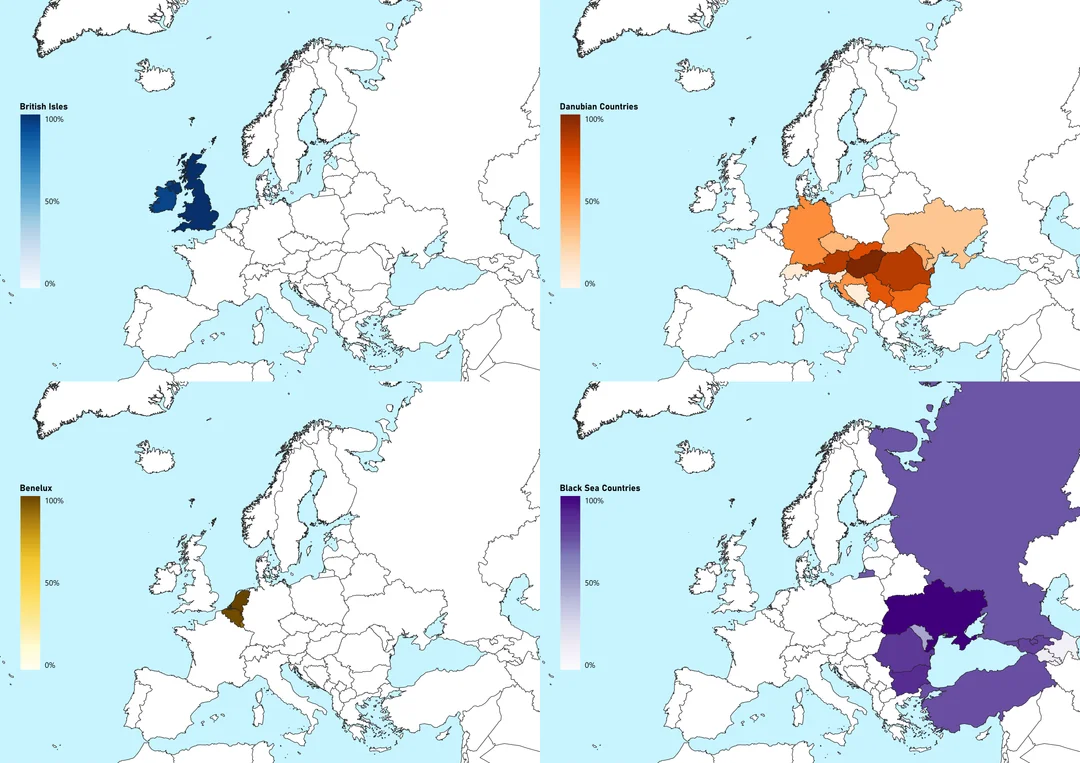
British Isles, Danubian, Benelux & Black Sea Countries
A few questions were asked about the map including:
Its a joke here on Reddit, since in many maps it appears in similar categories as the Balkan countries.
The Joke is popular enough for it to show up on the map. I wasn’t sure how to deal with it, since it was obvious Joke answers, but at the same time if I started removing “Joke answers” it would have been pretty hard to decide which would count as such (For example quite a few people voted for Britain not being part of Europe, that could either be a joke or it could be about it not being part of the European mainland).
So for the sake of Data sanctity I left it all as is.
The only Filter I employed is extending the white color of 0% up to 2%, to filter out random noise, since there were a handful of people that sometimes gave pretty random answers. So as you can see over 2% of people have voted for Portugal to be Eastern Europe and Balkans…
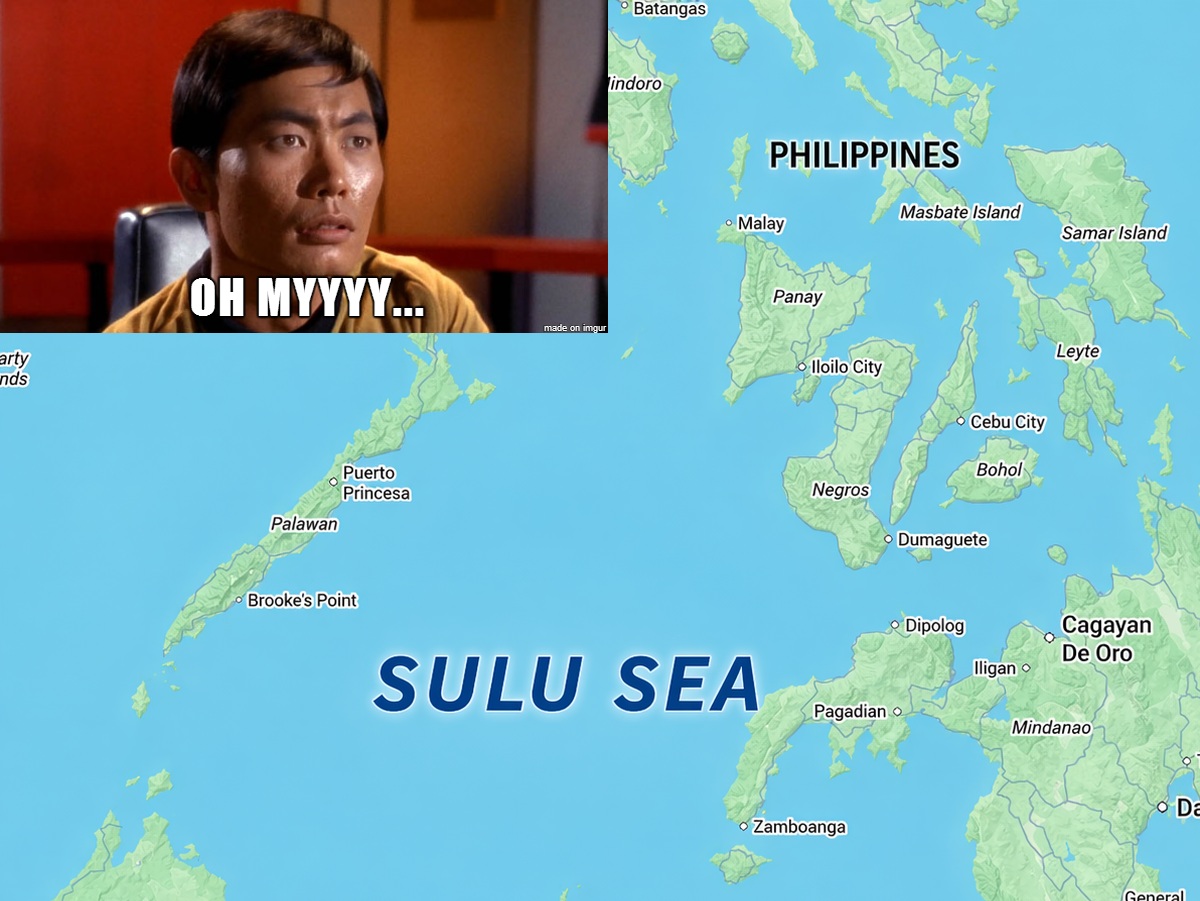
Above is a map the Sulu Sea between the Philippines and Borneo. More about the Sea and its connection to Star Trek below: The Sulu Sea is a deep, semi-enclosed sea in Philippines, bordered by Palawan to the northwest, the Visayas to the northeast, and Mindanao to the southeast. To the southwest, it opens toward […]
Show full content
Above is a map the Sulu Sea between the Philippines and Borneo.
More about the Sea and its connection to Star Trek below:
The Sulu Sea is a deep, semi-enclosed sea in Philippines, bordered by Palawan to the northwest, the Visayas to the northeast, and Mindanao to the southeast.
To the southwest, it opens toward Borneo.
Geography
Deep basin: Parts exceed 5,000 meters (16,400 ft), making it one of the deeper seas in Southeast Asia.
Natural boundaries: Surrounded by island arcs like the Sulu Archipelago, which act like a partial barrier to ocean currents.
Coral ecosystems: Home to the Tubbataha Reefs Natural Park, a UNESCO World Heritage Site and one of the most biodiverse reef systems on Earth.
Limited water exchange: Narrow straits connect it to nearby seas (like the South China Sea), which creates distinct circulation patterns and high marine productivity.
This combination of depth, isolation, and reef systems makes the Sulu Sea a kind of “marine laboratory.”
Economic Importance
The Sulu Sea plays a major role in the regional economy:
Fisheries
One of the Philippines’ most productive fishing grounds
Supports tuna, sardines, and reef fish industries
Provides livelihoods for millions of coastal residents
Shipping & Trade
Serves as a regional maritime corridor between the Pacific and the South China Sea
Important for domestic shipping between Philippine islands
Natural Resources
Potential reserves of oil and natural gas (though not fully developed)
Rich marine biodiversity also supports eco-tourism
Tourism
Diving hotspots (especially Tubbataha) attract global visitors
Coral reefs, clear waters, and marine life are major draws
However, the region also faces challenges:
Overfishing
Coral reef degradation
Maritime security issues in parts of the Sulu Archipelago
Connection to Star Trek
At first glance, the Sulu Sea and Star Trek seem unrelated, but there’s a fun cultural link:
Hikaru Sulu
The character Hikaru Sulu from Star Trek was named “Sulu” deliberately.
Creator Gene Roddenberry chose the name to reflect a pan-Asian identity, rather than tying the character to one specific nationality.
The Sulu Sea was selected because it is a neutral, geographically broad reference in Asia.
This aligned with Star Trek’s vision of a unified, multicultural future.
So while the sea itself doesn’t appear in the show, its name lives on in one of Starfleet’s most iconic officers.
The map above shows the shortest scheduled passenger flight in the world is between the Orkney islands of Westray and Papa Westray in northern Scotland, the flight is 1.7 miles (2.7 km) long and takes around 1 minute! But why does it exist? The flight between Westray and Papa Westray exists mainly because it’s the […]
Show full content
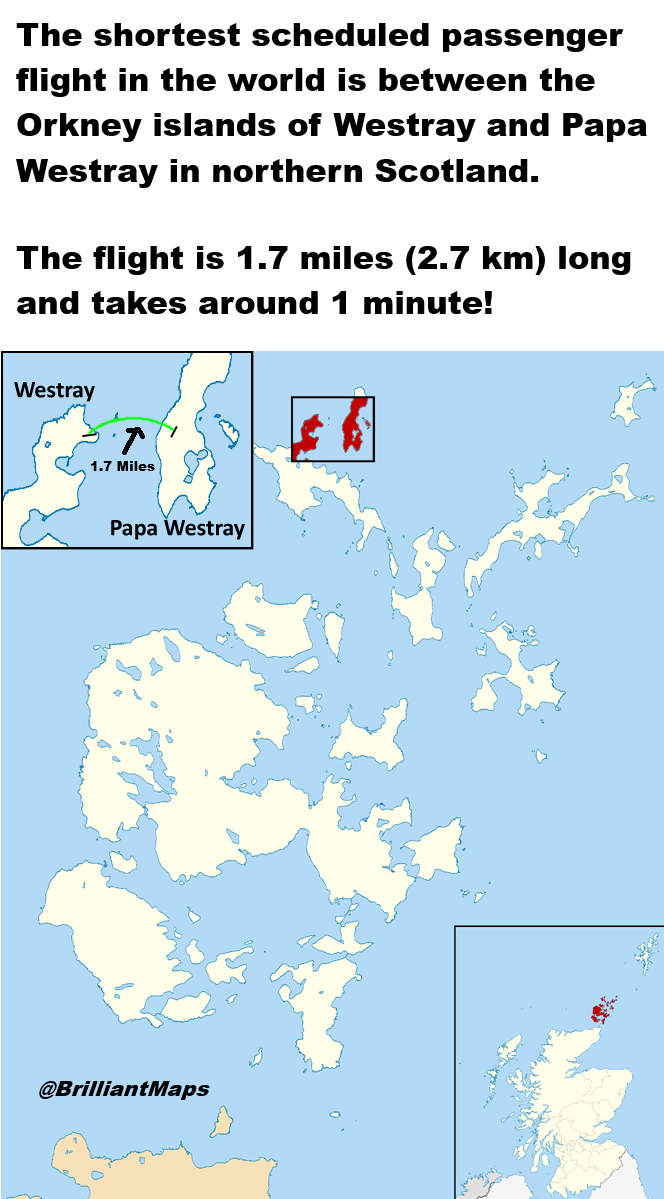
The map above shows the shortest scheduled passenger flight in the world is between the Orkney islands of Westray and Papa Westray in northern Scotland, the flight is 1.7 miles (2.7 km) long and takes around 1 minute!
But why does it exist?
The flight between Westray and Papa Westray exists mainly because it’s the most practical way to connect the two very small, remote islands.
Here’s the short version:
Distance is tiny, but conditions aren’t: The islands are only about 1.7 miles (2.7 km) apart, but the waters between them can be rough, windy, and unpredictable, making regular ferry service less reliable for such a short crossing.
Population is very small: Papa Westray has only a few dozen residents. Building and maintaining a bridge would be extremely expensive relative to the number of people using it.
Ferry isn’t efficient enough: There is a ferry, but it’s slower and not always ideal for urgent trips like medical visits, school travel, or mail delivery.
Flights are fast and flexible: The flight (operated by Loganair) takes under two minutes, making it the shortest scheduled commercial flight in the world. It’s quick, relatively cost-effective, and fits the needs of the community.
In short, the flight exists because it’s the cheapest and most reliable solution for such a small, remote population, even if it seems unusual given the short distance.
10 Fun facts About the route
It’s incredibly short: As mentioned abovetThe route is just 1.7 miles (2.7 km) long, roughly the same as the runway at Edinburgh Airport!
It’s the shortest scheduled flight in the world: The journey can take under a minute, with a record of 53 seconds.
Flights run daily: Services operate every day, but with different directions on weekends.
Weekend flights are one-way only: Saturdays have flights from Westray to Papa Westray, while Sundays go the opposite direction.
A record-setting pilot flew it most: Stuart Linklater completed over 12,000 flights on this route before retiring in 2013.
It mainly serves locals and students: Many passengers are school groups visiting archaeological sites on Papa Westray.
It’s also used for healthcare access: Residents (around 90 people) rely on it for medical trips and visiting professionals.
Tourists ride it for the novelty: The route attracts visitors wanting to experience the world’s shortest commercial flight.
Passenger numbers are modest: The route carries about 5,000 passengers per year.
It uses a rugged small aircraft: Flights are operated by Loganair using the Britten-Norman BN-2 Islander, chosen for its ability to handle short runways and harsh weather.
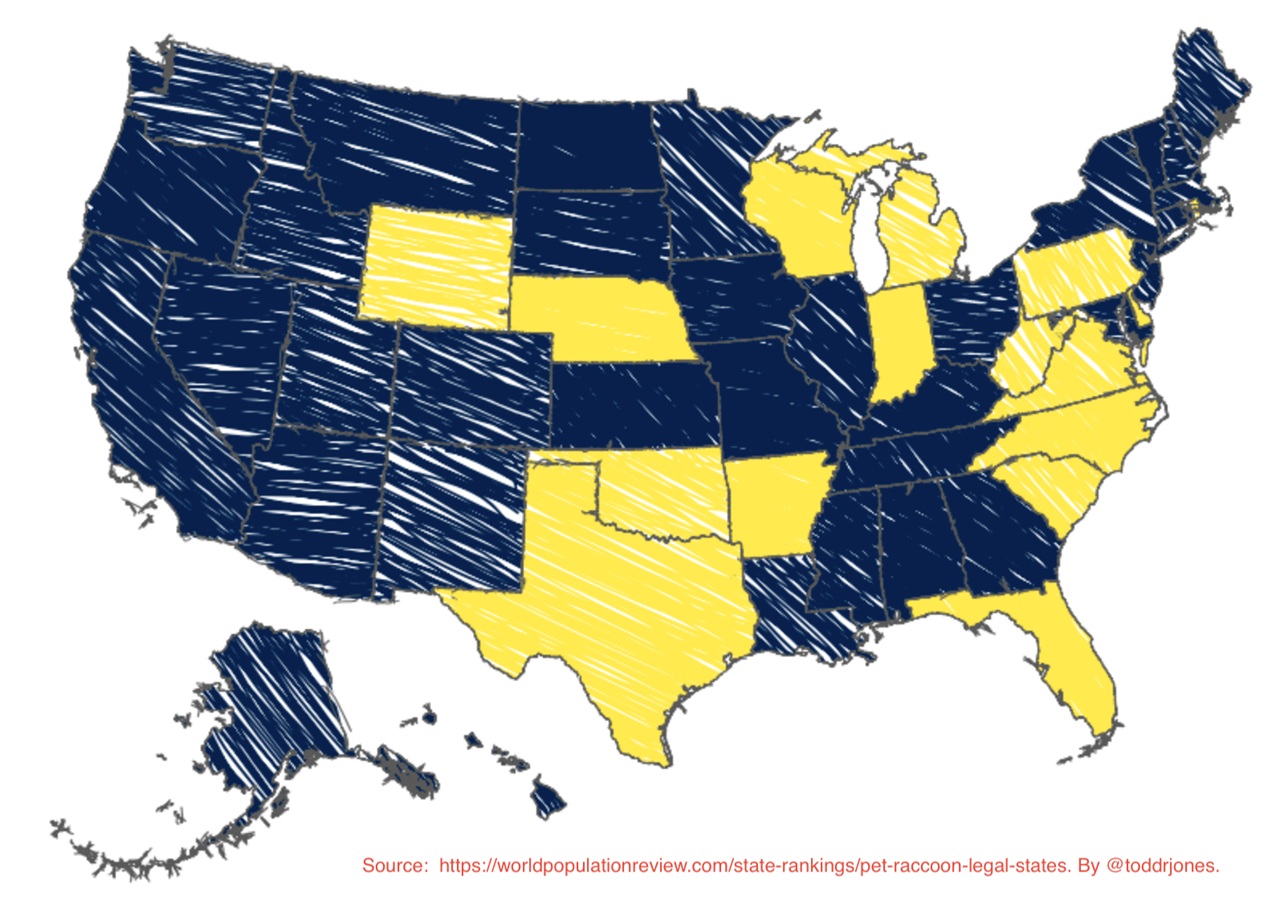
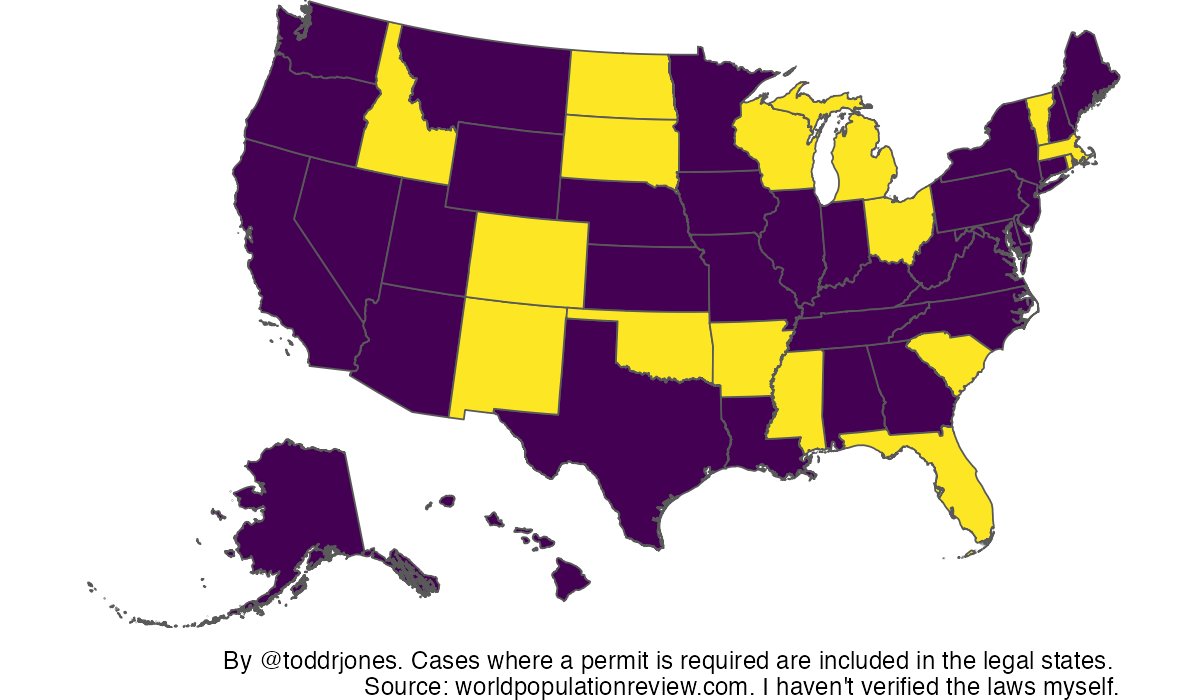
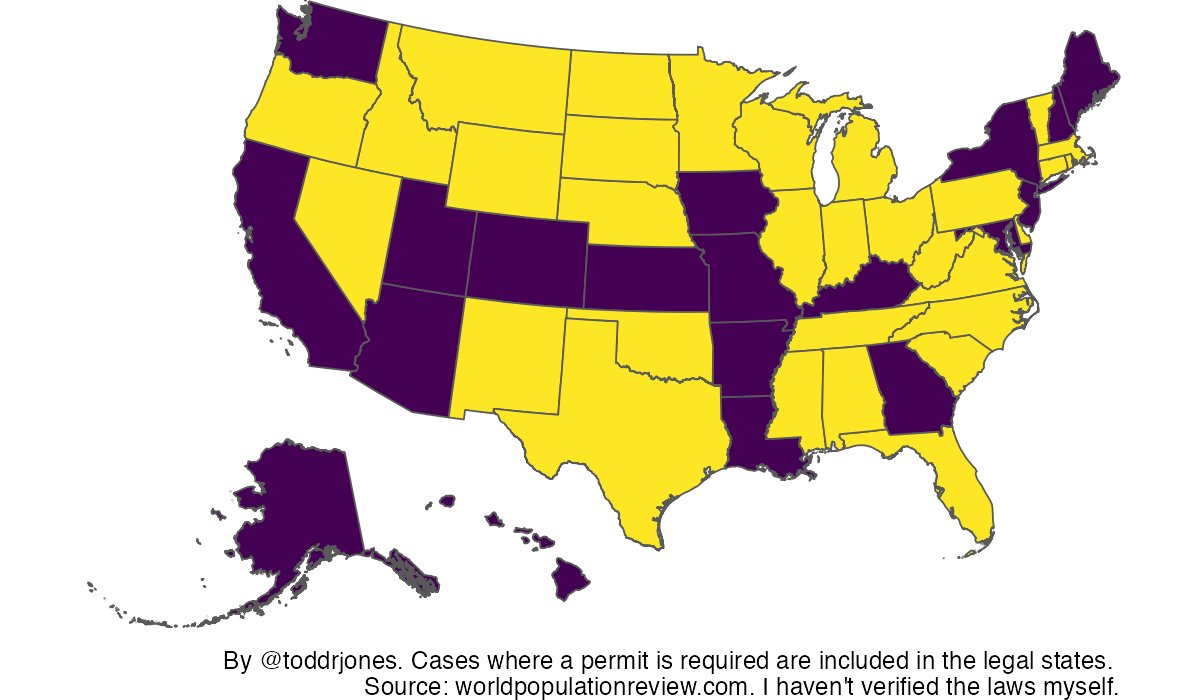
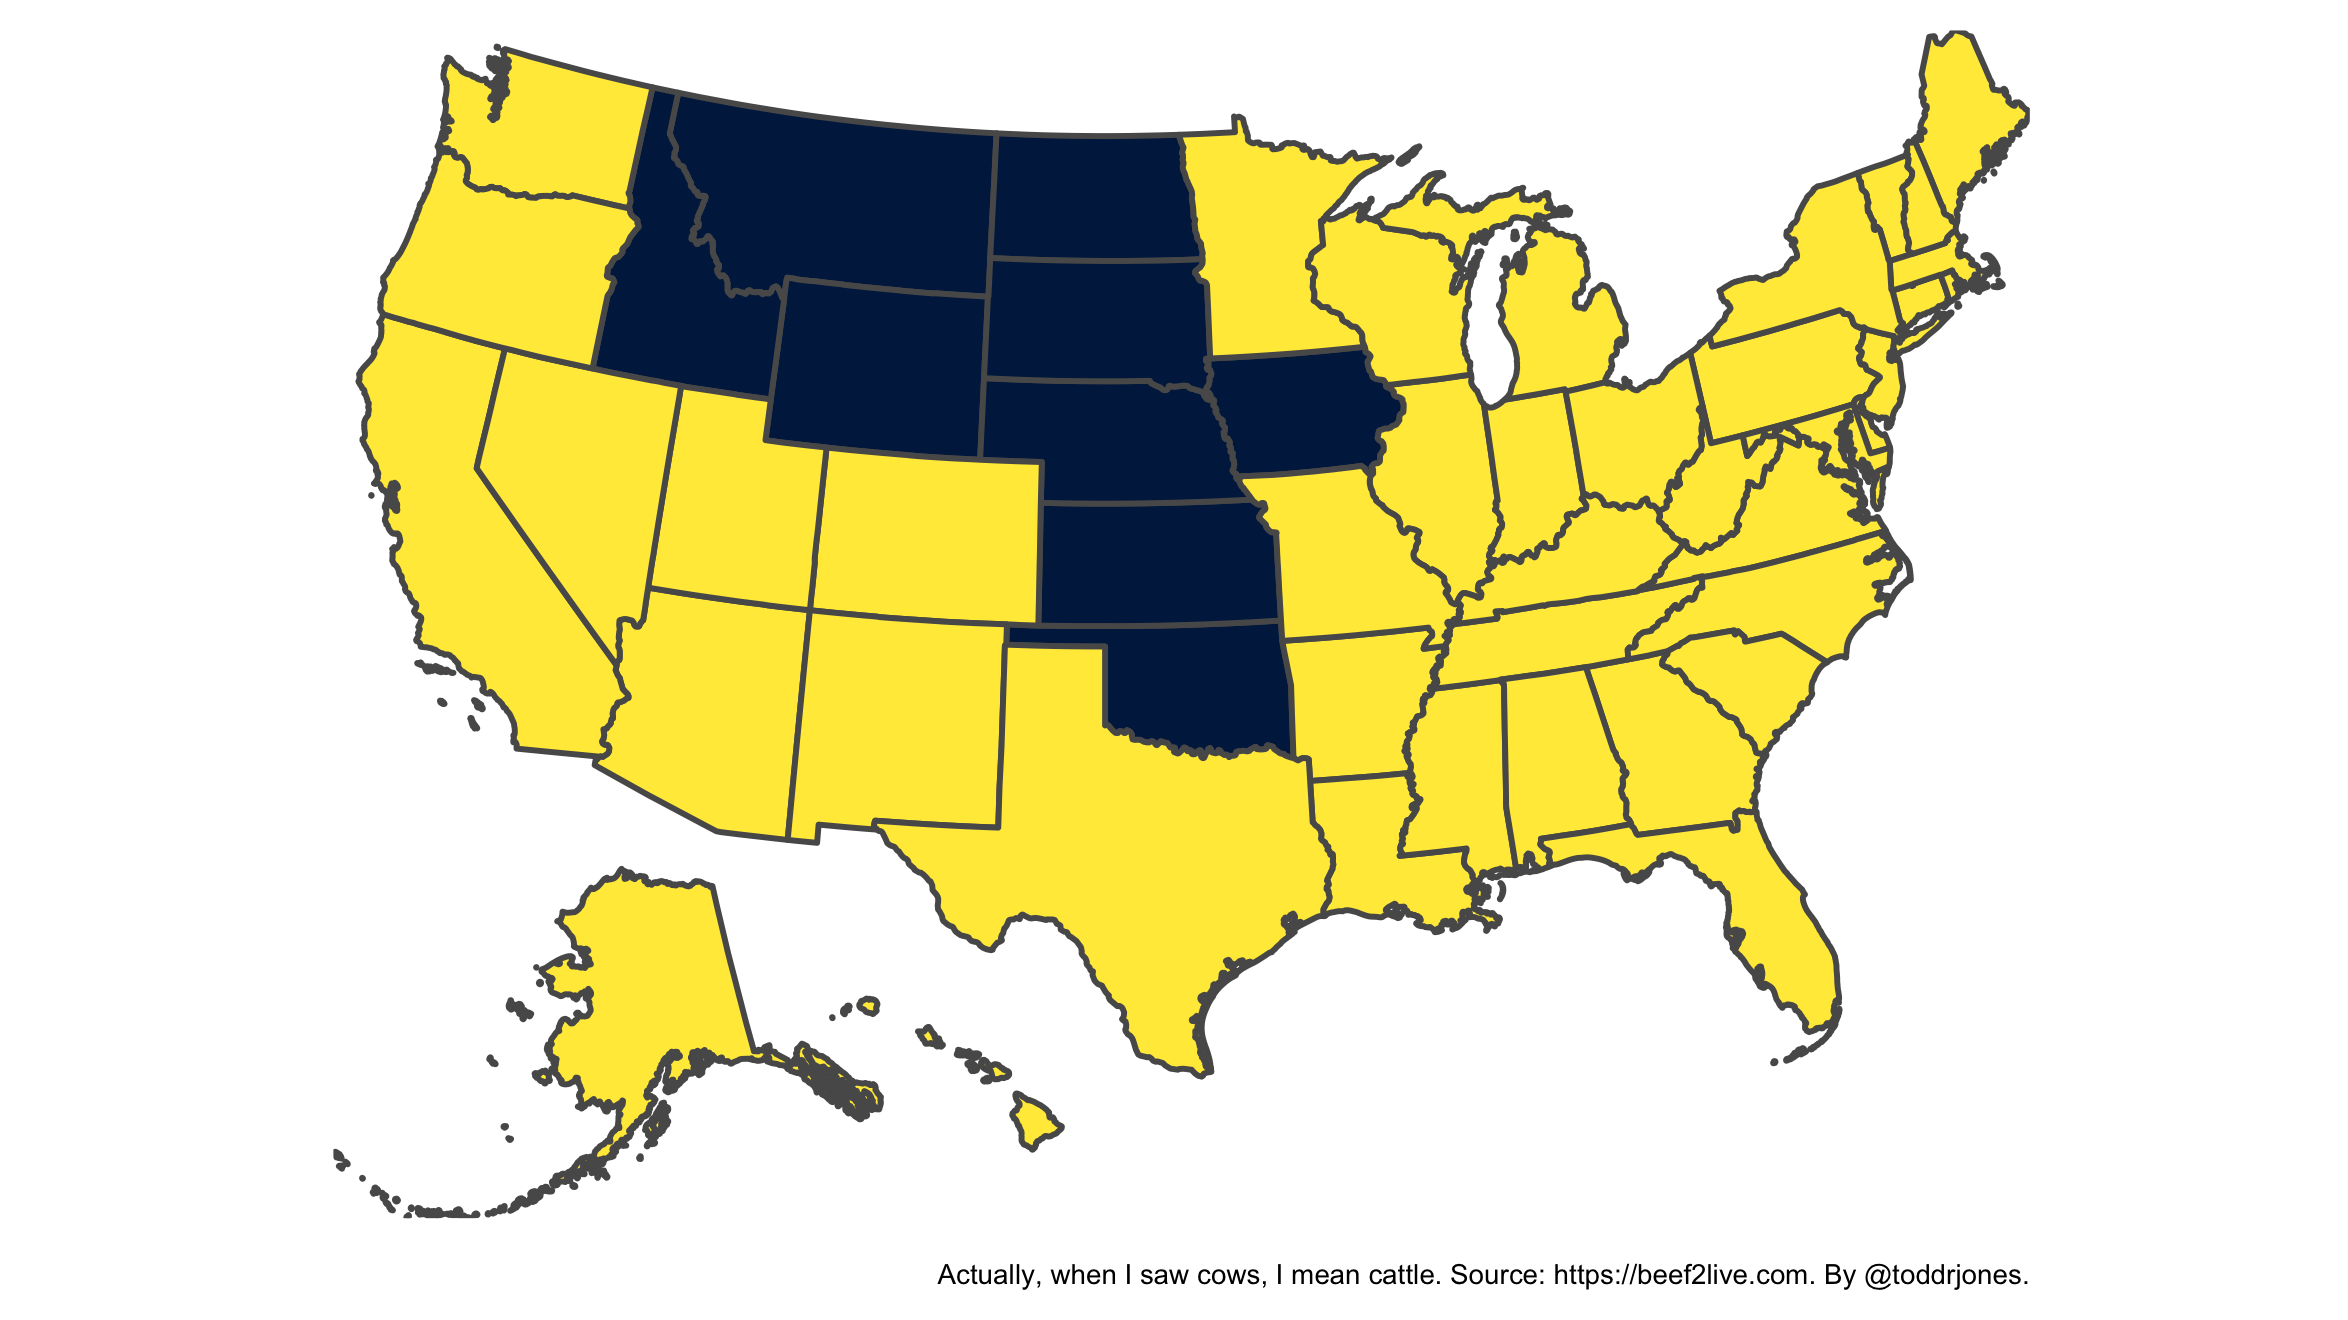
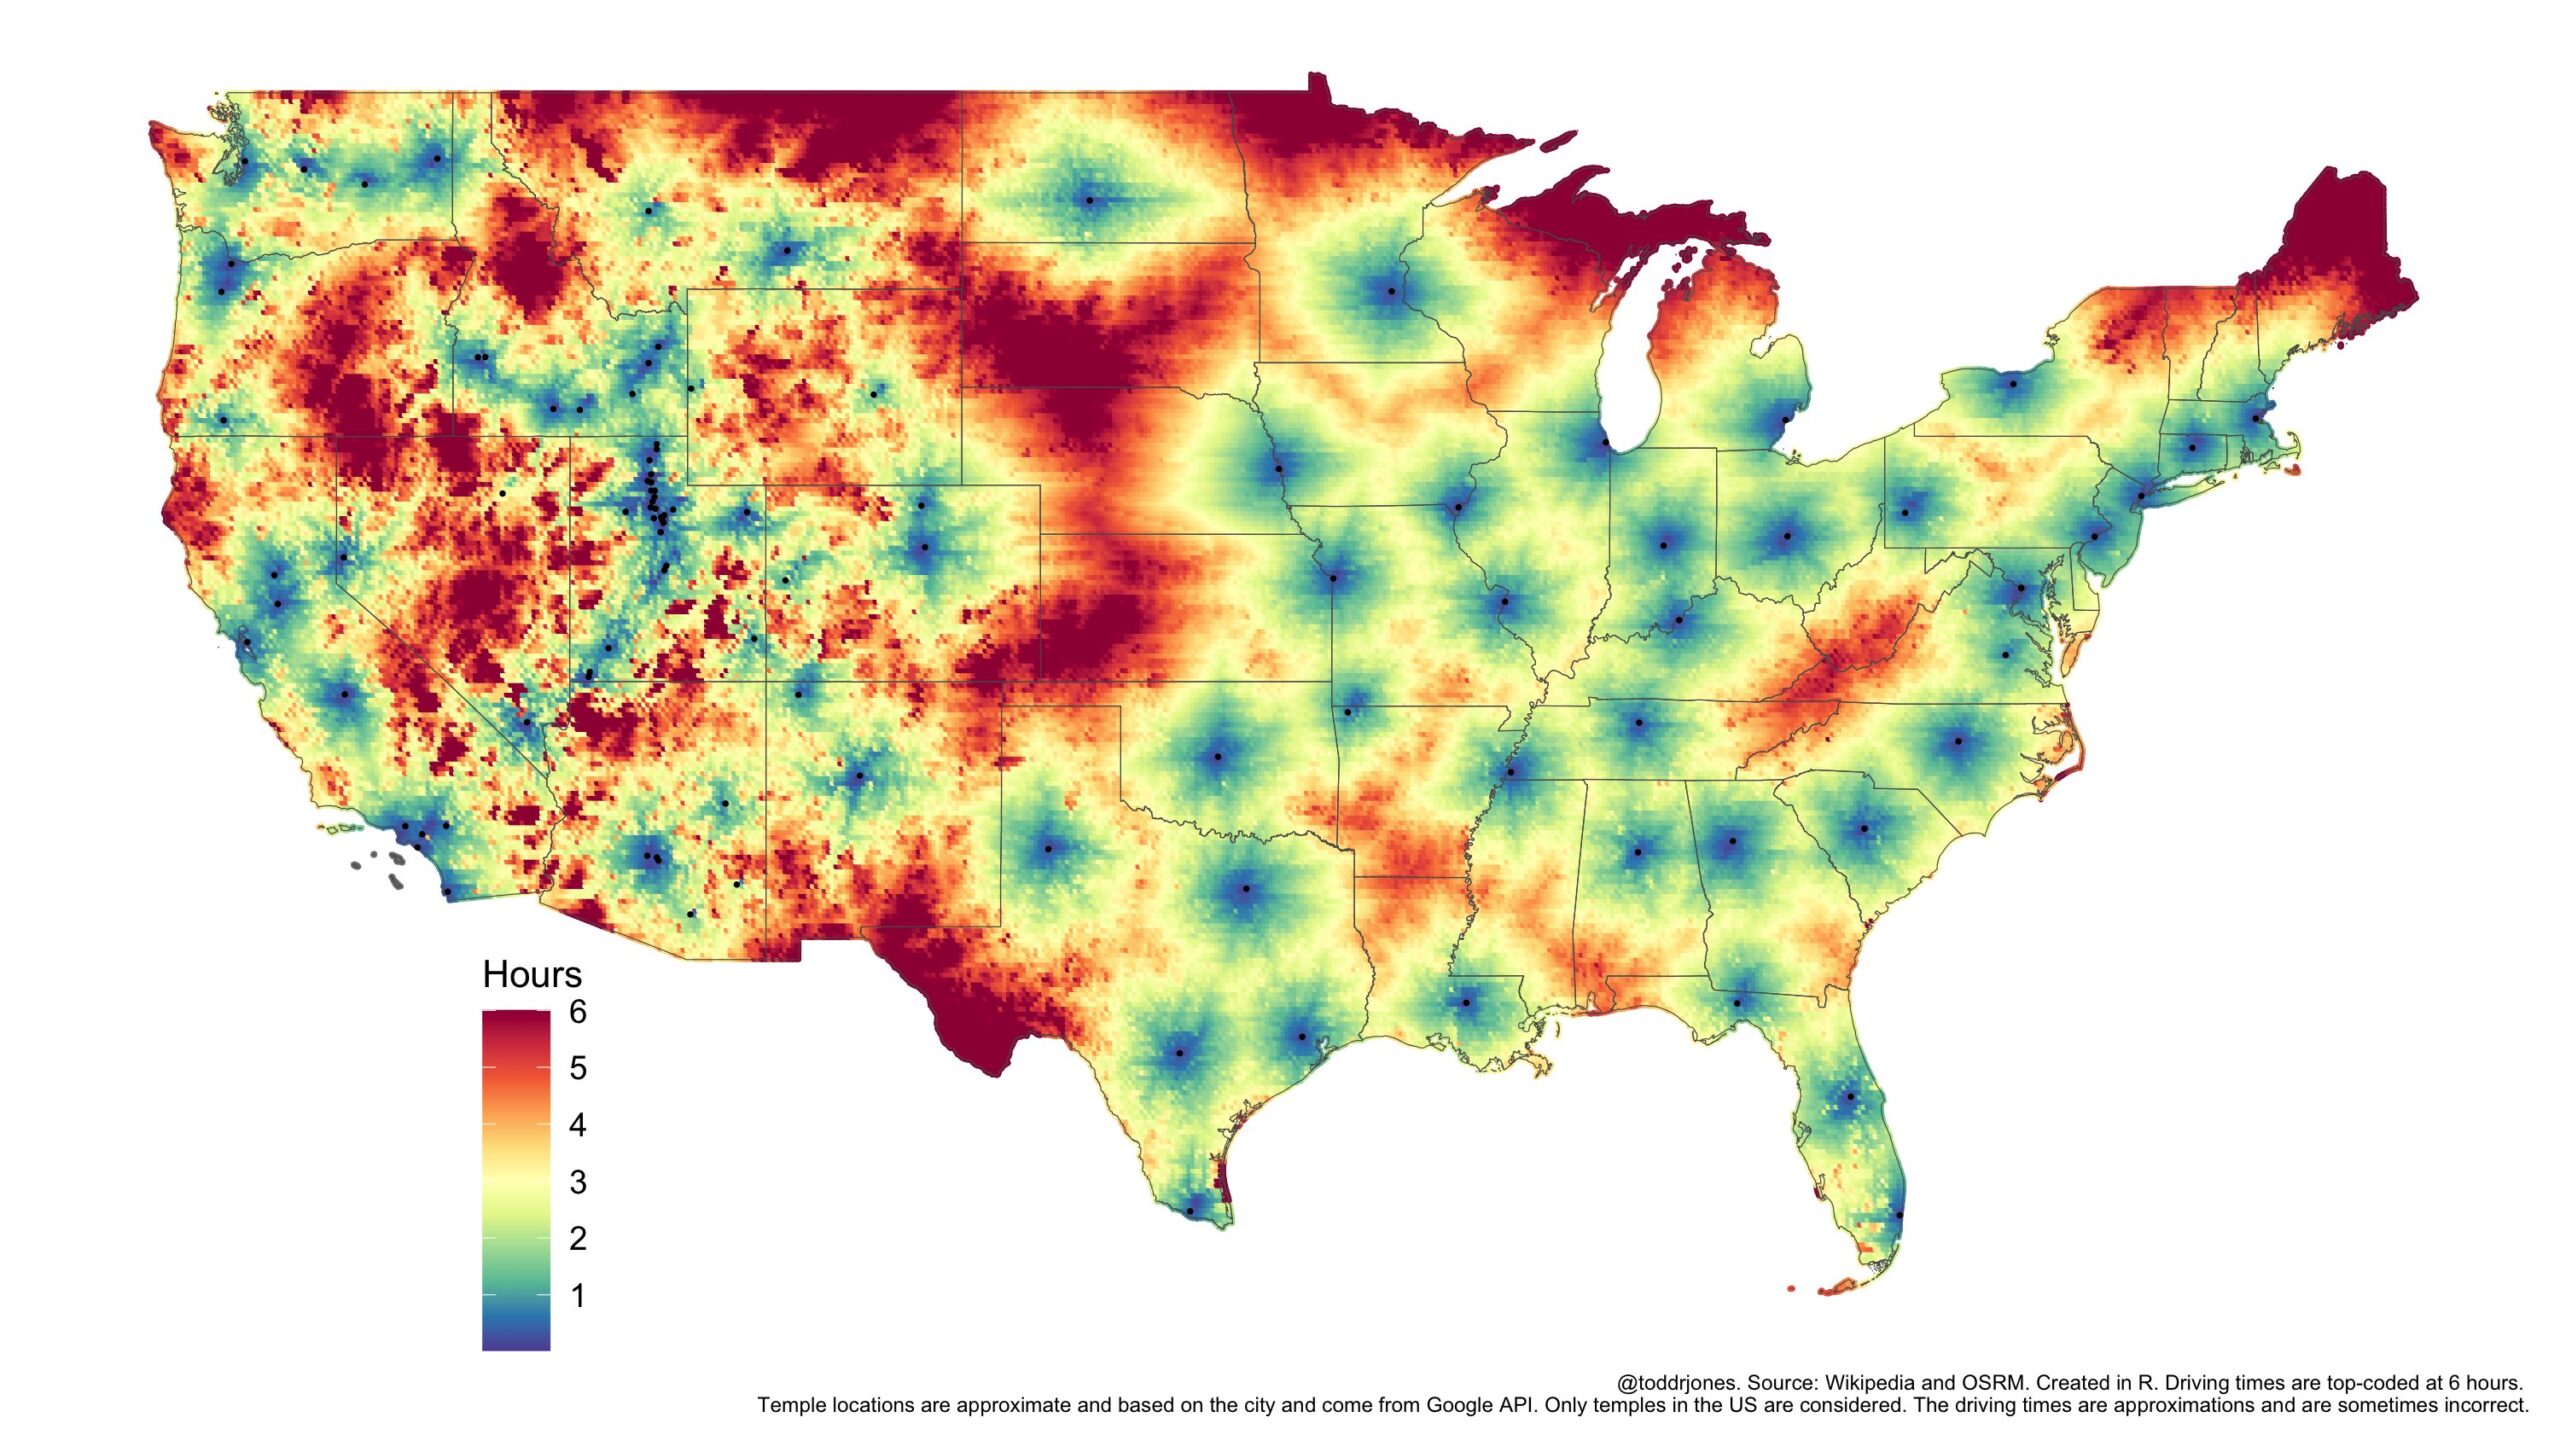
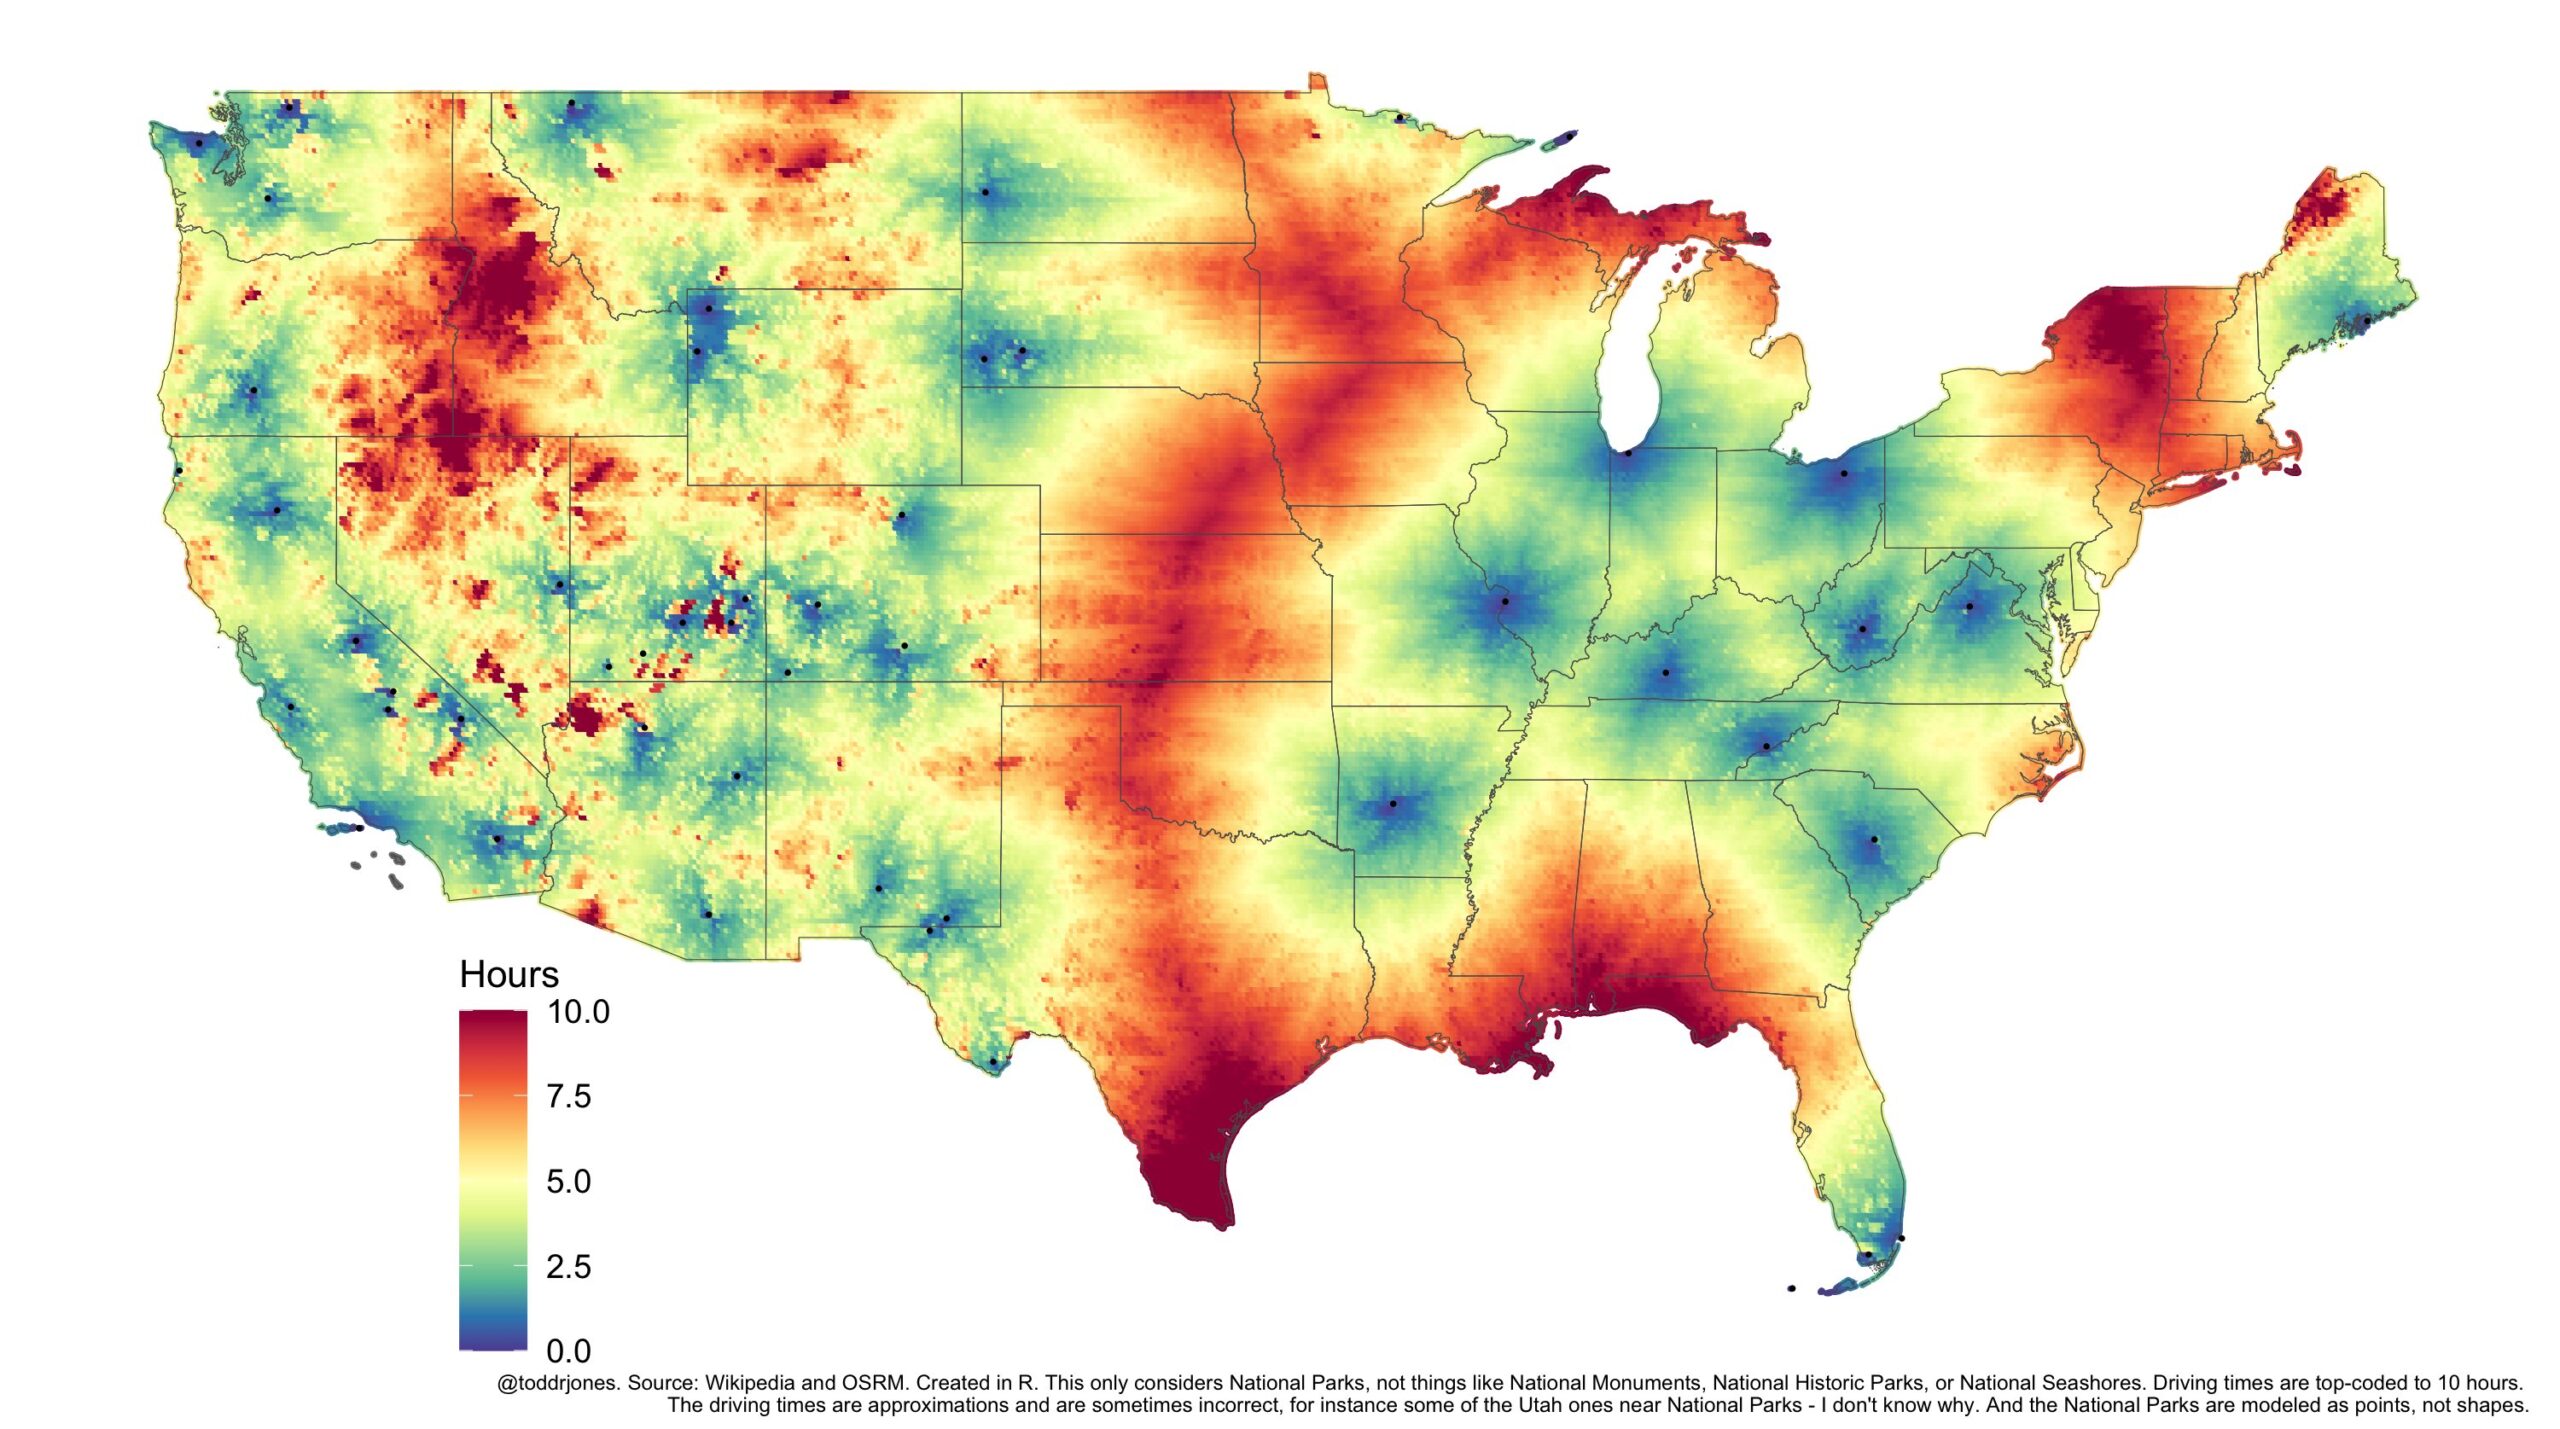
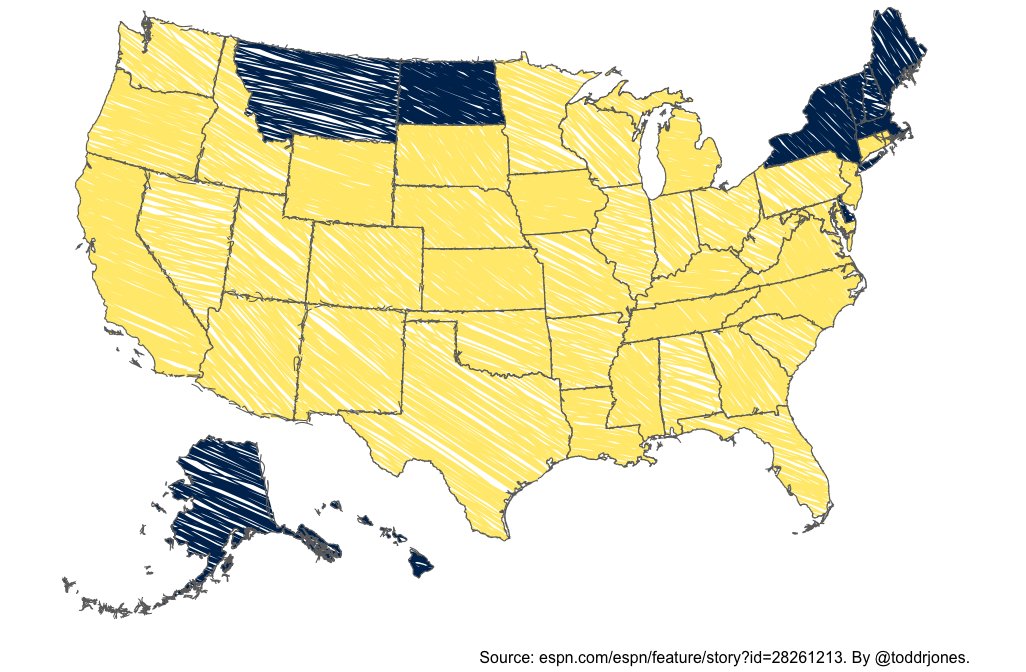
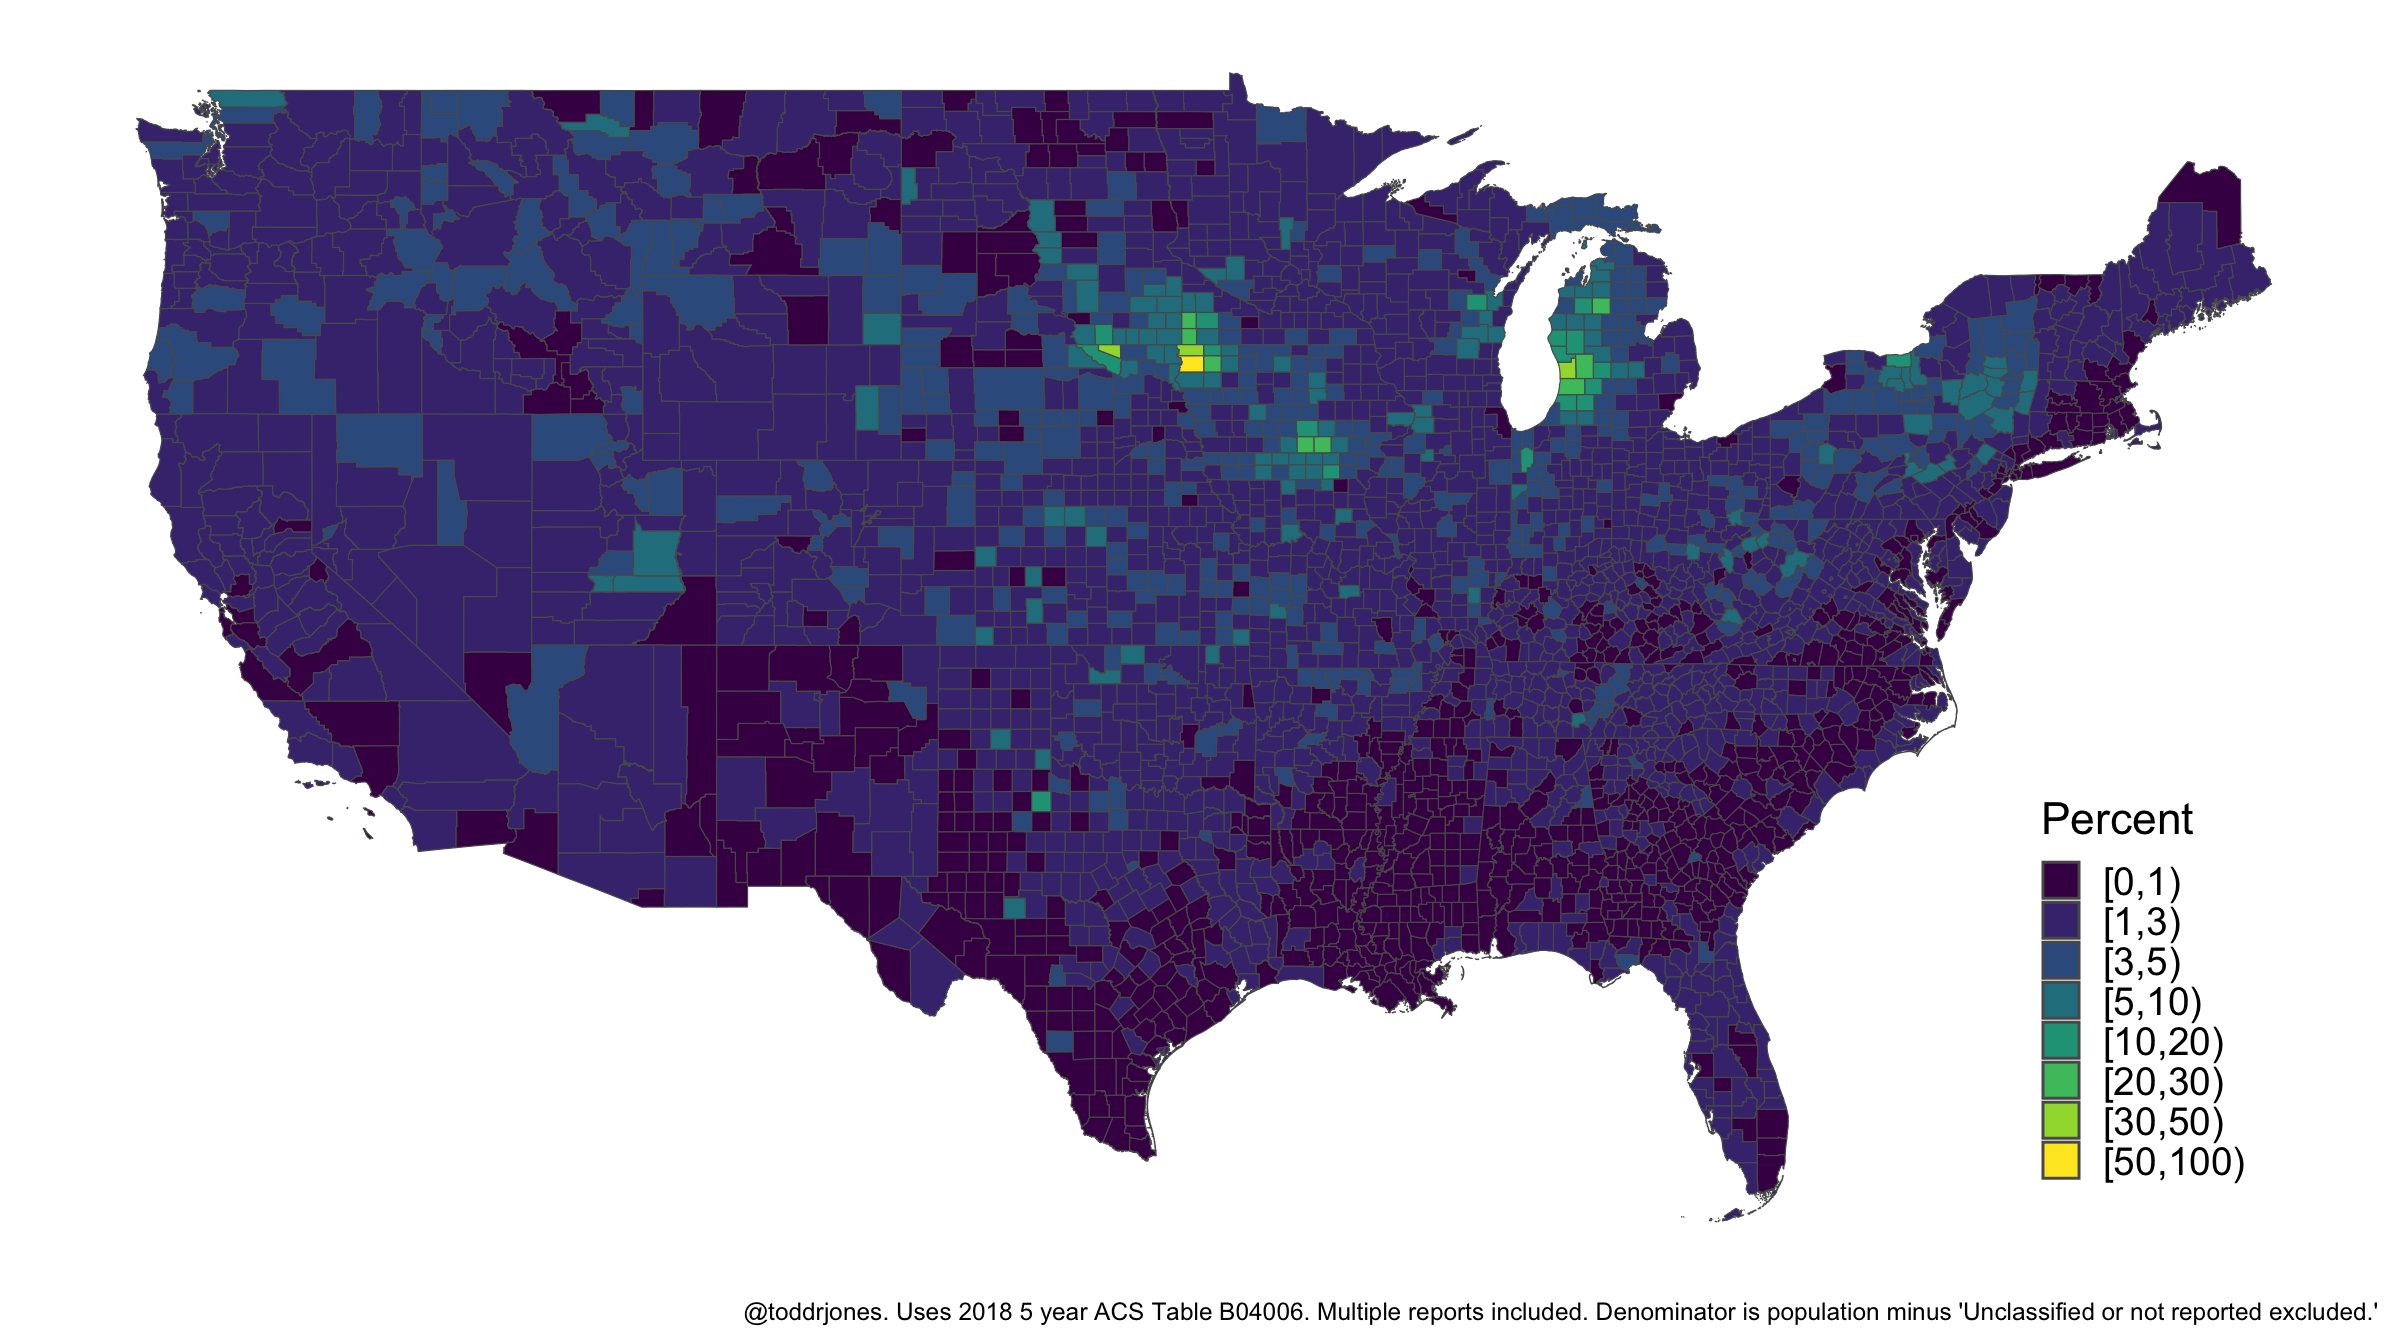
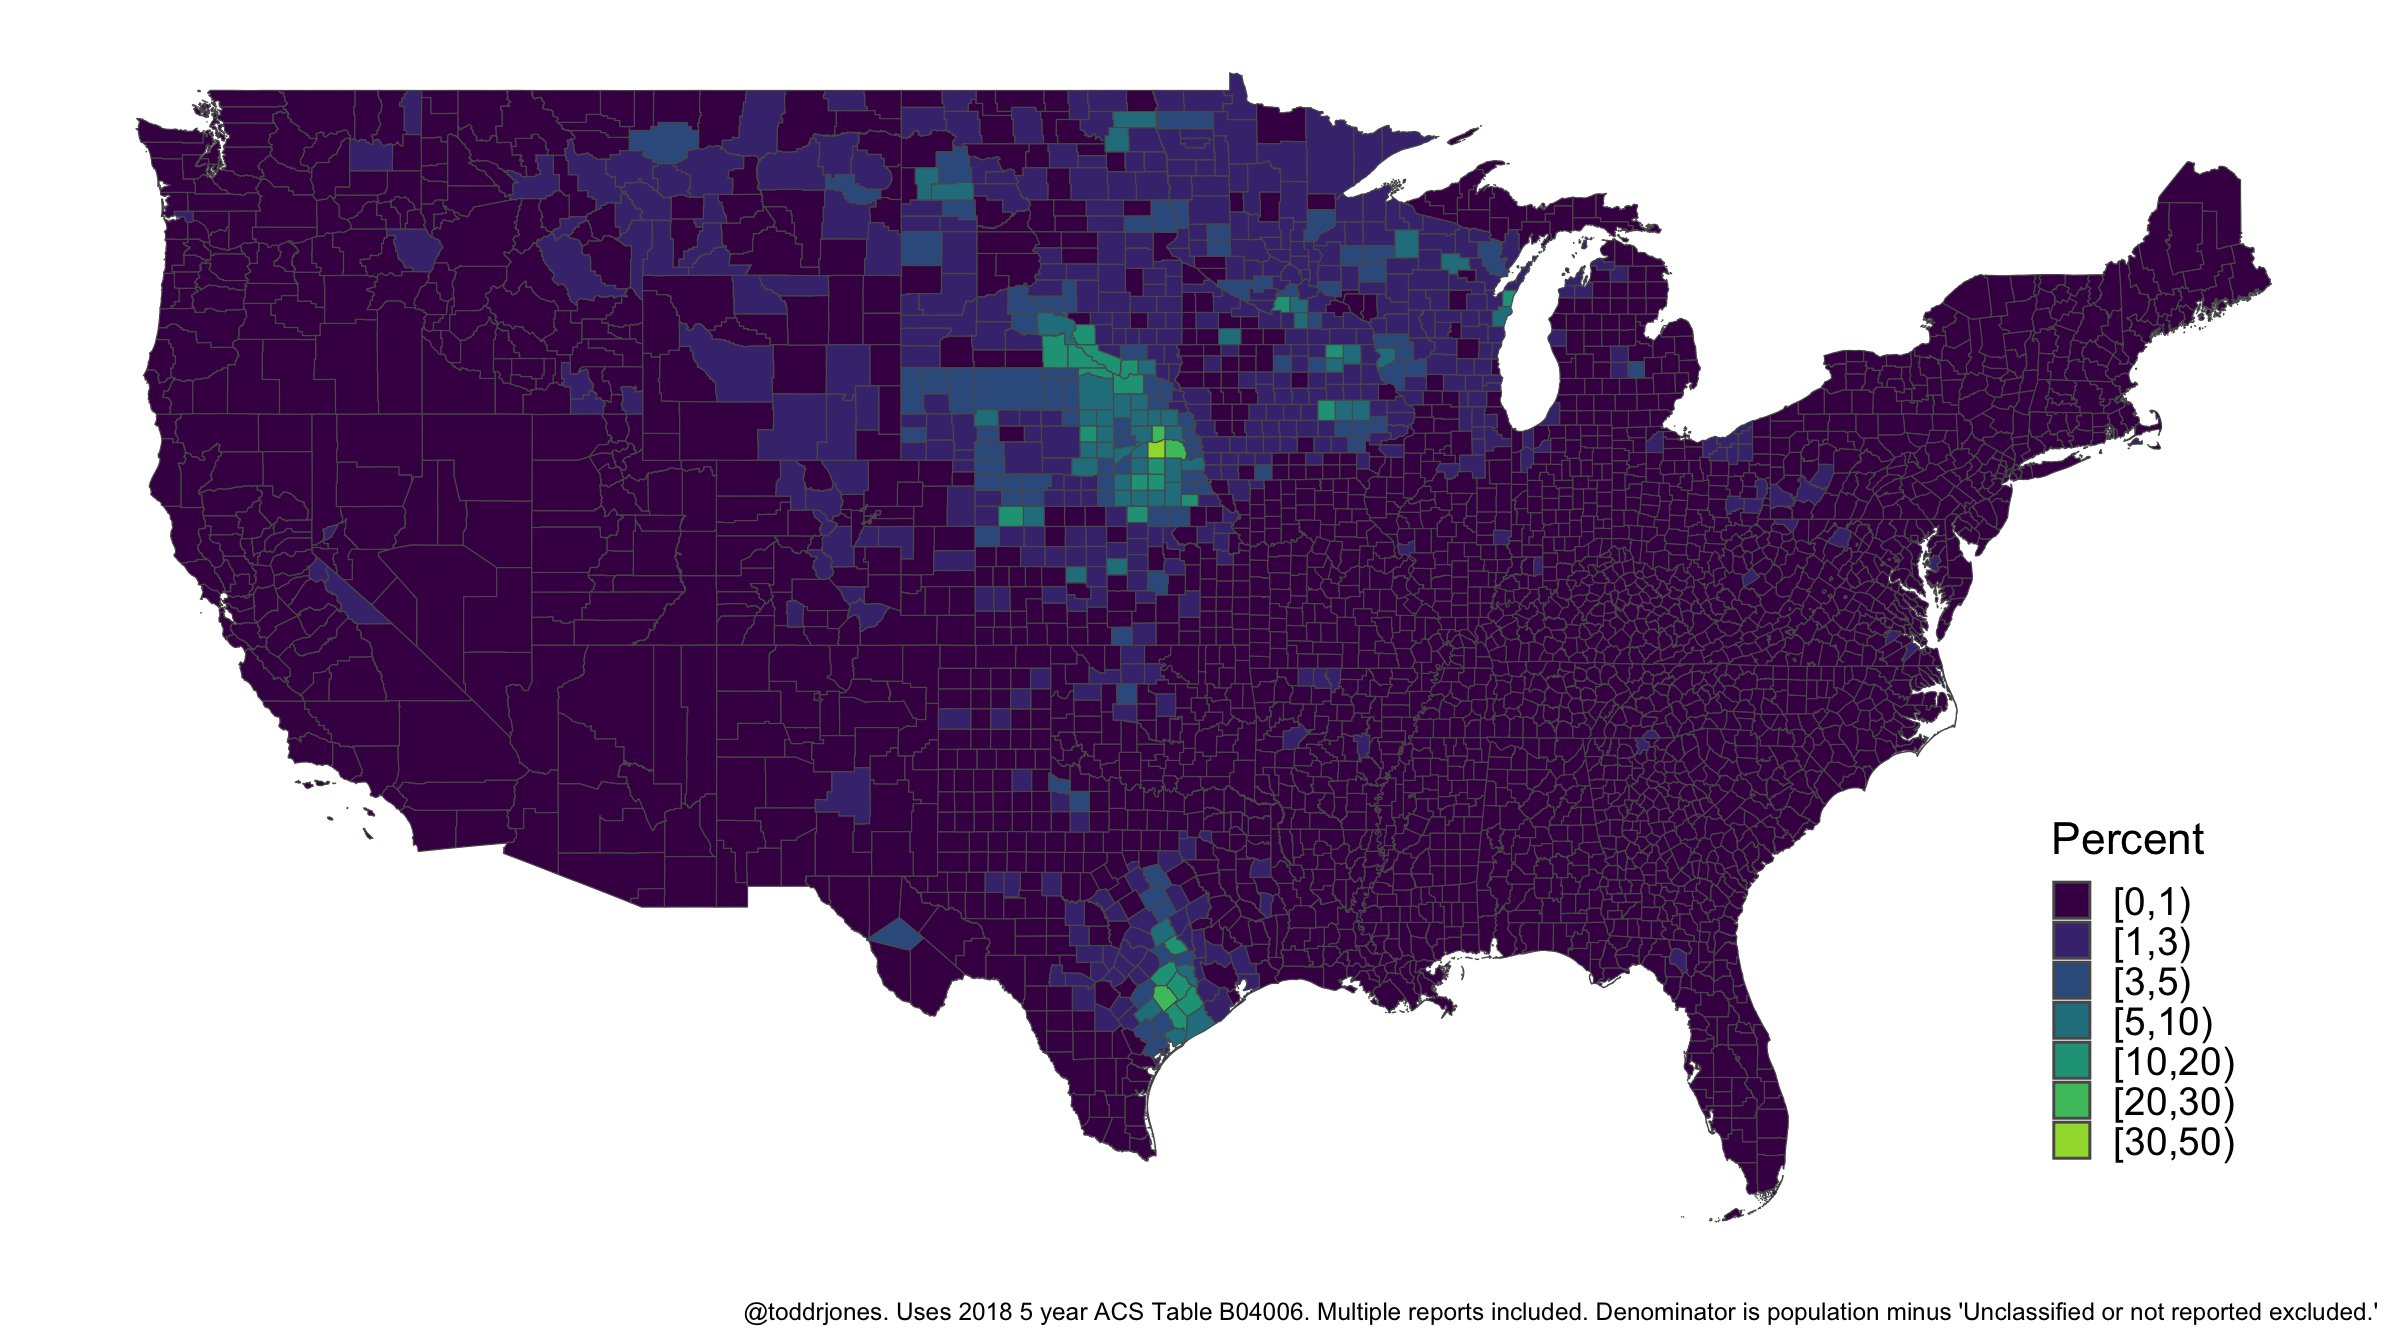
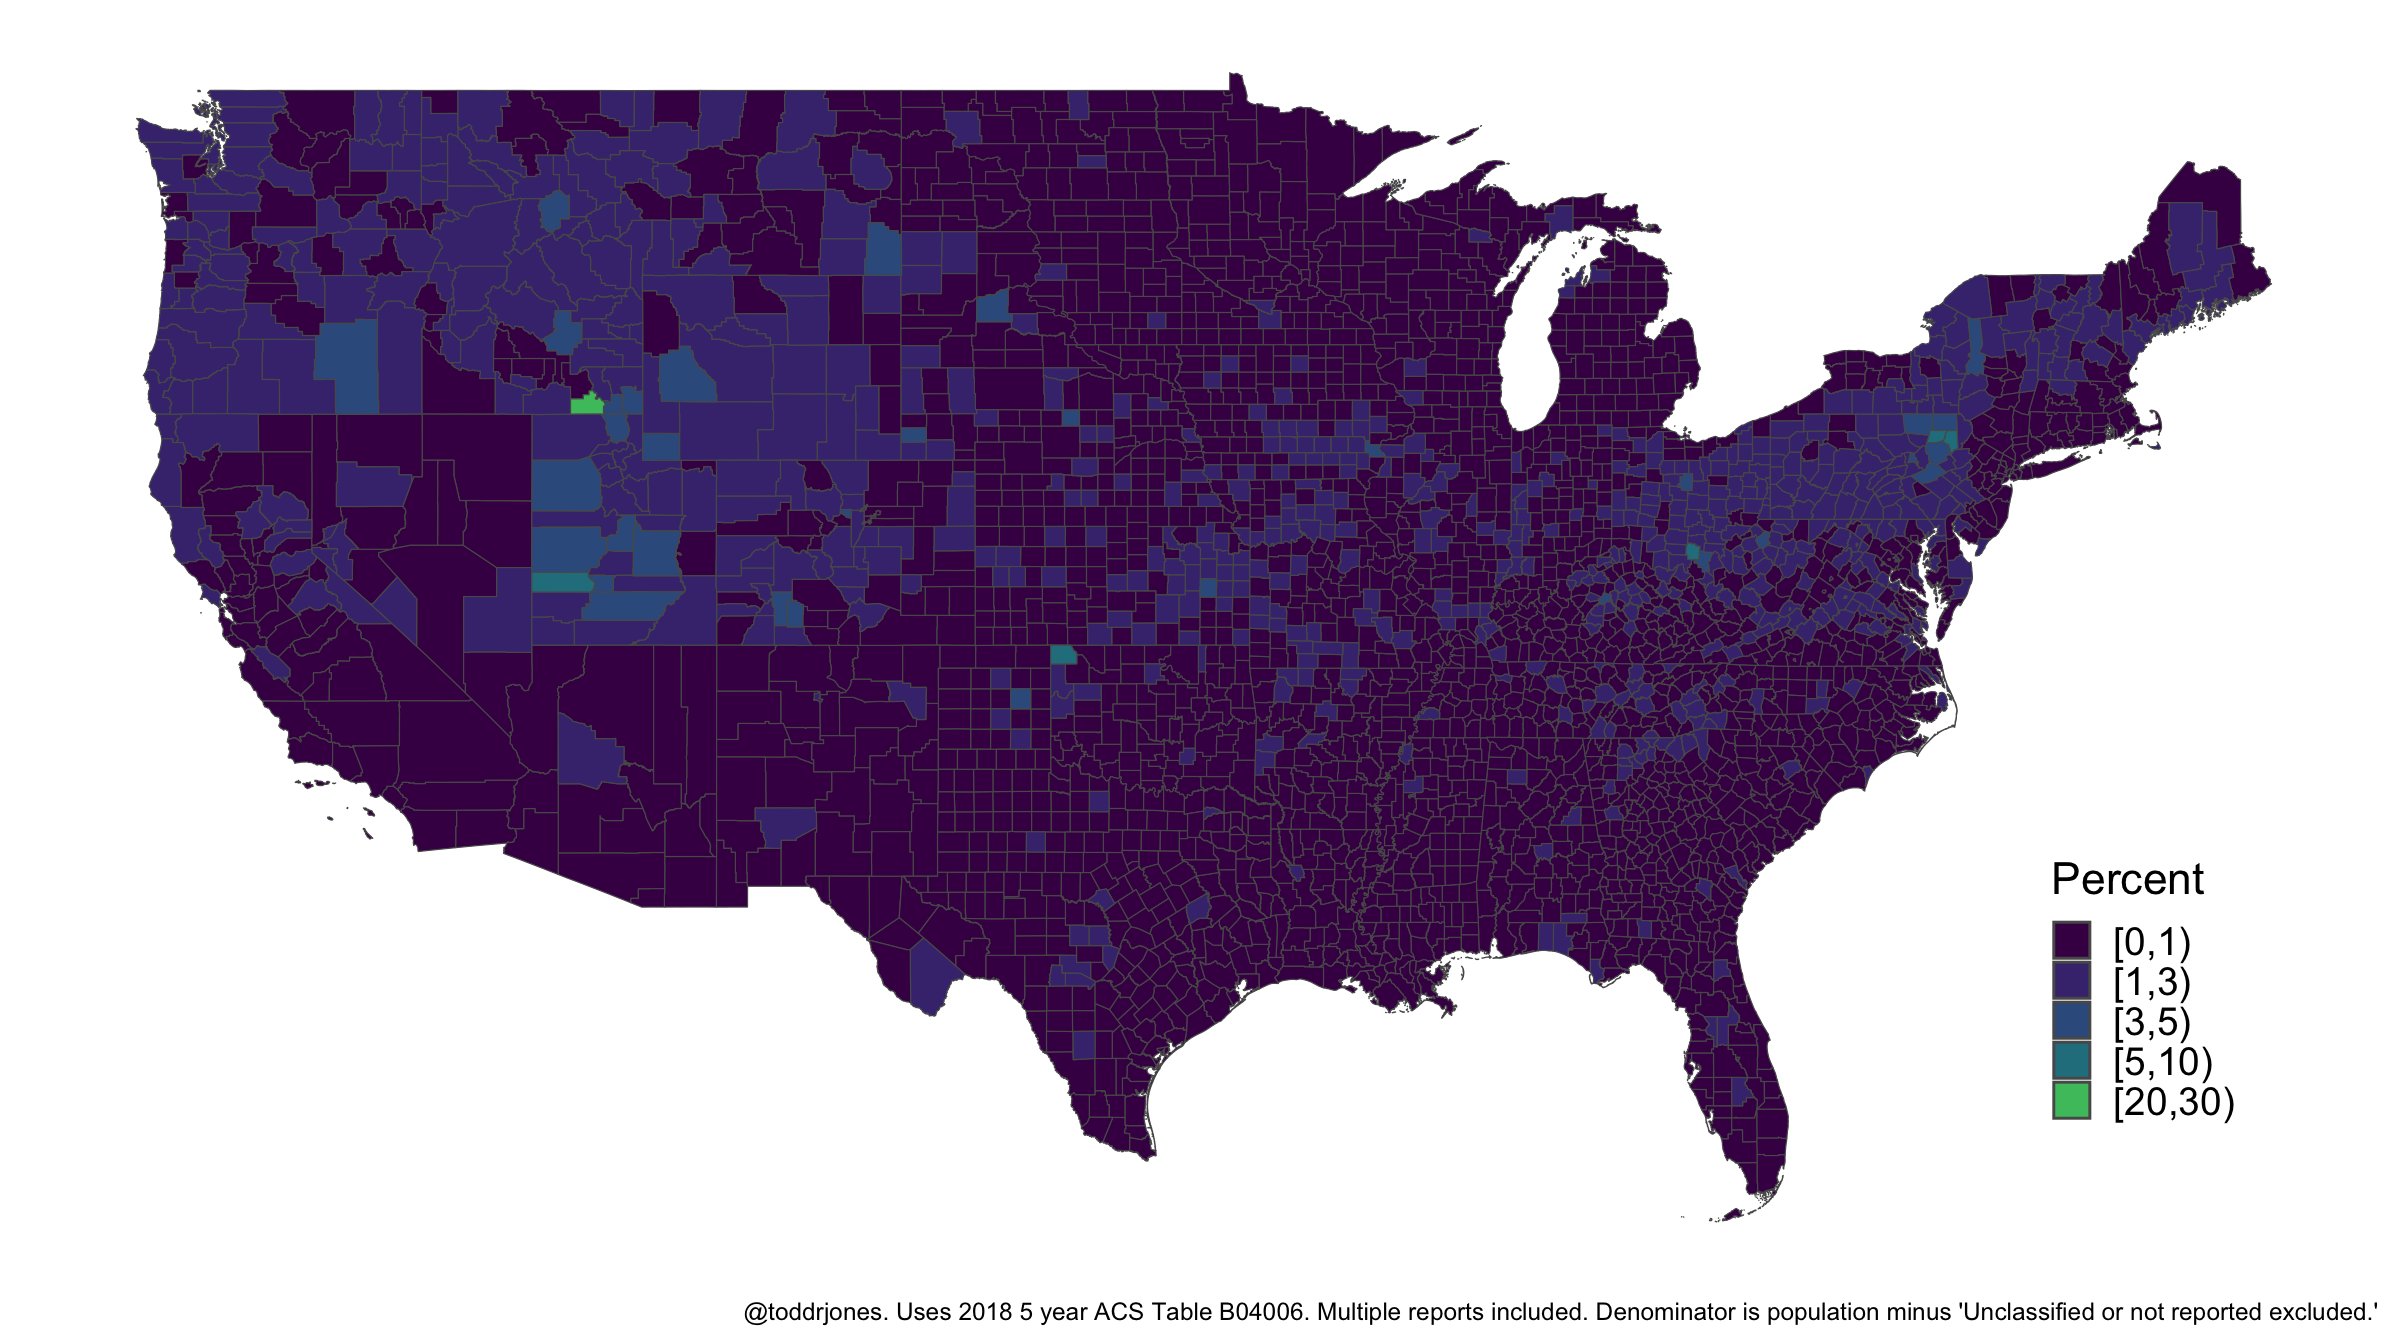
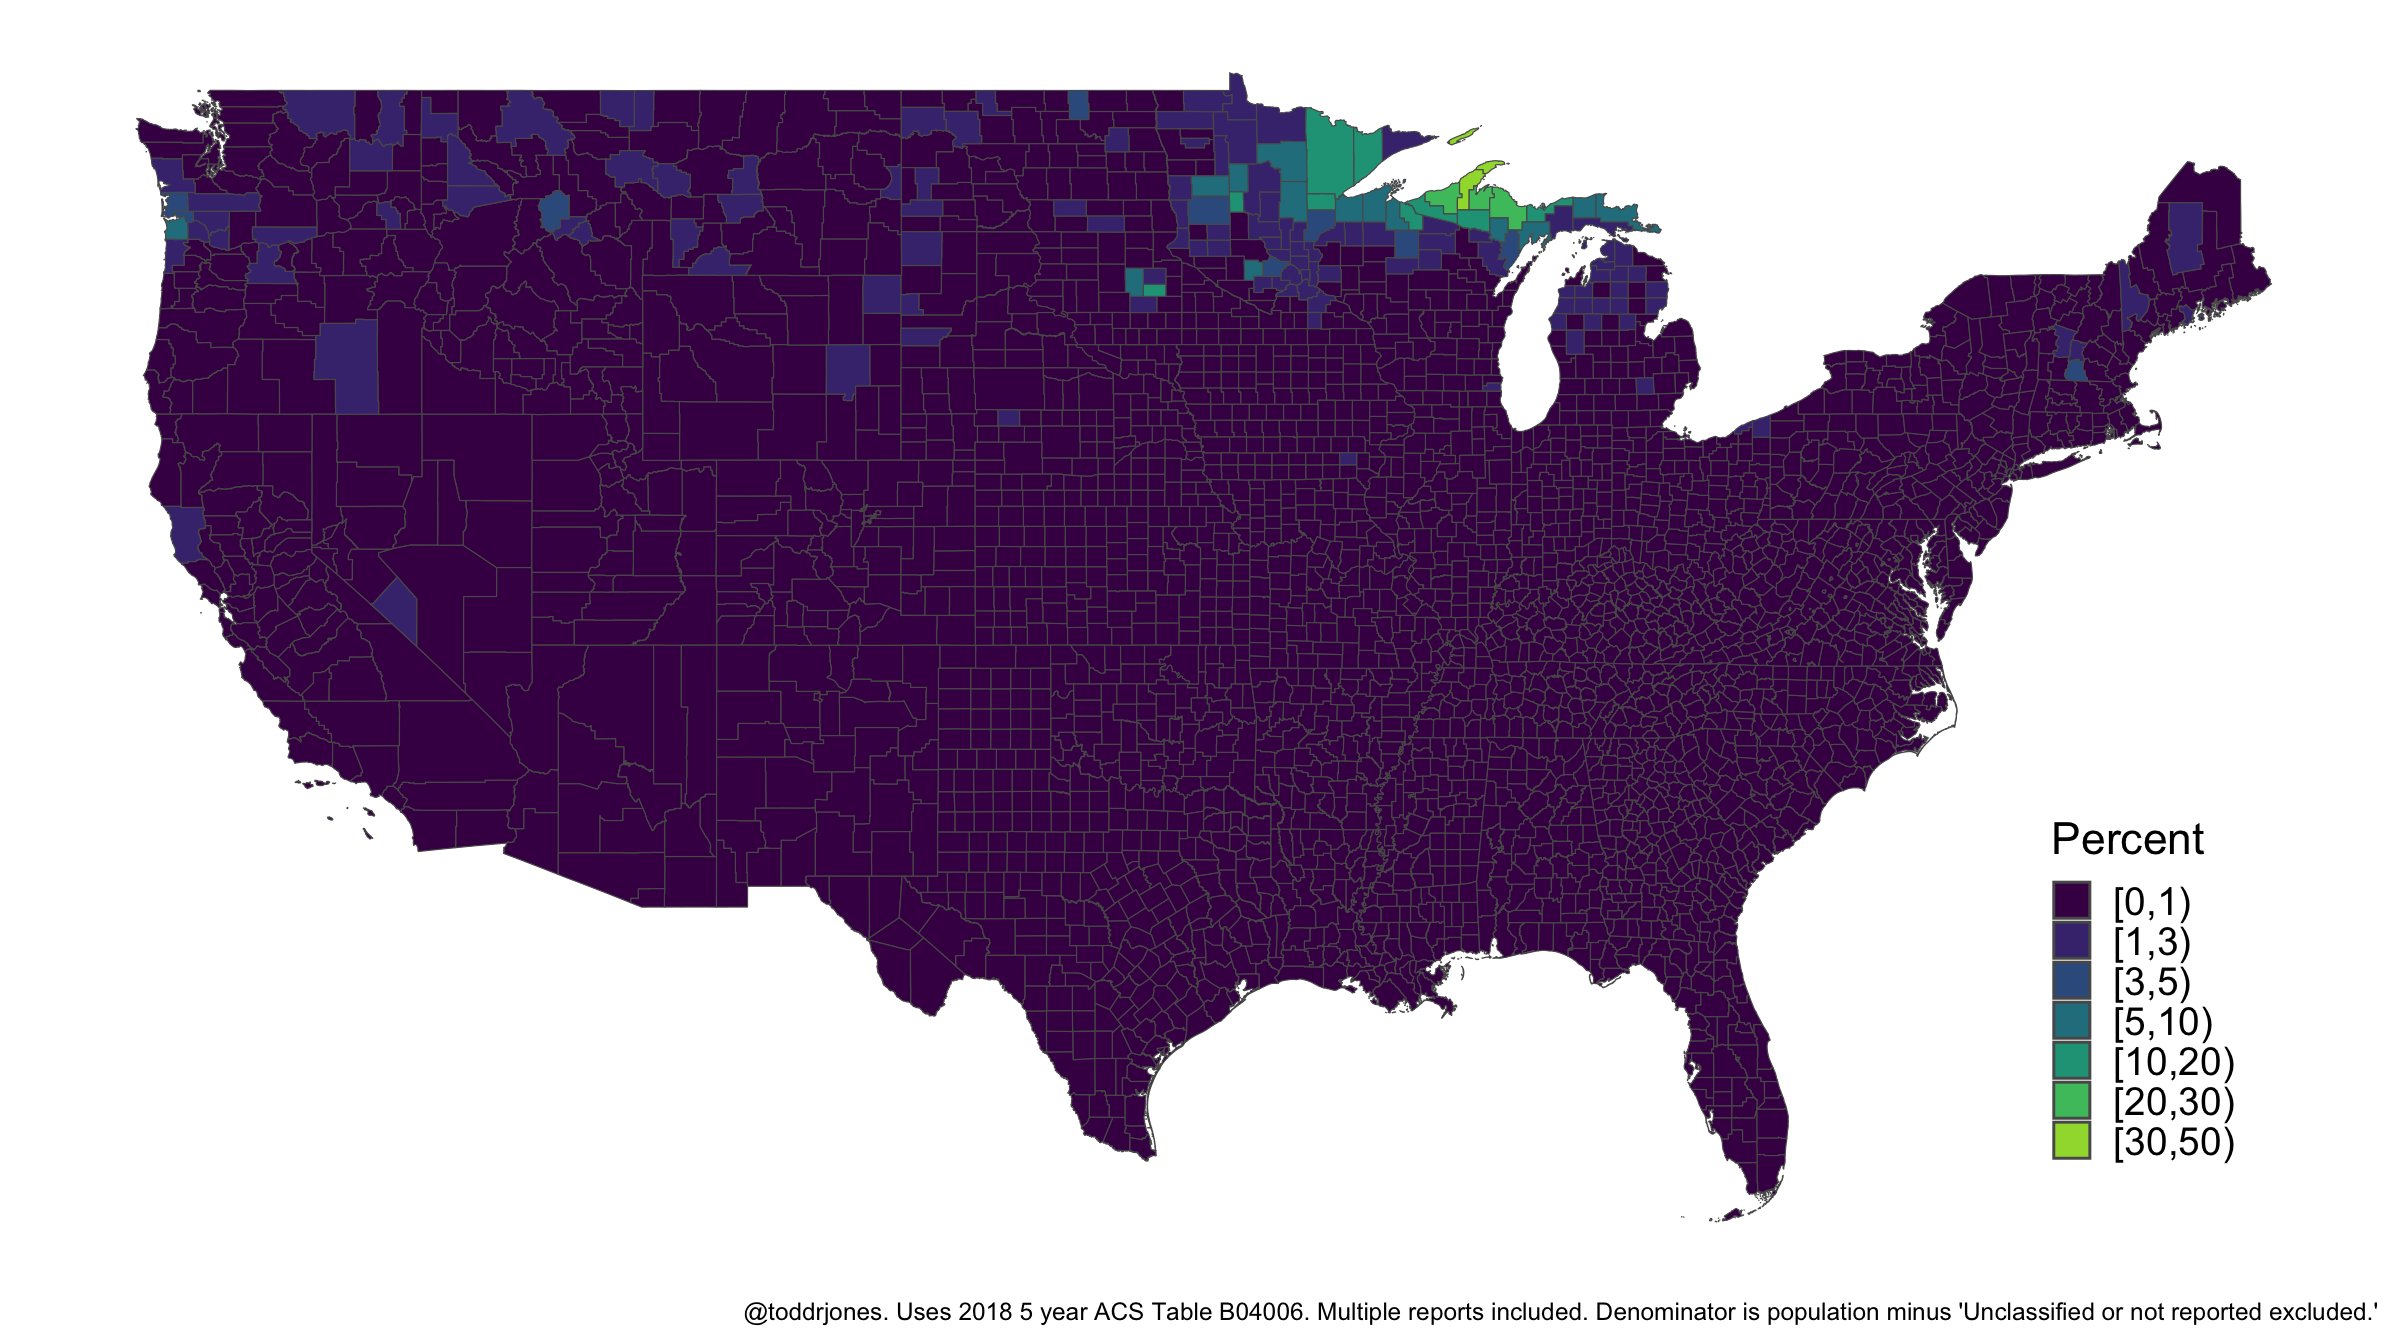
All of the following maps are the work of Todd Jones who is according to his website: I am an Assistant Professor of Economics at Mississippi State University, an IZA Research Fellow, a CESifo Research Network Affiliate, and an Annenberg Institute (Brown University) EdWorkingPapers Contributor. Beginning in August 2026, I will be an Associate Professor of Economics at Mississippi […]
Show full content
All of the following maps are the work of Todd Jones who is according to his website:
I am an Assistant Professor of Economics at Mississippi State University, an IZA Research Fellow, a CESifo Research Network Affiliate, and an Annenberg Institute (Brown University) EdWorkingPapers Contributor. Beginning in August 2026, I will be an Associate Professor of Economics at Mississippi State University.
My research interests are in applied microeconomics, including topics in education, family, and crime. My research is published in journals including the Journal of Human Resources, Journal of Public Economics, Journal of Economic Behavior & Organization, Labour Economics, Journal of Population Economics, Economics of Education Review, and Education Finance & Policy. My CV is available here.
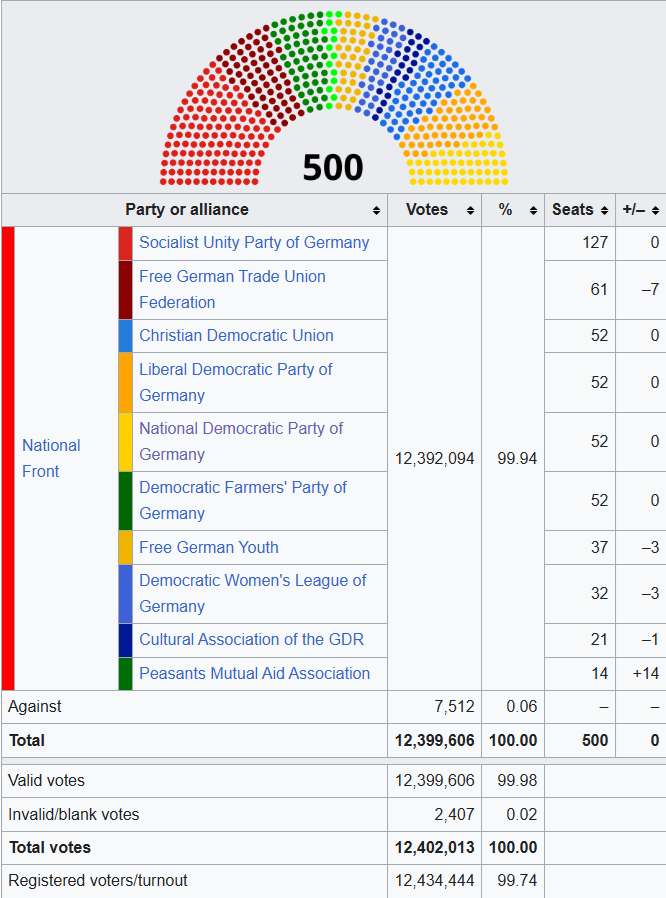
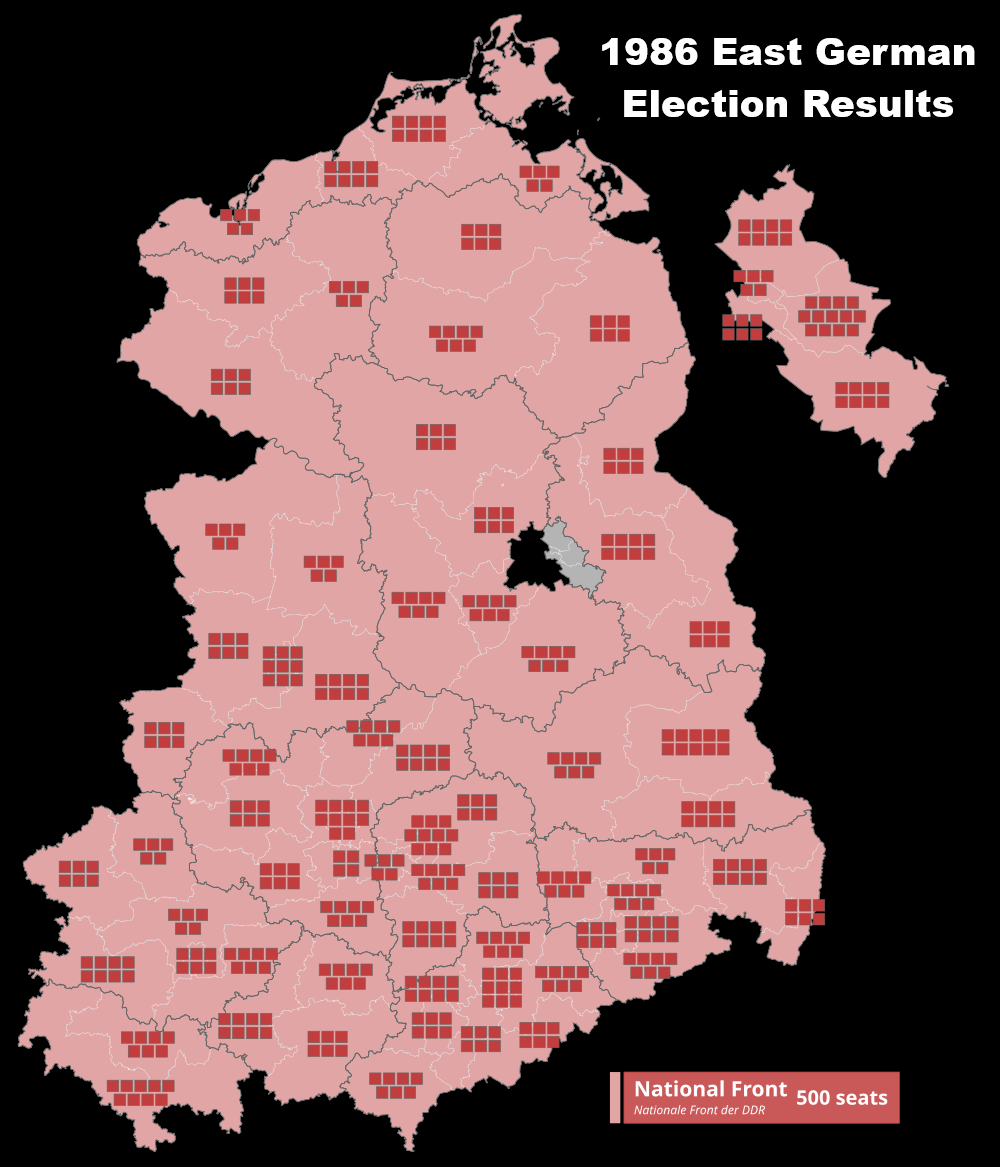
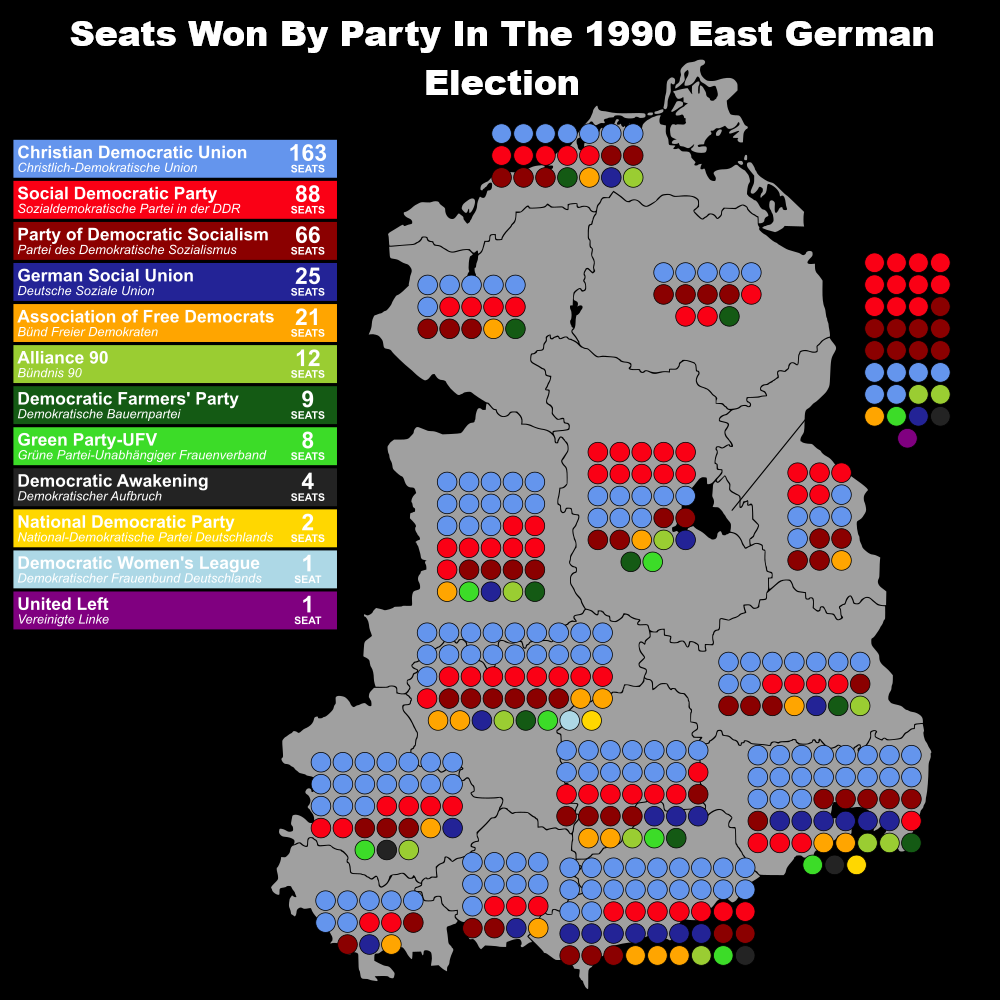
Credit: ErinthecuteThe map above shows the one and only free and fair election in East German’s entire history on 18 March 1990. East Germany would join West Germany later that year on October 3rd. More about this election and more maps below: How Elections Worked in East Germany (GDR) (Prior to 1990) The National Front […]
Show full content
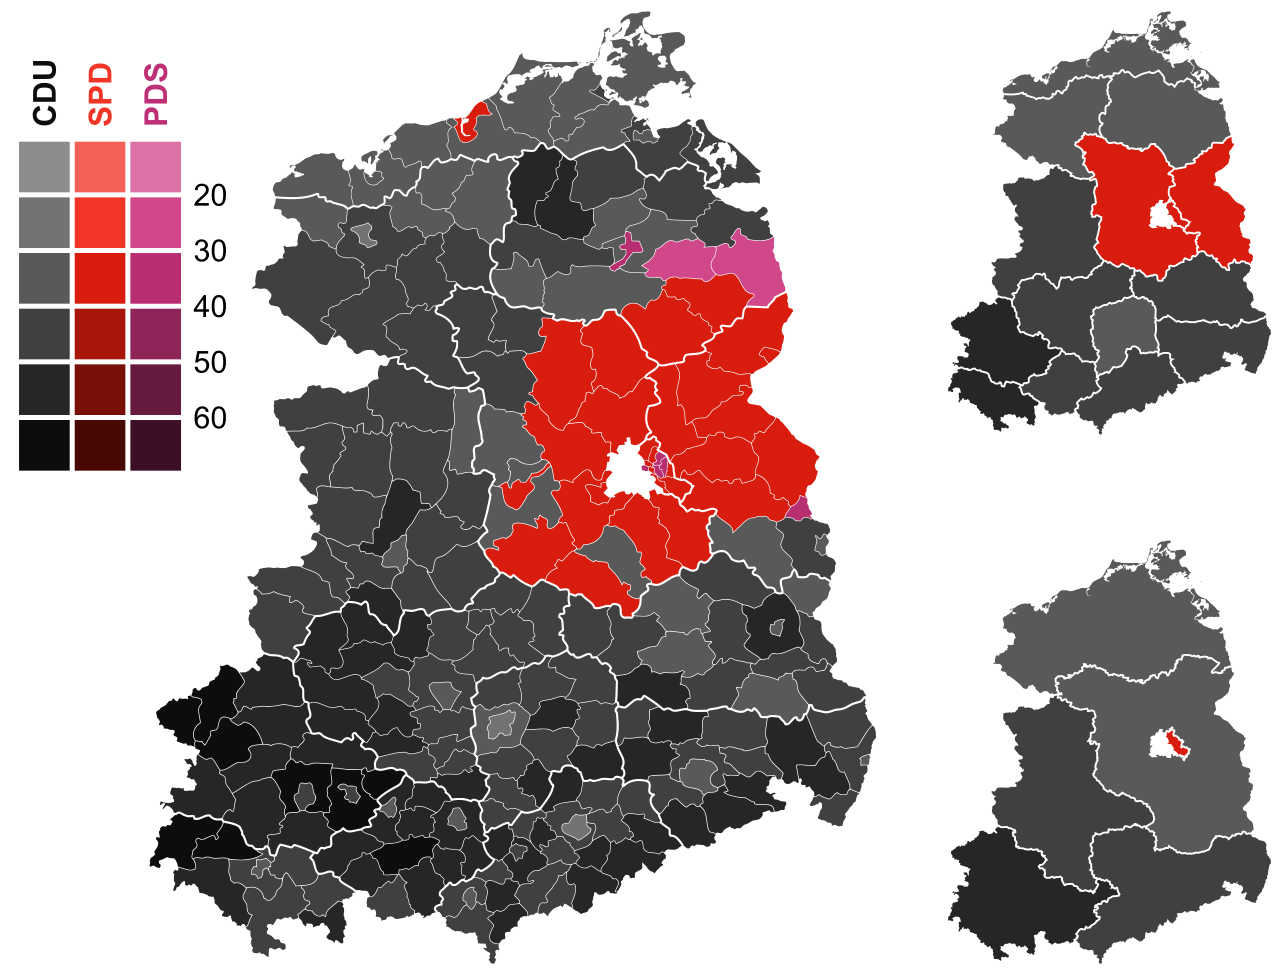
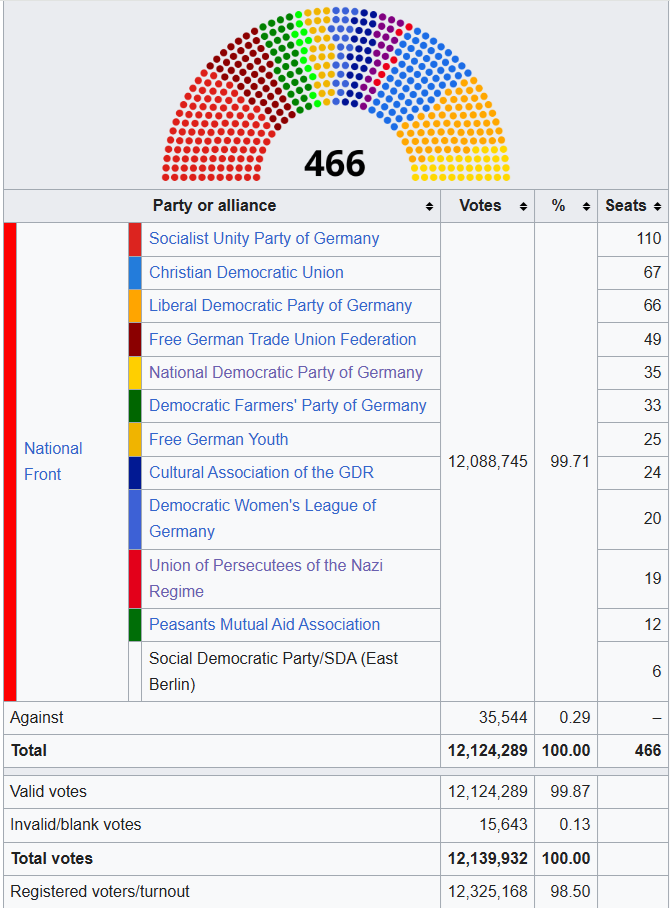
Credit: ErinthecuteThe map above shows the one and only free and fair election in East German’s entire history on 18 March 1990.
East Germany would join West Germany later that year on October 3rd.
More about this election and more maps below:
How Elections Worked in East Germany (GDR) (Prior to 1990)The National Front System
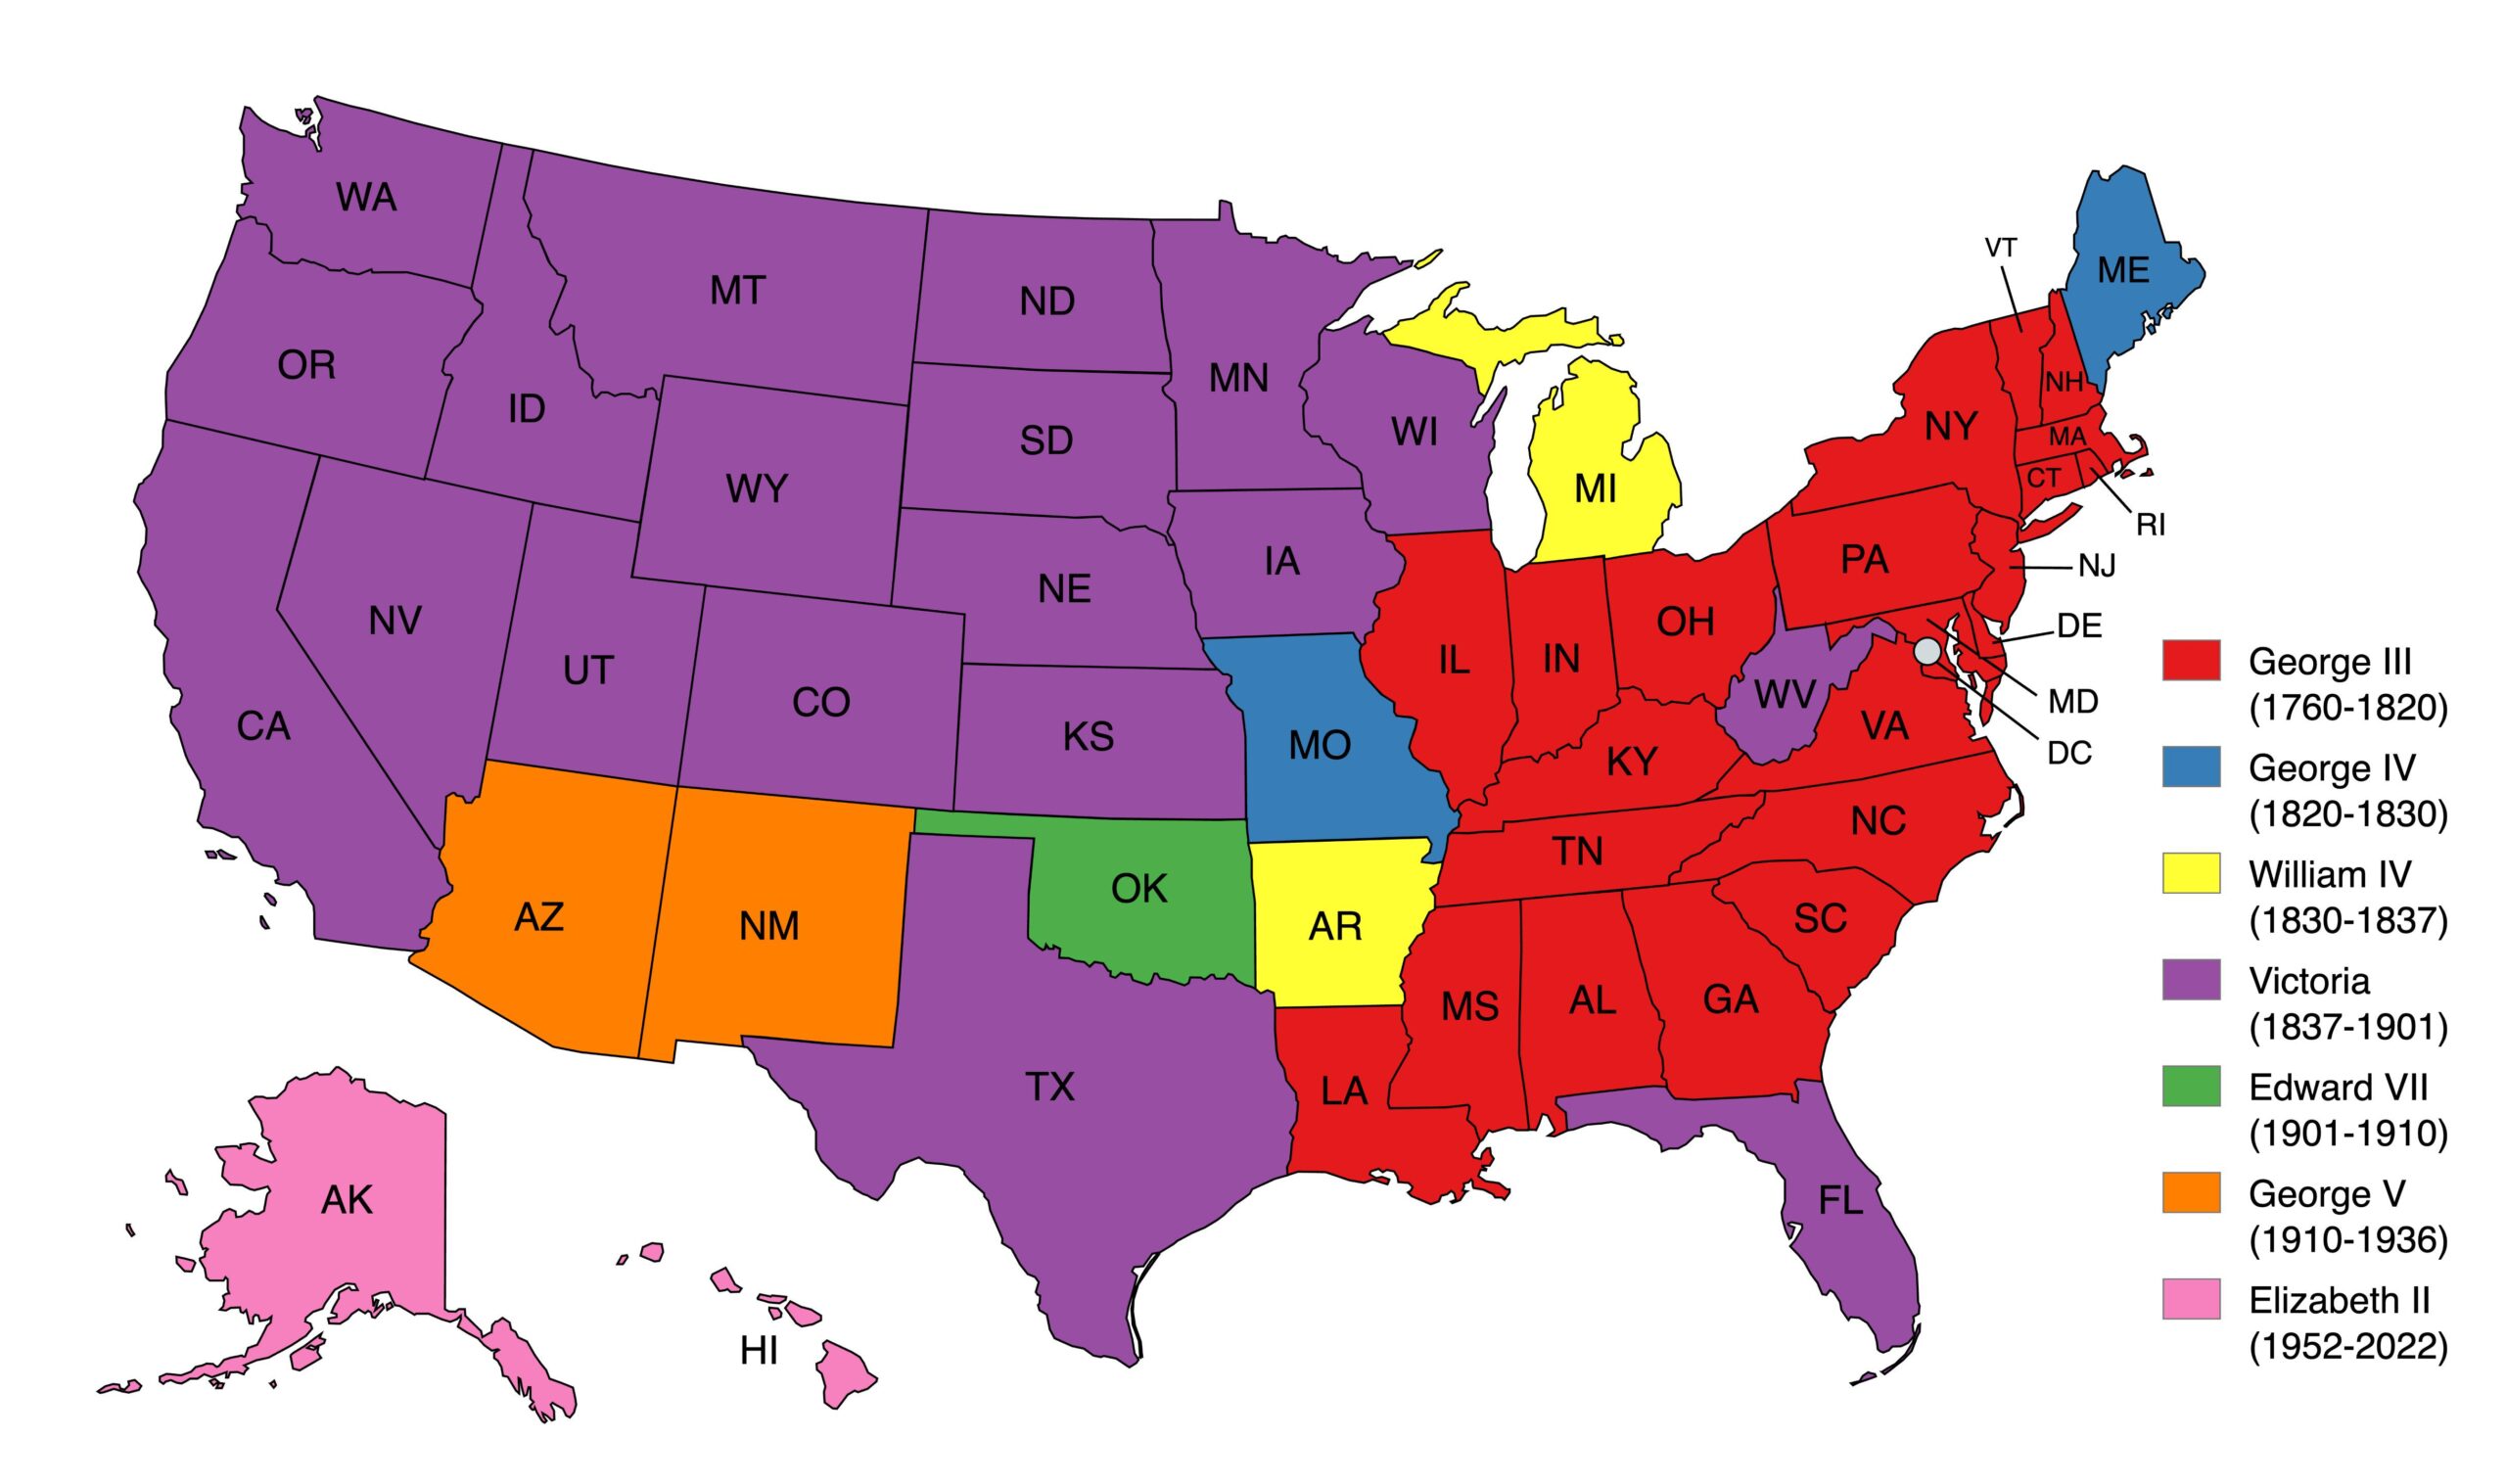
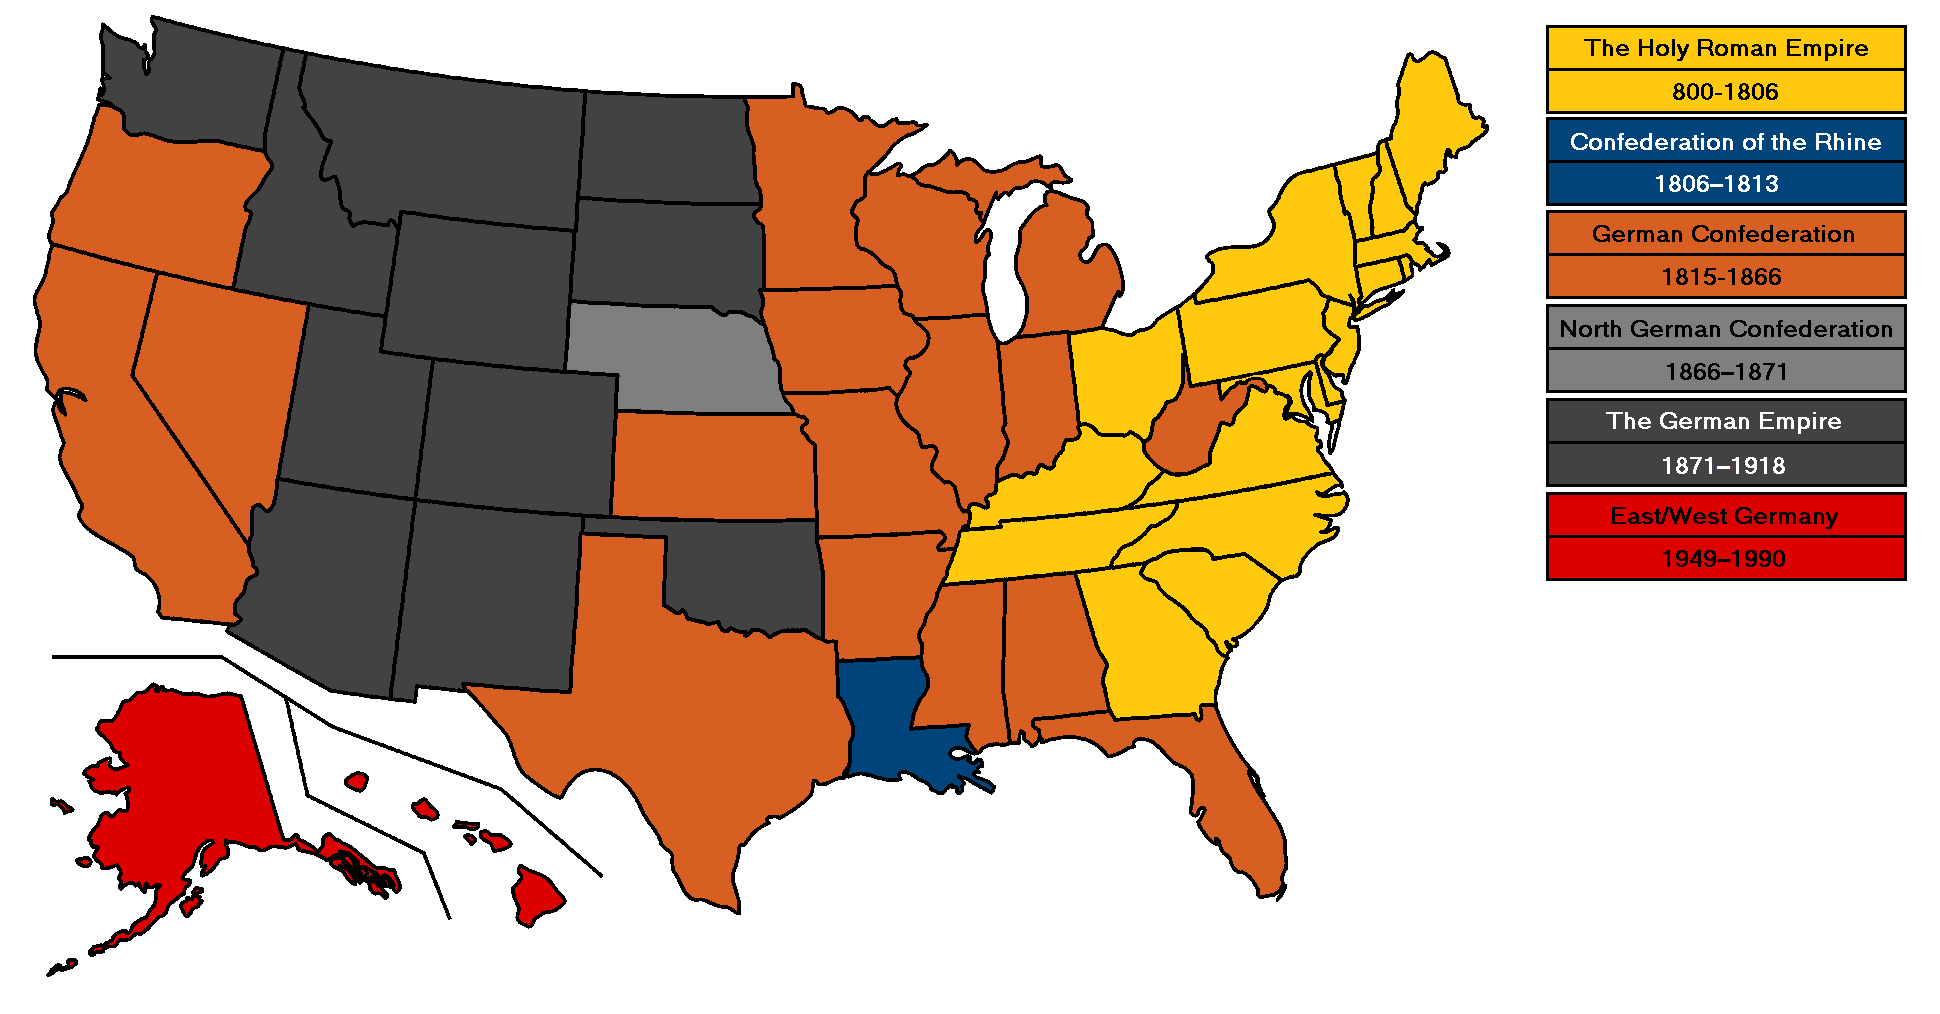
Ok so the title is a little confusing but hopefully when you look at the maps it will make a bit more sense. The first map shows who the reigning British Monarch was when the US state became a state. Credit lapras-27 George III (1760–1820) Alabama Connecticut Delaware Georgia Illinois Indiana Kentucky Louisiana Maryland Massachusetts […]
Show full content
Ok so the title is a little confusing but hopefully when you look at the maps it will make a bit more sense.
The first map shows who the reigning British Monarch was when the US state became a state.
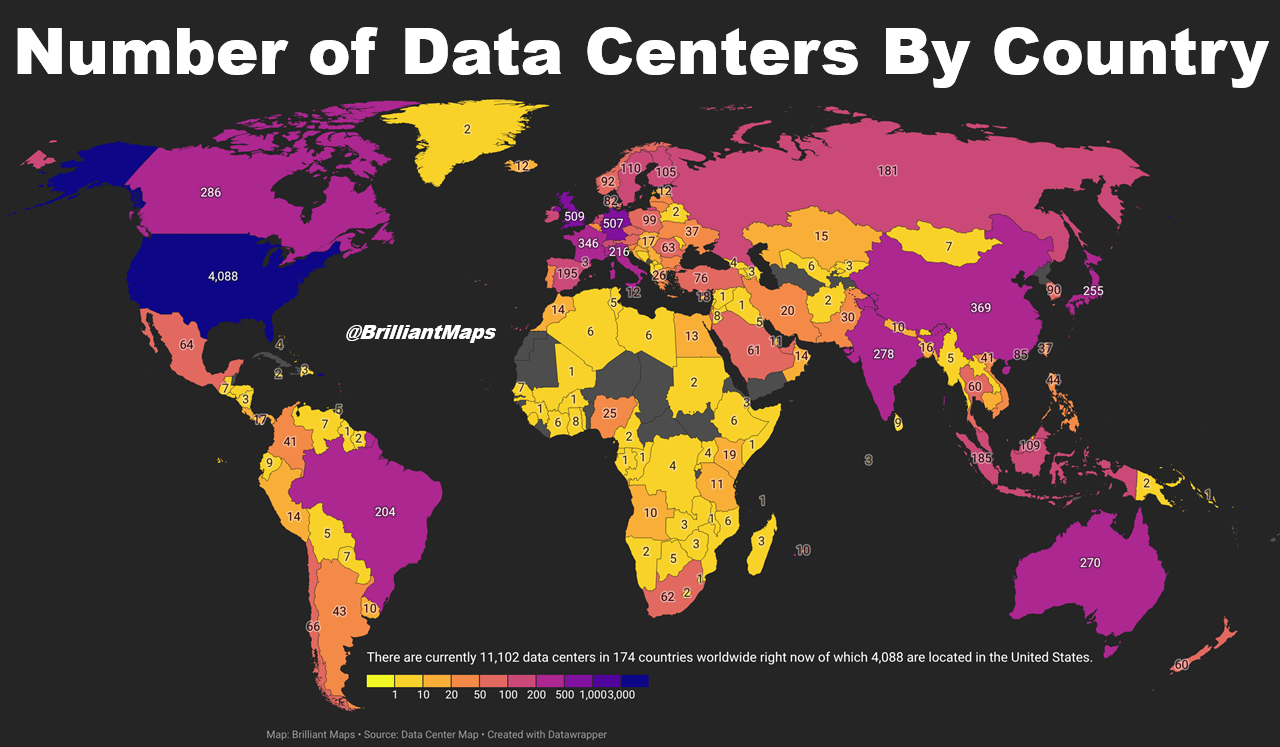
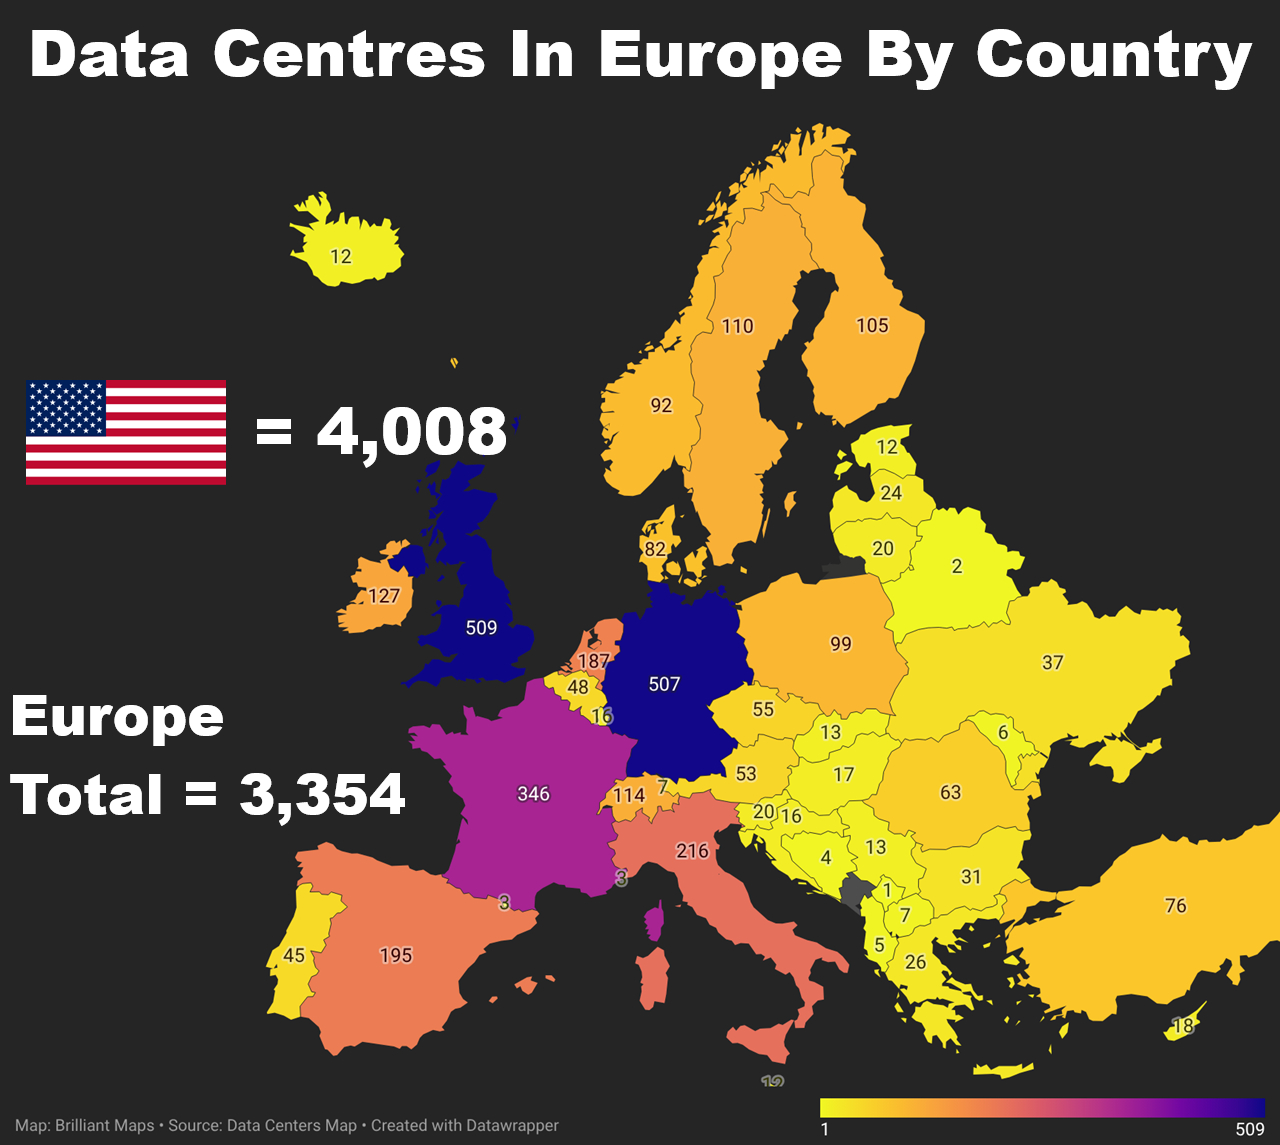
The map above shows the number of Data Centers by country in the world according to Data Center Map and based off their numbers the US is the clear leader with over 4,000 compared to its next closest competitor the UK which has just 509. China is listed as only having 369 which seems suspiciously […]
Show full content
The map above shows the number of Data Centers by country in the world according to Data Center Map and based off their numbers the US is the clear leader with over 4,000 compared to its next closest competitor the UK which has just 509.
China is listed as only having 369 which seems suspiciously small.
So how is the data gathered? Data Center Map states:
Our database is global and covers data centers from all over the world, from data center operators and service providers offering colocation, cloud and connectivity services. We cover everything from hyperscale data centers to edge data centers, in both smaller markets and tier 1 markets in popular metros.
The data center listings in the database are primarily submitted and maintained directly by the operators, which means that the database is updated on a daily basis and constantly growing with new data centers. The data we collect, give you access to a unique research tool with industry leading statistics and insights.
The database can be accessed through our maps, our search and find functionality or our catalogue/directory pages, where you can narrow in from looking globally, by region, by country, by state or even by district.
So given that it’s the operators just submit the data themselves, it’s highly likely that most Chinese companies are just not doing that which is why their numbers are so small.
In any case, they list a total of 11,102 data centers in 174 countries worldwide. Here’s the full list:
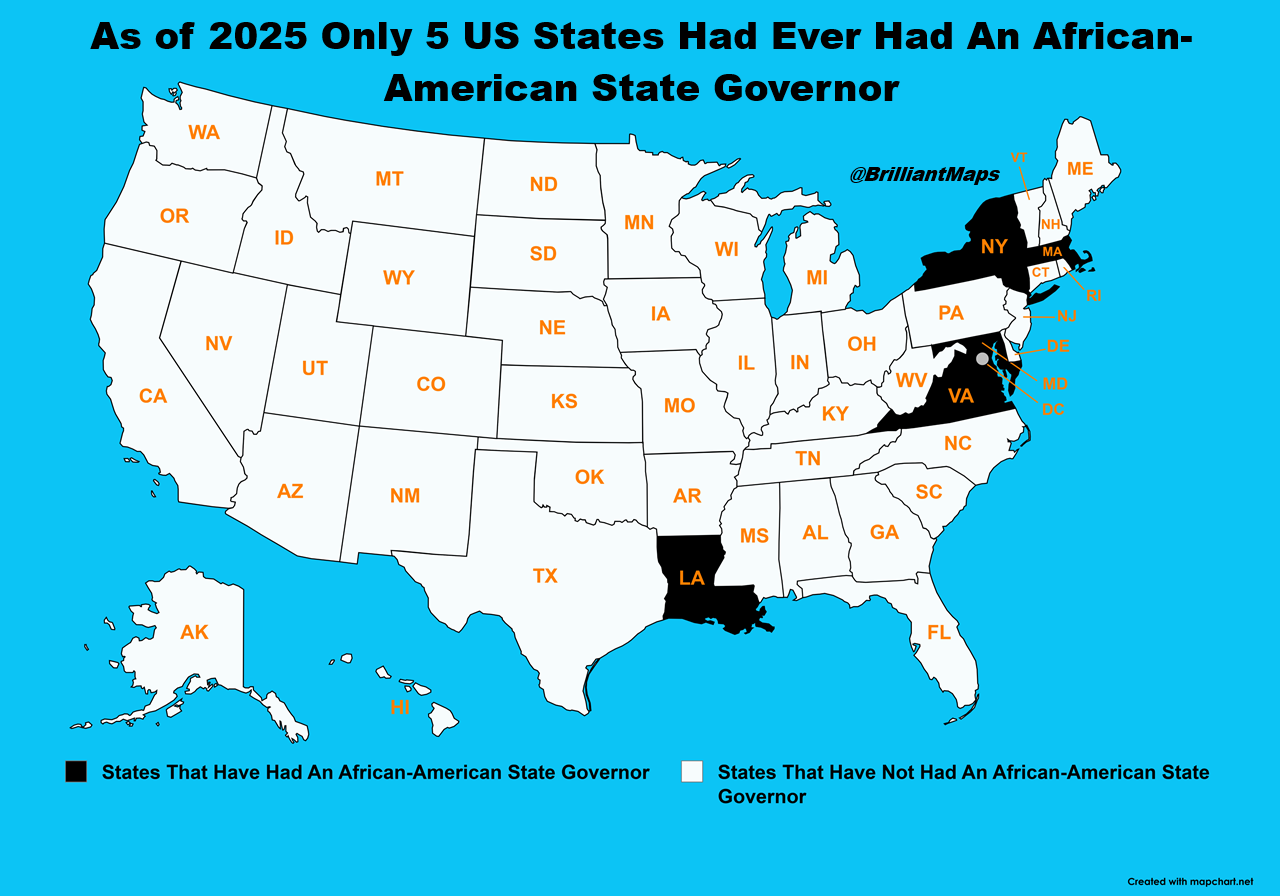
The map above shows a rather shocking state as of 2025, only 5 US states had ever had an African-American State Governor (all men), and in the case of Louisiana that was well over a century ago during the era of reconstruction. More about the the 5/6 men below: 1. P.B.S. Pinchback (Louisiana, 1872–1873) First […]
Show full content
The map above shows a rather shocking state as of 2025, only 5 US states had ever had an African-American State Governor (all men), and in the case of Louisiana that was well over a century ago during the era of reconstruction.
More about the the 5/6 men below:
1. P.B.S. Pinchback (Louisiana, 1872–1873)
First African American governor in U.S. history (although this is disputed by some see Oscar Dunn below)
Served for about 35 days
Came to power during Reconstruction after a disputed election.
Louisiana Controversy:
The 1872 election in Louisiana was highly disputed, with multiple rival governments claiming legitimacy
Both Republicans and Democrats accused each other of fraud
Pinchback became governor after the sitting governor was removed amid this chaos
His governorship was technically legal, but widely challenged and politically unstable
Because of this turmoil, some historians debate how to classify his tenure (though he is officially recognized)
2. Douglas Wilder (Virginia, 1990–1994)
First African American elected governor by popular vote
Won a very close election in 1989
Known for fiscal conservatism and balancing Virginia’s budget
Focuses on economic mobility, education, and public service
O.? Oscar Dunn (Louisiana, 1868–1871)
Oscar James Dunn is a crucial figure, and often overlooked, in this history.
Why he matters
First African American elected statewide executive official in the U.S.
Elected Lieutenant Governor of Louisiana during Reconstruction (1868)
A formerly enslaved man who rose to one of the highest offices in the state
Did he act as governor?
Yes, very likely, at least briefly.
As lieutenant governor under Henry Clay Warmoth, Dunn would have:
Exercised gubernatorial powers when Warmoth was absent
However, records are incomplete, so:
Historians generally say he “likely served as acting governor”, but exact dates/times aren’t well documented
Political conflict
Dunn wasn’t just a placeholder—he was deeply involved in power struggles:
He broke with Governor Warmoth over:
Corruption
Control of the Republican Party in Louisiana
Dunn aligned with more radical Reconstruction policies supporting Black political rights
Mysterious death (possible controversy)
Dunn died suddenly in 1871 at age 49
Many contemporaries suspected poisoning, though it was never proven
His death:
Shifted political power in Louisiana
Weakened Black political leadership during Reconstruction
Why he’s important historically
Preceded P.B.S. Pinchback
Represents one of the earliest examples of Black executive power in the U.S.
His career shows how fragile Reconstruction-era gains were
Key takeaway
If Pinchback is considered the first Black governor,
Then Oscar Dunn is arguably the first African American to exercise gubernatorial authority, even if only temporarily and less formally documented.
And finally here are African American lieutenant governors who briefly served as acting governor, usually when the elected governor was out of state, resigned, or temporarily unable to serve. These roles were often short but still historically important.
George W. Haley (Kansas, 1969–1973)
First African American Lieutenant Governor of Kansas
Served briefly as acting governor during absences of the governor
Brother of author Alex Haley
Mervyn Dymally (California, 1975–1979)
First African American Lieutenant Governor of California
Served as acting governor multiple times when Jerry Brown was out of state
One of the earliest Black officials to exercise gubernatorial powers (even if temporarily)
Pierre Howard (Georgia, 1991–1999)
First African American Lieutenant Governor of Georgia
Served as acting governor at times during the governor’s absence
Important figure in Southern Black political leadership post–civil rights era
David Paterson (before becoming governor in 2008)
As lieutenant governor, he temporarily acted as governor when Eliot Spitzer was unavailable
Later became full governor after Spitzer resigned (making him more than just acting)
Winsome Earle-Sears (Virginia, 2022–present)
First Black woman elected state-wide in Virginia
Has the constitutional ability to act as governor when Glenn Youngkin is absent (as modern lieutenant governors do)
How “Acting Governor” Works
In most states, when the governor leaves the state or is temporarily unavailable, the lieutenant governor assumes powers
These stints can last from hours to days, but they are legally significant
This is why some figures are noted in history even if they were never elected governor outright
 Map created by reddit user AegeanRepublic
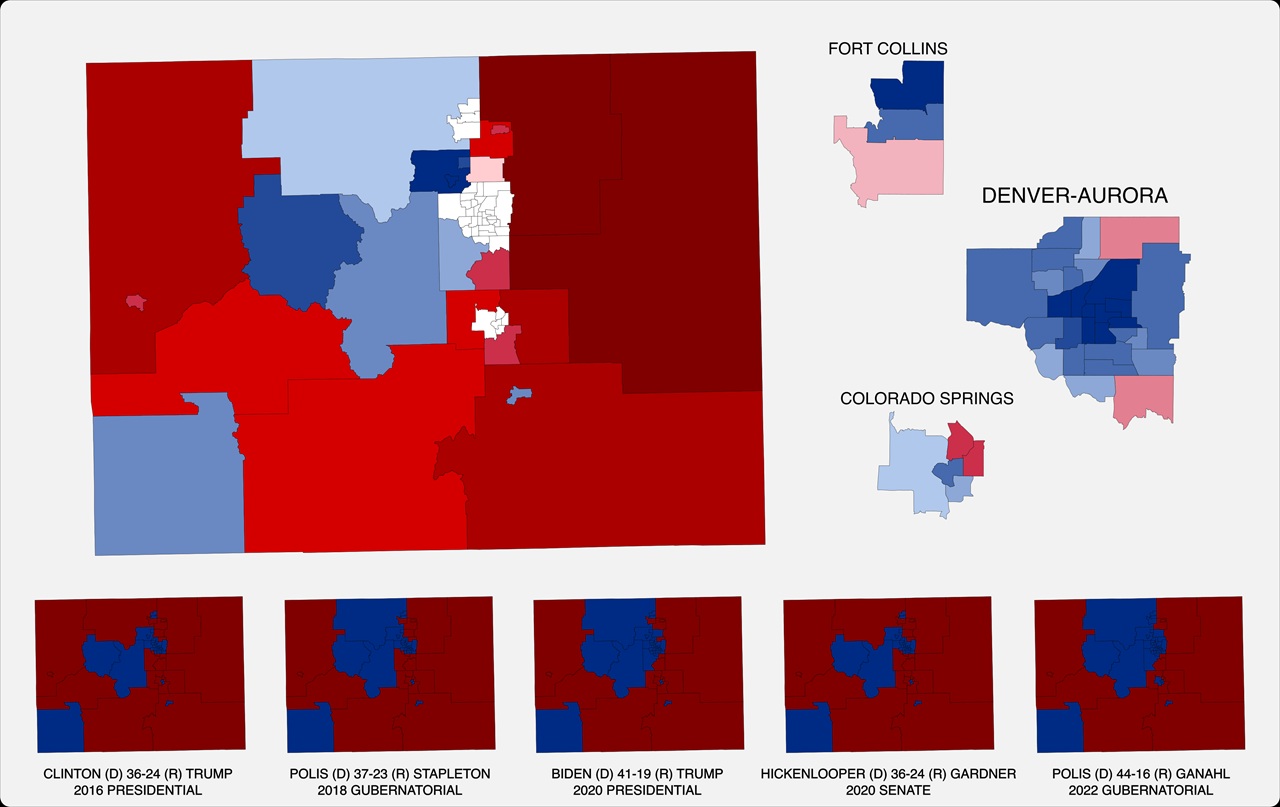

 Connection to Star Trek